WEDDA - An Aggregation Strategy for
Cluster Based Wireless Sensor Networks with
Sparsely Placed Sensor Nodes
Dr. Kamlendu Kumar Pandey
Assistant Professor, Dept. of Information and Communication Technology, Veer Narmad South Gujarat University,
Surat, India
ABSTRACT: Data Aggregation in sensor networks is an important task to direct the sensors to gather, disseminate and aggregate the data according to the applications for which they are deployed. This saves a lot od energy as compared to continuous sensing and transmitting the data. This paper deals with the placement and aggregation of data when sensors are sparsely places in a large area. The new aggregation strategy WEDDA gives a considerable performance as compared to other strategies. As routing is combined with the aggregation techniques, to give a very clear view of the effectiveness of WEDDA aggregation protocols
KEYWORDS: data aggregation; wireless sensor networks; cluster based networks; WEDDA
I. INTRODUCTION
Although wireless sensor networks are not supposed to aggregate the data on the sensor node due to memory and power constraint but it in absence of that the huge volume of the transmitted data and using routing algorithms to send the data to gateway depletes the power on sensor nodes. Secondly the problem domain may not be interested in the raw sensed data but disseminated value of data. If the nodes do the dissemination then the data traffic can be greatly reduced, In such cases the aggregation on nodes or cluster heads become inevitable. This paper talks about the problems which require cluster based layouts. The aggregation running on nodes or cluster head is one of the most memory and power consuming task in wireless sensor networks. This paper deals with the clusters based layout where a cluster head represents a very large area with sparsely placed motes to sense the data .
Rajgopalan et al [1] have classified the routing protocols on the basis of topology, Network flow and QoS based. In flat topology the aggregation can take place through push diffusion and pull diffusion. In the push diffusion scheme, the sources are active participants and initiate the diffusion while the sinks respond to the sources. The sources flood the data when they detect an event while the sinks subscribe to the sources through enforcements. The pull diffusion can be implemented by SPIN . In case of pull diffusion , it is a data centric routing scheme which is based on the data acquired at the sensors. The attributes of the data are utilized message in the network. This aggregation can be implemented by the Directed Diffusion as discussed earlier. The pull diffusion is further divided into Two Phases and Single Phase pull division. Directed diffusion represents two phase pull diffusion.
aggregation or tree based aggregation protocols, Ding et al. [4] have proposed an energy aware distributed heuristic (EADAT) to construct and maintain a data aggregation tree in sensor networks.
The algorithm is initiated by the sink which broadcasts a control message. The sink assumes the role of the root node in the aggregation tree. Tan et al. [5] have proposed a power efficient data gathering and aggregation protocol (PEDAP). The goal of PEDAP is to maximize the lifetime of the network in terms of number of rounds, where each round corresponds to aggregation of data transmitted from different sensor nodes to the sink. PEDAP is a minimum spanning tree based protocol which improves the lifetime of the network even when the sink is inside the field. In case of network flow based data aggregation techniques Kalpakis et al. [6] have studied the maximum lifetime data gathering with aggregation (MLDA) problem employing efficient data aggregation algorithms. The goal of the MLDA problem is to obtain a data gathering schedule with maximum lifetime where sensors aggregate incoming data packets. In QoS based aggregation schemes AIDA [7] and ESPDA[8] are prominent. The applied independent data aggregation (AIDA) performs lossless aggregation in which the upper layer decides whether information compression is appropriate at that time. The AIDA architecture consists of a functional unit that aggregates and de- aggregates network packets. In addition, there is a control unit that adaptively controls timer settings and tunes the degree of aggregation. The transmission and control overhead is reduced by aggregation of multiple network units into a single AIDA aggregate. In ESPDA, the sensor nodes send the pattern codes to the cluster head for data aggregation. The sensor data is transmitted to the sink in an encrypted form without being decrypted anywhere in the transmission path. ESPDA aims at achieving energy efficient data aggregation with secure data communication. Each sensor node executes the pattern generation (PG) algorithm to generate the pattern code. The cluster head uses a pattern comparison algorithm to analyze the patterns.
Although researchers have proposed and worked on many strategies they cannot be applied universally in all applications. Actually data aggregation is mostly application specific. The application in consideration in this paper is soil moisture deficit monitoring.
II. DESCRIPTION OF PROBLEM
Placement of ZIGBEE Sensor nodes in a large area requires economy in cost and performance of installation. The inherent limitation of signal transmission distance of such motes is a challenge to cope with. The transmission interval of the data on the motes has to be decided to maximize the mote life without loosing the effectiveness of data. In this paper an effort is done to find an optimum layout and a suitable data aggregation strategy to solve the problem
III. SENSOR LAYOUT OPTIMIZATION FOR LARGER AREAS
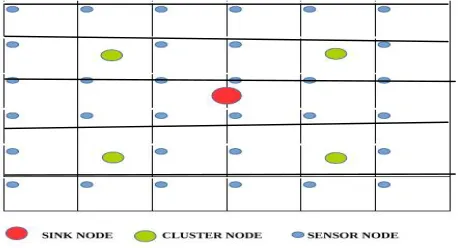
To understand the case of larger area for sensor layout a case of moisture sensing for an irrigation area is considered. A subchak (the primary irrigation unit in the command area) is of 5 to 10 hectare. An area of 9 ha ( 300 m X 300 m) a square field is considered for sensor layout . Fig 1. shows the layout of sensor nodes , cluster head and SINK in the area. Every sensor node represent and effective area and the moisture sensed by sensor node becomes the representative data for that area. All the sensor nodes are transmitting the aggregated data to the cluster head and cluster head transmits the data to the sink which can be collected by high end computers and then processed further for water supply in chaks Algorithm 1. shows the algorithm developed for this condition.
ALGORITHM TO DETERMINE CLUSTER HEAD var i as int
var n → No of Nodes
var c → node no of cluster head
var N[i](xi,yi) → Node no. i at coordinates xi and yi var N[0] → Access Point
1. var NBUFFER[128] → buffer memory on cluster head to store xi an yi of different nodes
2. var SUM_NCH → Sum of distances of Nodes and the cluster head
1. var SUM_NA → sum of distances from nodes to Access Point
2. var EDR → effective distance ratio
3. var MIN → find minimum
IV. AGGREGATION STRATEGIES
Aggregation is to get the data from different sources (in this case, from sensor nodes) and apply some aggregate functions like SUM, MIN, MAX, AVG , STDDEV etc and decide what kind of data is to be send. This decreases the overhead on cluster head and sink.
The major challenge in wireless sensor network is the way to get the data at access point. For a WSN sensing and sending the data continuously consumes a lot of energy on nodes, cluster heads and access point . The way the data should be sensed is more application specific. Some applications like live weather monitoring the change in the data are slow and gradual. Lot of research has been done in this area and is discussed in the literature review also. Most of the researchers have combined aggregation and data reporting with routing protocol but in this way a certain routing protocol becomes bonded with a certain aggregation scheme.
It is decided in this research to keep the aggregation layer completely different from routing layer such that a routing protocol is free to adopt any aggregation strategy. So the aggregation techniques now become the part of the application layer than the routing layer. For the convenience of researchers and implementers the aggregation strategies are classified on the basis of the sensing interval, dissemination interval and events occurring in the network
1. Continuous Packet Sensing and Dissemination (CPSD) 2. Continuous Packet Collection and Dissemination (CPCD) 3. Programmed Packet Collection and Dissemination (PPCD 4. Programmed Packet Aggregation and Dissemination (PPAD)
A new Suggested Strategy for the problem
Weighted Event and Demand Based Data Aggregation (WEDDA)
1. Continuous Packet Sensing and Dissemination (CPSD)
In this scheme there is practically no aggregation. It is also called zero aggregation schemes. In this the node senses the data at some predefined small sensing intervals. The node does not store the data for longer but immediately transmits it to the cluster head or to the network in non-hierarchical layouts. This strategy is employed when the change in data is very quick and missing even a small fraction of it may result in failure of the application. Most of the intruder detection system adopts such type of strategy. This scheme requires frequent power backups as the batteries of nodes drain away faster.
2. Continuous Packet Collection and Dissemination ( CPCD)
This is a better alternative to the earlier one . In this case every node has some data buffer area on the board and all sensed data packets are collected in this buffer. The nodes will not disseminate the data until the buffer is filled up. The buffer may be hardware controlled or a certain memory can be assigned by the software from the flash memory possessed by mote. In this although there is continuous sensing but dissemination interval is longer and every node will wait till the buffer is filled up. Due to increase in dissemination time the overhead of handling the packets of neighboring nodes by the cluster head or other nodes will decrease. This can reduce the consumption of power, as each dissemination consumes some battery power. This strategy can also be used the critical data as in CPSD.
This is a bit similar to CPCD but here filling up of the memory buffer is not the criteria but a certain time interval is set for dissemination of data from every node. In this case, although data is being sensed continuously and stored in the buffer area but the node will not disseminate the data in the network till the dissemination timer expires. If the buffer area is filled up before the dissemination time then the new packet replaces the oldest packet in the buffer. Such an aggregation scheme is important when data in a certain regular time interval is important. Increasing the dissemination time will reduce the frequency of packet transmission on the network. So for the application where every data is not so critical, the appropriate dissemination interval will considerably reduce the power requirement of sensor node.
4.Programmed Packet Aggregation and Dissemination (PPAD)
This strategy is adopted in the applications in which each and every reading is not important but their aggregate functions are more important. In the node sense the data and apply the aggregate functions like AVG, MIN, and MAX STDDEV etc on them. Only the aggregated value is finally stored in the node. This goes on till the dissemination timer expires. This is extreme power saving and memory saving strategy as only one data is finally saved in the node. The dissemination interval can be fixed on basis of the importance of timing in which the aggregate data is important. Applications like measuring average temperature every half an hour will require this strategy.
5.Programmed Demand Based Aggregation and Dissemination (PDAD)
In all earlier strategies it was sensor nodes responsibility to sense and disseminate the data as per predetermined policy. In this case the data gathering is proactive and initiated by the access point. This is demand based. The nodes may be sensing the data and use some aggregation scheme on the data but they will disseminate only on demand by access point. This demand can be simple data collection from the nodes or a parameterized query which will have a conditional data collection. For example an access point can query the network to give the temperature reading of the node above 30 degree centigrade. Such complex queries can be broadcast in the network by and all the nodes will respond to the on demand parametric query. This strategy has complete control on data dissemination and useful in the application where data must be available only on demand and not all the time. This strategy saves considerable energy based upon the time interval of broadcasting on demand query.
All the protocols mentioned above do not satisfy the requirement of moisture data aggregation. CPCD, CPSD, PPCD do not apply any aggregation function on the collected data. PPAD, PDAD apply aggregation function but it is generic and not application specific. It is therefore we need to devise a strategy which can satisfy the requirement of applying aggregation on data collected. The strategy called WEDDA is presented as below.
6. WEDDA: A New Aggregation Strategy
WEDDA stands for Weighted Event and Demand based Data Aggregation . This aggregation strategy is useful in the applications where not all the sensed data but the one which are satisfying an event of meeting threshold value condition is important. This is exactly the case of our application. In irrigation all the sensed data is not important. The system needs to be alerted if the event of soil moisture level goes below a certain predefined level. In this all the nodes will sense but will not store the data at a certain sensing interval and will keep only latest soil moisture data in memory buffer as soon as the sensed data goes below prefixed level. The node will disseminate the data to its cluster head. The cluster head will too wait for other nodes to report the same kind of data. Each data from a individual sensor node has hot a weighted value depending upon the distance of node to cluster head.
To find the weighted value of the data from node
It is a fair assumption that the node is placed approximately at center of the area, it represents. As nodes are directly reporting to cluster head, larger the representational area larger is the distance from the cluster head.
The weighted multiplying factor Wi to the node i Di
Wi =
i=n
∑Di
i=1
Where Di= Distance of cluster head to the ith node n = total no of nodes The moisture at the cluster head is calculated as N
Mc = ∑ Wi * Mi
i=1
In this case if at least 60% of the nodes report the sensed soil moisture below a certain level then this condition should be treated as stress condition and it will be immediately reported with averaged out values of soil moisture to the access Point and ultimately to a Middleware application. This strategy also handles proactive and on demand data from the access point to see the present status of soil moisture in the irrigation command of subchak or chak. As all the aggregation schemes are application specific we treat it as different layer and this layer is conceptualized, modeled and programmed in the subsequent simulation services of the Network Layer.
ALGORITHM OF WEDDA- Event Based
Var D[N], Mi, Magg, count 1. FOR i= 1 to n
Dtotal = Dtotal + Di Next
2. FOR i= 1 to n Wi = Di / Dtotal Next
3. FOR i= 1 to n Input Mi
Magg = Magg + Wi*Mi Count = count + 1 If (count >= 0.6* n)
Function disseminate_to_sink Next n
WEDDA( Demand Based) Algorithm
var criteria, M, Nc, AP
// Criteria : =, > , < M : Moisture value // Nc ; cluster node , AP Access Point 1.function send_query( AP(criteria, M)) 2. function getData(Nc)
3. if (criteria(M,Mc)
Function send(Nc, AP) // cluster node sends data to Access Point End if
V. SIMULATION
The simulation of the problem was done on Network Simulator NS2 with the following parameters 1 Channel Type: Wireless Channel
2
Radio-PropagationModel: TwoRayGround 3 Network Interface Type: WirelessPhy/802_15_4 4 MAC type: Mac/802_15_4
5 Interface Queue Type: DropTail/PriQueue 6
Link Layer Type: LL
7 Antenna Model: Omni Antenna 8 Queue Length: 50
9 Network Layer Protocol:
AODV/DSDV/DSR/TORA/LEACH/GATHAR
10 Aggregation strategies : CPSD, CPCD, PPCD, PPAD, PDAD, WEDDA 11 Size of the Topography: 700 X 50012
The Constant Simulation Parameters are, 13 Active Data Senders: 75% Sensor Nodes 14 Sensor Data Size: 64 Bytes
15 Fused Data Size: 512
17 Channel Error Rate: 0.15 18
Total Simulation Time: 10 19 Instructions Per Second_ 8000000 20 Nodes : 50, 75, 100, 125, and 150
VI. RESULTS AND ANALYSIS
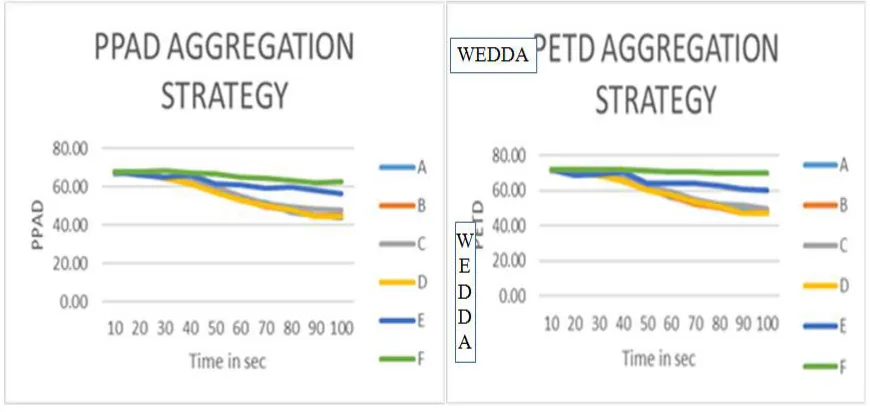
Various simulations run were done on the above mentioned parameters and . The trace files were analysed for the energy consumed on nodes with respect to various strategy for various routing schemes. Fig 1.2 to Fig 1. shows the graph plots of energy consumed vs no of nodes adopting various aggregation strategies. The routing strategies for simulations are
The Over all performance for the energy remaining in the networks is given in Table 1.1 of the networks based upon various aggregation strategies is as follows
Table 1.1 %age increase in the performance of energy remaining due to WEDDA as compared to other aggregation strategy
VII. CONCLUSION
In the simulated result in an ideal shape and size of the subchak, it is very apparent from the results and analysis that the WEDDA strategy of aggregation gives the highest performance as compared to other aggregation strategies. The performance varies from 0.8 % to as high as 28 % in terms of saved energy in the network.
REFERENCES
1. Rajagopalan, Ramesh and Varshney, Pramod K., "Data aggregation techniques in sensor networks: A survey" (2006). Communication Survey and Tutorials IEEE Vol. 8 Issue 4 2006 ISSN : 1553-877X pp 48-63
2. O. Younis and S. Fahmy, “HEED: a hybrid, energy-efficient, distributed clustering approach for ad hoc sensor networks,” IEEE Transactions on Mobile Computing , vol .3 , no. 4, Dec 2004, pp. 366-79.
3. S. Chatterjea and P.Havinga, “A Dynamic data aggregation scheme for wireless sensor networks,” Proc. Program for Research on Integrated Systems and Circuits, Veldhoven, The Netherlands, Nov. 2003 pp 10-17.
4. M. Ding, X. Cheng and G. Xue, “Aggregation tree construction in sensor networks,” 2003 IEEE 58th Vehicular Technology Conference, vol.4, no.4, October 2003, pp 2168-2172.
5. H. O. Tan and I. Korpeoglu, “Power efficient data gathering and aggregation in wireless sensor networks,” SIGMOD Record, vol. 32, no. 4, December 2003, pp 66-71.
6. K. Kalpakis, K. Dasgupta and P. Namjoshi, “Efficient algorithms for maximum lifetime data gathering and aggregation in wireless sensor networks,” Computer Networks, vol. 42, no. 6, August 20 03, pp.697-716.
7. T. He, B.M. Blum, J.A. Stankovic, and T. Abdelzaher, “AIDA: Adaptive applicationindependent data aggregation in wireless sensor networks,” ACM Transactions on Embedded Computing Systems , vol. 3, no .2, May 2004, pp. 426-457
8. Ozdemir, Suat, and Yang Xiao. "Secure data aggregation in wireless sensor networks: A comprehensive overview." Computer Networks 53.12 (2009): 2022-2037.
BIOGRAPHY