ABSTRACT
COOK, AMBER CHRISTINA. Development and Application of Novel Hydrazide Tagging Reagents for Glycome Quantification as a Method for Elucidating Glycostasis and Bio-Chemical Individuality. (Under the direction of David C. Muddiman).
Bioanalytical characterization and quantification of protein post-
translational modifications (PTMs) is fundamental to elucidating the
functions and activities of PTMs in mediating intra- and extra- cellular
interactions. More importantly, how and to what degree do
post-translational modifications participate in mediating human health as well
as change in response to illness or disease? In a typical discovery-based,
bottom-up proteomics experiment (i.e., whole proteome is digested with a
proteolytic enzyme), one can often detect the presence of PTMs, including
phosphorylation, glycosylation, acetylation and ubiquitination.
Biomarker-based mass spectrometry (MS) has evolved exponentially
over the past 20 years, facilitating in-depth analysis of biological samples.
Moreover, comparative genomics, transcriptomics, proteomics, glycomics,
and metabolomics have increased awareness of the integrated complexity of
systems biology. Emergence of high throughput “-Omics” technologies has
enhanced the efficacy of integrated systems biology research, thus improving
our scientific understanding of cellular health and function.
quantify significant changes at the bio-molecular level. It is estimated that
60-90% of all mammalian proteins are glycosylated together with membrane
and secreted proteins are almost always observed to be glycosylated.
N-linked glycosylation is a recognized PTM; responsible for the enormous
complexity of the glycoproteome. Accordingly, the overwhelming number of
reports supporting the correlation of aberrant glycosylation to illness and
disease, has prompted the emerging study of glycans, collectively known as
glycomics.
A deeper understanding of glycan homeostasis and bio-chemical
individuality associated with N-linked glycosylation provides the motivation
for the scientific contributions presented. The development of N-glycome
relative quantification strategy: Individuality Normalization and Labeling
with Isotopic Glycan Hydrazide Tags (INLIGHT), provides a comprehensive
glycomics platform for identification and quantification of N-linked glycans
isolated from complex biological systems. The INLIGHT workflow was
applied longitudinal hen plasma for the purpose of interpreting intrinsic
biological variability associated with N-linked glycostasis (glyco = glycan;
stasis = homeostasis), referring to the ‘normal’ physiological variability
© Copyright 2015 Amber Christina Cook
Development and Application of Novel Hydrazide Tagging
Reagents for Glycome Quantification as a
Method for Elucidating Glycostasis and
Bio-Chemical Individuality
by
Amber Christina Cook
A thesis submitted to the Graduate Faculty of
North Carolina State University
in partial fulfillment of the
requirements for the degree of
Master of Science
Chemistry
Raleigh, North Carolina
2015
APPROVED BY:
Gufeng Wang
James N. Petitte
Associate Professor, Chemistry Professor, Poultry Science
DEDICATION
I dedicate all my successes, and all failures to: my God and Savior
Jesus, my daddy (Jeff) and my mama (Loida), my sister (Krystal), my brother
(Brandon), and my grandma (Ellie). I would also like to extend my gratitude
to my boyfriend and the most supportive best friends anyone could ask for.
Thank you for your unconditional love and support in the past, present and
future. I thank you for your patience, encouragement, prayers and most of
BIOGRAPHY
Amber Christina Cook was born in Morehead City, North Carolina on
May 4, 1988. Eldest of three, to Jeffrey Cook, a U.S. Marine, and Loida
Cook, a Filipino immigrant whom he meet during his first tour. Loida
demonstrated persistent strength, raising three first-generation
Filipino-Americans to assimilate into American society as she continued to teach
herself English and embrace the American spirit. Jeff, an example of
perseverance and determination to create a future full of opportunity for his
children, engineer at General Electric Inc. while taking night classes at North
Carolina State University. The first Cook to attain a college degree; earning
his Bachelor of Science in Electrical Engineering and Computer Science in
1995, exposed Amber to the transformative power of higher education.
Scientific inquisitiveness spawned at the age of 8, when Amber was
given a microscope by her grandmother, Ellie. Amber gained an analytical
perspective and thirst for knowledge, winning science fairs for her
demonstration of Ohm’s Law in 6th grade and Mendelian genetics in the
Amber began her higher education at the College of Southern
Maryland (La Plata, Maryland) during her senior year at Great Mills High
School. In the fall of 2007, Amber continued her undergraduate studies at
West Virginia University (Morgantown, West Virginia), and graduated with a
Bachelor of Science in Chemistry spring 2011. Under the guidance of
Biochemical Toxicologist, Dr. Jonathan W. Boyd, she conducted
undergraduate research investigating signal transduction pathways of
glycolysis and apoptosis in response to cancer. Amber’s research earned
best poster presentation in the Biology and Chemistry division at WVU’s
undergraduate research symposium as well as a travel scholarship to attend
The 2011 Society of Toxicology Meeting in the nation’s capital, Washington
D.C.
In fall 2011, Amber was accepted into the Graduate Program in the
Department of Chemistry at North Carolina State University (Raleigh, NC).
Amber was welcomed to conduct bio-analytical research in the W.M. Keck
Fourier Transform Mass Spectrometry Laboratory for Human Health
Research, under the guidance of distinguished professor, Dr. David C.
Muddiman. As a minority graduate student, Amber received sponsorship
graduate studies of ovarian cancer and glycosylation using analytical mass
TABLE OF CONTENTS
LIST OF TABLES ... vii
LIST OF FIGURES ... viii
CHAPTER 1: Mass Spectrometry-Based Glycomics ... 1
1.1 Biological Importance of the Glycome ... 1
1.1.1 N-linked Glycosylation ... 3
1.1.2 Aberrant Glycosylation and Ovarian Cancer ... 6
1.2 Relative Quantification of the Glycome ... 11
1.2.1 Overview ... 11
1.2.2 N-Glycan Release ... 12
1.2.3 Derivatization ... 13
1.2.4 Reversed Phase LC Separation and Electrospray
Ionization ... 18
1.2.5 Fourier Transform Mass Spectrometry ... 21
1.3 Summary ... 23
1.4 References ... 26
CHAPTER 2: Individuality Normalization when Labeling with
Isotopic Glycan Hydrazide Tags (INLIGHT): Relative
Quantification of N-Glycans ... 30
2.1 Introduction ... 30
2.2 Materials and Methods ... 31
2.2.1 Materials ... 31
2.2.2 N-Glycome Extraction ... 32
2.2.3 INLIGHT Glycan Derivatization ... 33
2.2.4 LC-MS Data Acquisition ... 34
2.3 Results and Discussion ... 36
2.4 Summary ... 43
CHAPTER 3: Longitudinal N-Glycome Profiling of Plasma for
Elucidating Glycostasis in the Laying Hen ... 49
3.1 Introduction ... 49
3.2 Materials and Methods ... 51
3.2.1 Longitudinal Bio-Repository ... 51
3.2.2 Biospecimen Collection ... 52
3.2.3 Materials ... 56
3.2.4 N-Glycome Extraction ... 56
3.2.5 INLIGHT Glycan Derivatization ... 57
3.2.6 LC-MS Data Acquisition ... 58
3.3 Results and Discussion ... 60
3.3.1 Glycome Comparison between Subjects ... 60
3.3.2 Glycome Comparison within a Subject ... 63
3.3.3 Reference Intervals Associated with Glycostasis .... 66
3.4 Conclusions ... 69
3.5 References ... 71
APPENDICES ... 73
Appendix A: N-linked Glycan Mass Calculations ... 74
Appendix B: Non-Polar Surface Area ... 76
Appendix C: N-Glycan Database ... 84
LIST OF TABLES
LIST OF FIGURES
Figure 1.1 Integrated Systems Biology ... 2
Figure 1.2 N-linked Glycosylation ... 4
Figure 1.3 N-linked Glycan Structure ... 5
Figure 1.4 N-linked Glycan Biosynthesis ... 5
Figure 1.5 Glycoprotein Secretion ... 9
Figure 1.6 Ovarian Cancer Statistics ... 10
Figure 1.7 Permethylation ... 14
Figure 1.8 Reductive Amination ... 15
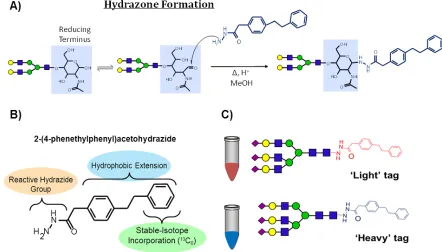
Figure 1.9 Hydrazone Formation ... 17
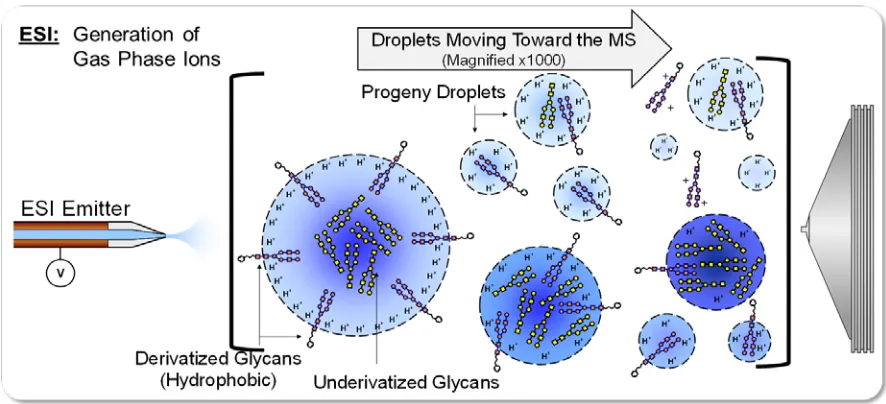
Figure 1.10 Hydrophobic Bias ... 20
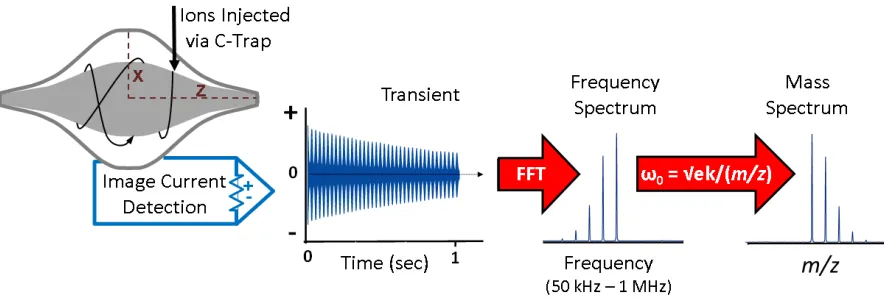
Figure 1.11 Fourier Transform Mass Spectrometry ... 23
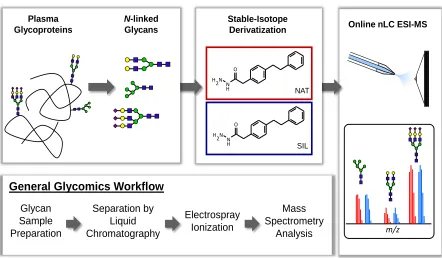
Figure 1.12 General Glycomics Workflow ... 25
Figure 2.1 INLIGHT Tagging Reagent ... 37
Figure 2.2 Hydrazone Formation Reaction ... 37
Figure 2.3 INLIGHT Sample Preparation Workflow ... 39
Figure 2.4 INLIGHT Relative Quantification Strategy ... 41
Figure 3.1 Timeline of Longitudinal Bio-repository ... 52
Figure 3.2 Glycostasis Plasma Collection ... 55
Figure 3.3 Inter-Individual Experimental Design ... 61
Figure 3.4 Inter-Individual Histogram ... 62
Figure 3.6 Intra-Individual Experimental Design ... 64
Figure 3.7 Intra-Individual Histogram ... 65
Figure 3.8 Intra-Individual Reference Intervals ... 66
Figure 3.9 Components of Variability ... 68
Figure B.1 Primary Reagent Library ... 77
Figure B.2 Non-Polar Surface Area Linear Regression ... 78
Figure B.3 INLIGHT Reagent Library ... 79
Figure B.4 Extended Akyl Chain Reagents ... 81
Figure B.5 Highly Branched Hydrazide Reagents ... 82
Figure B.6 Library of Linear, Conjugated Hydrazide Reagents ... 83
CHAPTER 1: Mass Spectrometry-Based Glycomics
1.1 Biological Importance of the Glycome
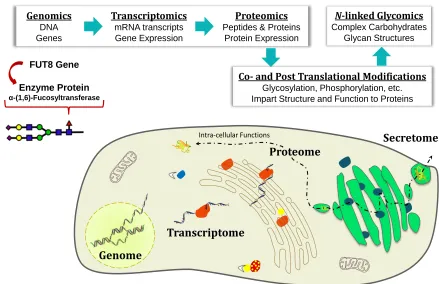
The rise of high throughput “-Omics” research has boosted the
efficiency of integrated systems biology. Systems biology has established
itself as a fundamental interdisciplinary field of research, whose focus is to
gain a deeper understanding of the processes responsible for maintaining
biological systems, as well as their involvement in the onset and progression
of diseases.1-2 Knowledge of the template-driven processes of: DNA
replication (genomics), mRNA transcription (transcriptomics), and protein
translation (proteomics) provides a foundation for scientists who study this
complex biological systems (Figure 1.1).
The genome, considered the primary language of life, encodes cell life
via nucleic acids and proteins. Like nucleic acids and proteins, glycans are
essentially complex macromolecules made of many monomer subunits.
These subunits are monosaccharides, also referred to as carbohydrate units
or sugar units. Unlike, nucleic acids and proteins, glycans are not directly
encoded by DNA, instead mature glycan structures are the product of
numerous concomitant enzymatic reactions. There are three major groups
of glycans: glycolipids, N-linked glycoproteins and O-linked glycoproteins.3
of biological availability (soluble and secreted), key structural features
(common core) and bio-analytical techniques available (enzymatic and
chemical specificity.3,4
Genomics DNA Genes
Transcriptomics mRNA transcripts Gene Expression
Proteomics Peptides & Proteins
Protein Expression
Co- and Post Translational Modifications Glycosylation, Phosphorylation, etc. Impart Structure and Function to Proteins
N-linked Glycomics Complex Carbohydrates
Glycan Structures
Genome
Transcriptome
Proteome
Intra-cellular Functions Secretome
FUT8 Gene
Enzyme Protein α-(1,6)-Fucosyltransferase
1.1.1 N-linked Glycosylation
Glycosylation is a profoundly critical mechanism for sustaining life in
biological systems. It is estimated that more than 50% of all gene products
are glycosylated. N-linked glycosylation is a co-translational and
post-translational modification of polypeptides and folded proteins, respectively.
The protein glycosylation begins in the lumen of the rough
endoplasmic reticulum (ER), where an oligosaccharide precursor is attached
to an asparagine residue of a co-translating polypeptide chain (Figure 1.2). The modification is specific to the nitrogen-containing side chain of
asparagine, known as N-linked glycosylation. More specifically, a precursor
glycan forms a covalent bond (i.e., carbon-nitrogen) with the asparagine side
chain of the co-translating polypeptide chain. At this point, all N-linked
glycans can be identified by their N-linked glycan core (Figure 1.3). Orchestrated by an array of enzymatic reactions, the non-template synthesis
of a mature N-glycan structure continues as the glycoconjugate makes its
way through the golgi apparatus. The Golgi apparatus is the intracellular
location of the glycan ‘decorating’ process. Glycan trimming by various
-- Gal [galactose] --H
-- Man [mannose] --H
-- NeuAc [N-acetylneuraminic acid] --A
-- Fuc [fucose] --F
-- GlcNAc [N-acetylglucosamine] --N
Glycan Nomenclature Symbol – Abbrev. [Name] -- Letter
Figure 1.3 N-linked Glycan Structure - High mannose glycan (Man9GlcNAc2) covalently bonded to the amide nitrogen located on the asparagine side chain. Conserved core structure is highlighted in the red box (Man3GlcNAc2-Asn).
1.1.2 Aberrant Glycosylation and Ovarian Cancer
Whether an alteration in enzyme activity leads to cancer development
or vice versa is still a mystery. However, the central hypothesis here is that
with the appropriate animal model, longitudinal sampling, high-throughput
glycomics analysis, and high resolving power instrumentation significant
differences between healthy and diseased states can be elucidated.
Furthermore, if we are to assume that a complex and diverse homeostatic
system has a ‘normal’ or ‘healthy’ state, then we ought to consider the degree
of natural ‘change’ or biological variability intrinsically associated. The
biological definition of homeostasis is somewhat of an oxymoron;
homeostasis is the maintenance of a dynamic steady state in response to
internal and external fluctuations. This complex process involves a variety
of feedback loops and coordinated ‘checks and balances’ systems in order to
properly sustain health.
As we seek to make a quantitative distinction between healthy
glycosylation and abnormal glycosylation patterns, we will refer to the former
as glycostasis (i.e., homeostatic regulation of glycans), specifically in the
context of natural physiological variability. As for investigating abnormal
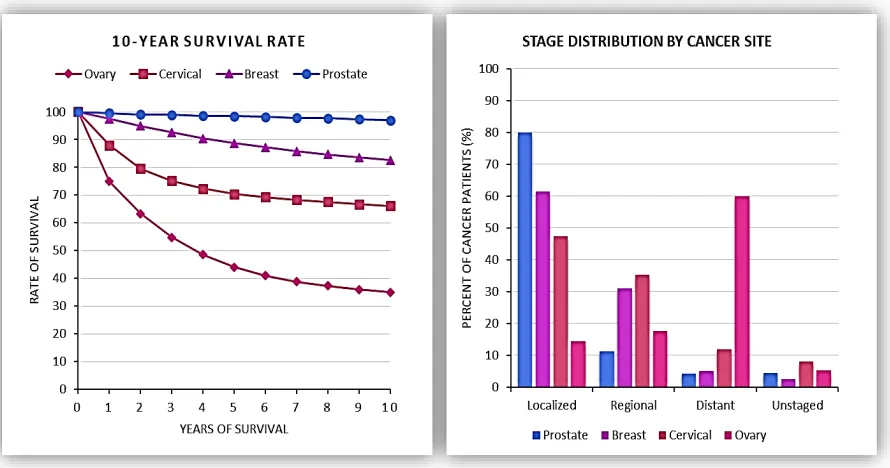
Ovarian Cancer (OVC) remains the fifth-leading cause of cancer
mortality among women in the United States; and is frequently undetected
until the cancer spreads into the pelvis and lower abdomen. Patient survival
rate is heavily dependent upon pathological staging (e.g., local, regional, or
distant) during initial diagnosis; early-stage OVC (locally confined to the
ovary), is more likely to be successfully treated by surgically removal and
chemotherapy. However, lack of i) OVC-specific symptoms and ii)
early-stage screening methods make it difficult to detect until latter early-stages. The
majority of OVC patients (61%) are diagnosed after the malignant cancer has
spread to distant organs, where the 5-year survival rate is 27% compared to
92% for localized OVC. Clearly, ovarian cancer research has the potential to
improve clinical outcomes by identifying early-stage biomarkers that can
reliably and accurately detect bio-molecular changes associated with OVC
development and progression.
In order to improve the overall survival rate for OVC patients, a
diagnostic screening assay is needed, potential biomarkers should be
clinically sensitive and specific for reliable detection of early-stage OVC.
Population-based diagnostic screening, similar to that of mammograms and
pap-smears for breast and cervical cancers, would likely increase detection
methods available, carbohydrate (cancer) antigen, CA-125, immunoassay is
approved as a prognostic biomarker for monitoring ovarian tumors during
late-stage progression and response to treatment. CA-125 is limited as a
diagnostic biomarker mainly due to its lack of specificity for early stage OVC.
It is imperative that any assay/methodology being used for biomarker
discovery research is robust, reliable, and stable, especially if results are
meant to have an impact on the future of clinical diagnostics.
As the systems biology paradigm continues to evolve as an integrated
view of the underlying disease, information from the developing –omics fields
(e.g., metabolomics, lipidomics, & glycomics) will increase scientific and
clinical interpretation for more established fields of genomics,
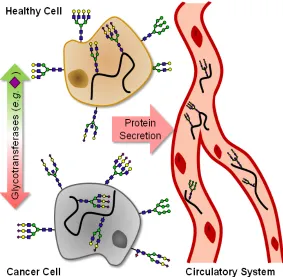
Figure 1.5 Glycoprotein Secretion - N-glycome extracted from plasma are
1.2 Relative Quantification of the Glycome
1.2.1 Overview
Typical analysis of O-linked or N-linked glycans (once they have been
isolated) requires that the naturally hydrophilic and labile oligosaccharide
structures be derivatized. Chemical derivatization methodologies that
enable detection by mass spectrometry include permethylation, reductive
amination, or hydrazone formation.6-10 It is important to note that in
instances where one can incorporate stable isotope labels via in vivo
labeling, IDAWG is a viable approach and one that CIL also supports.
The multi-functional hydrophobic, hydrazide reagents included in the
INLIGHT approach provide three main advantages which were key
determinants during the reagent development phase of these hydrazide
tags.11-14 First, the chemistry used to couple the hydrophobic tags with
cleaved N-linked glycans is hydrazone formation provides efficient
derivatization without requiring addition (and post-labelling removal) of salts
(as required in reductive amination techniques). Second, the hydrophobic
extension region dramatically improves response in electrospray ionization
and allows the use of reversed-phase chromatography. Third, the ability to
produce a version with a stable-isotope label (13C6) enables relative
1.2.2
N-
Glycan Release
In order to achieve confident glycan identification by mass detection,
it is advantageous to isolate the glycans from biological matrix. Fortunately
for N-linked glycan analysis, there are selective enzymes commercially
available. To release intact N-linked glycans from glycoproteins the
glycoamidase enzyme, peptide-N-glycosidase F (PNGase F) is the most
commonly used. The enzyme catalyzes a hydrolysis reaction at the
GlcNAc-asparagine linkage, leaving the intact glycan free form in solution. This
PNGase type enzyme is the only enzyme known to cleave whole, intact,
asparagine-linked glycans at the core GlcNAc, without the need to digest
proteins into peptides first. First purified from bacteria, PNGase F is also
acknowledged as the only enzyme of its type to cleave glycans from proteins
in there folded conformations. Tarentino and Plummer were the first to
experiment with the deglycosylation of oligosaccharides by PNGase F,
whereby they concluded that protein denaturation prior to enzyme (PNGase
F) digestion reduces the amount of enzyme required for complete
1.2.3 Derivatization
Derivatization strategies are typically employed to stabilize glycan
structure, enhance separation, ionization, and to add physiochemical
properties that assist detection via absorption, fluorescence or mass
spectrometry. Permethylation, reductive amination, and hydrazone
formation are derivatization strategies commonly used in MS-based
glycomics quantification. Permethylation is the oldest of carbohydrate
derivatization techniques and is still commonly used today because of its
ability to increased stabilization during ionization and multiple stages of
fragmentation (MSn), facilitating structural analysis.7,8 Permethylation
derivatization essentially replaces the hydrogen atoms of all available
hydroxyl, carboxyl, and amine groups with a methyl group (Figure 1.7). However, 100% derivatization efficiency is difficult to attain in
heterogeneous glycan mixture. The non-specific nature of permethylation
adds uncertainty if one is attempting to accurately determine glycan mass.
Variability among glycans will also become an issue since different glycan
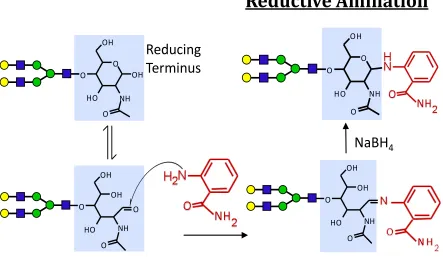
Reductive amination and hydrazone formation mechanisms are
attractive due to their specificity to the reducing termini of all releases
glycans. These strategies allow for the incorporation of fluorescent, UV
absorbing, and /or stable-isotope tags in addition to a single fixed mass shift
per glycan.8-12 Reductive amination is less favorable than hydrazone
formation because it requires post-derivatization purification of derived
species to remove salts added during reduction (Figure 1.8). This will increase time between glycan tagging and LC-MS analysis, risk for sample
loss and most importantly introduce analytical variability that will affect any
potential quantification accuracy.
Figure 1.7 Permethylation of a single monomer unit is shown. This type of derivatization will convert all available hydroxyl, carboxyl and amine groups to methyl esters.
Permethylation
O O H
O
H O H
O O
DMSO
CH3 I
OMe
O
MeO OMe
Hydrazone formation is the alternative derivatization strategy, similar
to reductive amination, but removes the need for post-derivatization
purification (Figure 1.9). After derivatization by this mechanism, the derivatized glycans are ready for LC-MS analysis. Danzylhydrazine was the
first reagent to be used for N-linked glycan derivatization and tagging for Figure 1.8 Reductive Amination - Released glycans derivatized with 2-aminobenzamide (2-AB) is shown. 2-AB interacts with the free aldehyde available when the reducing sugar is in open-ring form, the condensation reaction produces a Schiff base (imine) which must be reduced to give a stable secondary amine.
enhanced UV and fluorescence detection.10 Hydrazone formation
derivatization of released glycans was first demonstrated as a viable strategy
for increasing MS detection by Harvey and coworkers; in 1996 they were
able to demonstrate that cationic Girard’s T reagent improved MS detection
using matrix-assisted laser desorption ionization (MALDI) and electrospray
ionization (ESI).9
1.2.4 Reversed Phase LC Separation and Electrospray
Ionization
Separation of intact glycan structures is far from optimal due to their
innate hydrophilicity, instability, structural and linkage heterogeneity, and
isomeric complexity. A number of separation techniques have been used to
purify, enrich, and separation isolated glycan structures, including normal
phase, reversed phase, anion-exchange, lectin affinity, gel filtration and solid
phase extraction.11-14 Reversed-phase (RP) chromatography is based on
hydrophobic interactions between analytes and the stationary phase of the
column. The stationary phase is typically a silica bonded octadecysilyl
(ODS), generally referred to as a C18 – packed column; the long alkyl chains
of the stationary packing make for a nonpolar, hydrophobic surface.
Electrospray Ionization (ESI) is a soft ionization mechanism, meaning
it efficiently produces intact gas-phase ions from nonvolatile analytes and
macromolecules in solution without excessive fragmenting.15 John Fenn
and coworkers conduct numerous studies in an attempt to understand the
mechanisms responsible for producing single and multiply charged ions.
Dole in 196821,22 and the ion-evaporation mechanism (IEM) was proposed by
Iribarne and Thomson in 1976.23,24
The ESI mechanism begins by pumping analyte-containing solution
through a stainless steel capillary, to which a voltage is applied. As the
charged solution begins to exit the capillary, into the ambient environment,
the solution containing analyte and excess charge form a “Taylor Cone,”
until the repulsions due to surface charge surpasses the surface tension of
the electrified liquid, also known as the Rayleigh limit.15,20 Charged droplets
leave the emitter tip and migrate into the heated capillary inlet of the mass
spectrometer, aided by electrostatic attraction and vacuum.20-24
In 1993, Fenn discusses chemical and physical properties responsible
for ion formation type and abundance corresponding to the MS ion current.
The proposed correlation of analyte surface area, ion abundance, and MS
response catalyzed interest in fundamental understanding and application
of electrospray ionization the hydrophobic bias/effect of electrospray
ionization (Figure 1.10). Integration of nanoscale liquid chromatography (nLC), nano flow rate electrospray ionization (nanoESI), and high resolving
power mass spectrometry (MS) instrumentation has provided high-efficiency
1.2.5 Fourier Transform Mass Spectrometry
Mass spectrometry (MS) has developed into one of the most sought
after analytical techniques for qualitative and quantitative analysis. Mass
spectrometry is built upon numerous fundamental principles from physical,
chemical, and mathematical sciences. Most MS platforms today rely heavily
on automation and built-in algorithms in order to produce high quality data
in real time. All mass analyzers measure mass-to-charge ratios (m/z), it is
the mechanism by which they detect that makes each instrument unique in
its capabilities and applicability.
Fourier transform mass spectrometry (FTMS) based on the principle
of ion cyclotron resonance (ICR) of gas-phased ions trapped in the presence
of magnetic and electric fields under ultra-high vacuum. Ions of the same
m/z will begin to oscillate in a cyclotron motion initiated by two excitation plates. Another pair of plates, detector plates, generates an image current
in time space (time domain) which is then Fourier transformed into a mass
spectrum (in frequency domain). The application of Fourier transform
algorithm to a single time domain transient generates frequency spectrums,
where each corresponds to a specific m/z ion species.25-27 In other words,
multiplex detection and relative quantification by the signal intensities
generated.
The Orbitrap instrument, notable for its compact and elegant design,
is the fastest of the high-resolving power mass analyzers commercially
available. The Orbitrap mass spectrometry analyzer combines desired
features of FT-ICR and TOF mass analyzers without costly maintenance of
a superconducting magnet, space charge limits, or limited dynamic range.
Orbital trapping was first used by Kingdon in 1923 by imprisoning
positively charged ions etween a cylindrical anode and axial cathode
filament.25,26 Similar to other FT-MS platforms, such as the FT-ICR mass
spectrometers, orbitraps generate an image current for each packet of ions
injected, however the ion trapping mechanism is electrostatic instead of
magnetic. As the ion packet enters the orbitrap, the charged species will
separate base mass-to-charge (m/z) as they oscillate about the axial cathode
in a harmonic motion. Modern Orbitrap instruments, such as the
Q-Exactive (Thermo Scientific) contains only one mass analyzer for all
measurements; this is a result of increased speed, enhanced dynamic range
(built-in “excitation-by-injection” mechanism), large space charge capacity
1.3 Summary
Mass spectrometry detection combined with various front-end
separation techniques has become essential for confident identification of
intact glycan structures derived from complex biological sources (cells,
tissues, plasma). However, compared to proteomics LC-MS platforms,
glycomics workflows are far from optimal. Challenges arise at all levels, from
dynamic range and heterogeneity of the glycosylated proteins from whence
they came. Mass spectrometry-based glycomics is rapidly improving as
investigators begin to recognize the overwhelming potential glycan analysis
can have in terms of cultivating biomarker discovery research.
Although it may seem that direct analytical measurements of glycans
are limited in terms of the biological relevant information there are practical
aspects to using high resolving power instrumentation for the analysis of
released N-glycans. First, glycomics profiling techniques are generally fast,
efficient, and adaptable to multiplexing. Second, even at inherently low
abundances, the dynamic range of N-glycans will be smaller than the
dynamic range for protein level analysis. Third, the list of all possible
N-glycan compositions can be easily calculated, albeit putative, theoretical
masses can be used to extract corresponding mass-to-charge ratios (m/z)
from mass spectral data.
Chapter 2 will describe the INLGHT workflow, developed specification
for high-throughput glycomics analysis using high resolving power LC-MS
instrumentation. Chapter 3 presents the application of the INLIGHT relative
quantification strategy for comparative glycome profiling of longitudinal
glycosylation and cancer are interrelated provokes glycomics potential to
improve bio-marker discovery research.
Glycan Sample Preparation
Separation by Liquid Chromatography
Electrospray Ionization
Mass Spectrometry
Analysis
General Glycomics Workflow
Online nLC ESI-MS
N-linked
Glycans Plasma
Glycoproteins
m/z
N H2 NH
O
SIL N
H2 NH O
NAT
Stable-Isotope Derivatization
1.4 References
1. Zaia, J., Mass spectrometry and the emerging field of glycomics. Chem Biol 2008, 15 (9), 881-92.
2. Walker, S. H.; Muddiman, D. C., Nano-flow Liquid Chromatography Mass Spectrometric Analysis of Glycans in Cancer. In Nanomedicine and Cancer, Preedy, V. R., Ed. Science Publishers: Boca Raton, FL, 2011.
3. Bertozzi, C. R.; Rabuka, D., Chapter 2. Structural Basis for Glycan Diversity. In Essentials of Glycobiology, 2 ed.; Varki, A.; Cummings, R. D.; Esko, J. D.; Freeze, H. H.; Stanley, P.; Bertozzi, C. R.; Hart, G. W.; Etzler, M. E., Eds. Cold Spring Harbor Laboratory Press: New York, 2009.
4. Varki, A.; Freeze, H. H.; Gagneux, P., Chapter 19. Evolution of Glycan Diversity. In Essentials of Glycobiology, 2 ed.; Varki, A.; Cummings, R. D.; Esko, J. D.; Freeze, H. H.; Stanley, P.; Bertozzi, C. R.; Hart, G. W.; Etzler, M. E., Eds. Cold Spring Harbor Laboratory Press: New York, 2009.
5. Tarentino, A. L.; Gomez, C. M.; Plummer, T. H., Deglycosylation of Asparagine-Linked Glycans by Peptide - N-Glycosidase-F. Biochemistry 1985, 24 (17), 4665-4671.
6. Plummer, T. H.; Elder, J. H.; Alexander, S.; Phelan, A. W.; Tarentino, A. L., Demonstration of Peptide-N-Glycosidase-F Activity in Endo-Beta-N-Acetylglucosaminidase F Preparations. Journal of Biological Chemistry 1984, 259 (17), 700-704.
8. Kang, P.; Mechref, Y.; Novotny, M. V., High-throughput solid-phase permethylation of glycans prior to mass spectrometry. Rapid Commun Mass Spectrom 2008, 22 (5), 721-34.
9. Naven, T. J. P.; Harvey, D. J., Cationic derivatization of oligosaccharides with Girard's T reagent for improved performance in matrix-assisted laser desorption/ionization and electrospray mass spectrometry. Rapid Commun. Mass Spectrom. 1996, 10 (7), 829-834.
10. Avigad, G., Dansyl Hydrazine as a Fluorimetric Reagent for Thin-Layer Chromatographic Analysis of Reducing Sugars. J. Chromatogr. 1977, 139 (2), 343-347.
11. Bowman, M. J.; Zaia, J., Comparative Glycomics Using a Tetraplex Stable-Isotope Coded Tag. Anal Chem 2010, 82 (7), 3023-3031.
12. Saba, J. A.; Shen, X. D.; Jamieson, J. C.; Perreault, H., Investigation of different combinations of derivatization, separation methods and electrospray ionization mass spectrometry for standard oligosaccharides and glycans from ovalbumin. J. Mass Spectrom. 2001, 36 (5), 563-574.
13. Walker, S. H.; Muddiman, D. C., Nano-flow Liquid Chromatography Mass Spectrometric Analysis of Glycans in Cancer. In Nanomedicine and Cancer, Preedy, V. R., Ed. Science Publishers: Boca Raton, FL, 2011.
14. Hounsell, E. F., HPLC of Small Molecules. IRL Press: Oxford, 1986.
16. Fenn, J. B.; Mann, M.; Meng, C. K.; Wong, S. F.; Whitehouse, C. M., Electrospray ionization for mass spectrometry of large biomolecules. Science 1989, 246 (4926), 64-71.
17. Fenn, J. B.; Mann, M.; Meng, C. K.; Wong, S. F.; Whitehouse, C. M., Electrospray ionization-principles and practice. Mass Spectrom. Rev. 1990, 9 (Copyright (C) 2013 American Chemical Society (ACS). All Rights Reserved.), 37-70.
18. Yamashita, M.; Fenn, J. B., Electrospray Ion-Source - Another Variation on the Free-Jet Theme. J Phys Chem-Us 1984, 88 (20), 4451-4459.
19. Yamashita, M.; Fenn, J. B., Application of electrospray mass spectrometry in medicine and biochemistry. Iyo Masu Kenkyukai Koenshu 1984, 9, 203-206.
20. Fenn, J. B., Ion formation from charged droplets: Roles of geometry, energy, and time. J Am Soc Mass Spectrom 1993, 4 (7), 524. 21. Dole, M.; Mack, L. L.; Hines, R. L., Molecular Beams of
Macroions. Journal of Chemical Physics 1968, 49 (5), 2240.
22. Dole, M.; Mack, L. L.; Hines, R. L., Ferguson, L. D., Alice, M. B., Gas phase macroions. Macromolecules 1968, 1, 96-97.
23. Iribarne, J. V.; Thomson, B. A., Evaporation of Small Ions from Charged Droplets. Journal of Chemical Physics 1976, 64 (6), 2287-2294.
25. Kingdon, K. H., A method for the neutralization of electron space charge by positive ionization at very low gas pressures. Phys Rev 1923, 21 (4), 408-418.
26. Amster, I. J., Fourier transform mass spectrometry. Journal of Mass Spectrometry 1996, 31 (12), 1325-1337.
27. Hernandez, F.; Sancho, J. V.; Ibanez, M.; Abad, E.; Portoles, T.; Mattioli, L., Current use of high-resolution mass spectrometry in the environmental sciences. Analytical and bioanalytical chemistry 2012, 403 (5), 1251-1264.
28. Mann, M.; Meng, C. K.; Fenn, J. B., Interpreting mass spectra of multiply charged ions. Anal. Chem. 1989, 61 (Copyright (C) 2013 American Chemical Society (ACS). All Rights Reserved.), 1702-8.
29. Dienes, T.; Pastor, S. J.; Schurch, S.; Scott, J. R.; Yao, J.; Cui, S. L.; Wilkins, C. L., Fourier transform mass spectrometry - Advancing years (1992 mid 1996). Mass spectrometry reviews 1996, 15 (3), 163-211.
CHAPTER 2. Individuality Normalization when
Labeling with Isotopic Glycan Hydrazide Tags
(INLIGHT): Relative Quantification of
N-
Glycans
2.1 Background
Individuality Normalization when Labeling with Isotopic Glycan
Hydrazide Tags (INLIGHT), is a relative quantification strategy for
N-glycomics analysis via LC-MS. INLIGHT has proven successful for relative
quantification of simple linear oligosaccharide mixtures (e.g.,
Maltoheptaose, Maltodextrin), N-glycans isolated from glycoproteins (e.g.,
RNAse B, Fetuin), and complex biological matrices (e.g., plasma). The
INLIGHT strategy is unique in that it describes: sample preparation
methodology, reversed-phase LC-MS data acquisition, and bioinformatics
pipeline for relative quantification of N-linked glycans.1 Incorporating a fixed
mass shift of 6 Daltons via stable-isotope labelled (SIL) reagents has afforded
reproducible datasets and confident glycan identification by exact mass
determinations (< 5ppm).1-3 Combining two differently labelled glycome
samples just prior to LC-MS analysis produces identifiable ‘glycan pairs’ in
the mass spectrum of co-eluting light and heavy labelled N-linked glycans.
Mass spectrometry (MS) detection combined with various front-end
plasma.4-6 However, compared to MS-based proteomics, glycomics
workflows are far from optimal, both biologically and analytically.
Challenges arise at all levels, from variability in physiochemical properties
for individual glycans to the large dynamic range and heterogeneity of the
glycosylated proteins from whence they came. MS-based glycomics is
rapidly improving as investigators begin to recognize the overwhelming
potential glycan analysis can have in cultivating biomarker discovery
research. Although it may seem that direct analytical measurements of
glycans are limited in terms of the biologically relevant information, there
are practical aspects to using high resolving power instrumentation for the
analysis of released N-glycans. Glycomics profiling techniques are generally
fast, efficient, and adaptable to multiplexing. Even at inherently low
abundances, the dynamic range of N-glycans will be smaller than the
dynamic range needed for proteomics analysis.
2.2 Materials and Method
2.2.1 Materials
Peptide: N-glycosidase F (PNGase F-Glycerol Free, 75,000 U) was
purchased from New England BioLabs (Ipswitch, MA). Solid Phase
Extraction (SPE) graphitized carbograph columns (Part Number 210101)
Maltoheptaose (Hex7), ammonium bicarbonate (ABC), dithiothreitol (DTT-
1M aqueous solution), formic acid (FA), trifluoroacetic acid (TFA), ethanol
(200 proof- HPLC grade), and acetic acid (50% for HPLC) were purchased
from Sigma-Aldrich (St. Louis, MO). HPLC-grade acetonitrile, methanol,
and water were purchased from Honeywell Burdick & Jackson (Muskegon,
MI) and are used throughout.
2.2.2
N-
glycome Extraction
N-linked glycomes were isolated from human plasma samples following the INLIGH protocol. Briefly, 50 µL of human plasma was heat
denatured for 2 minutes in the presence of 10 mM DTT and 100 mM
ammonium bicarbonate. Heat denaturation was performed by cycling
samples, in 15 second intervals, between water bath environments set to
100°C and 25°C. Denatured plasma glycoproteins were subjected to PNGase
F (15.3 IUB mU) digestion at 37°C overnight in 200 µL total digest volume.
Enzymatic cleavage of asparagine-linked glycans was quenched by adding
800 µL of chilled ethanol followed immediately by a 1 hour incubation at
80°C. The ethanol precipitation mixture was centrifuged at 13,200 rpm at
-9°C, for 30 min. The supernatant containing released glycans was removed
grade water and further purified by SPE columns containing 300mg
graphitized carbon5 Purified N-glycome samples are evaporated to dryness
using a vacuum concentrator set to 45°C and stored at -20°C until further
use.
2.2.3
N-
Glycan Derivatization
Individuality Normalization when Labeling with Isotopic Glycan
Hydrazide Tags (INLIGHT), refers to the relative quantification workflow
designed for LC-MS-based glycomics applications.4 Glycan derivatization
was accomplished by incubating purified N-glycome samples at 56°C for 3
hours with 200 µL INLIGHT tagging solution.1a INLIGHT tagging reagents
were synthesized as 2-(4-phenethylphenyl)-acetohydrazide in the natural
(NAT) and stable-isotope 12C6 labeled (SIL) form.1-5 One mg of tagging
reagent was prepared in 1 mL reaction buffer (75%/25% methanol: acetic
acid); immediately after incubation, the mixture was vacuum concentrated
to dryness at 55°C. Just prior to LC-MS analysis, INLIGHT-tagged glycome
samples were re-suspended in 200 µL HPLC-grade water containing 5%
acetonitrile and centrifuged for 5 minutes at 14,000 × g. The
glycan-containing supernatant was removed from the pellet glycan-containing unreacted
reagent; NAT and SIL labelled glycomes were combined 1:1 (v/v) to a final
2.2.4 LC-MS Data Acquisition
Each INLIGHT sample pair was analyzed in triplicate by liquid
chromatography-mass spectrometry (LC-MS). Ten µL of sample was
subjected to reversed-phase separation using an EASY-nLC II system
(Thermo Fisher Scientific, San Jose, CA) featuring an enclosed autosampler
tray (set to 4°C) for sample pickup and loading onto a 20 µL sample loop,
and from the sample loop to the cHiPLC-Nanoflex system (Eksigent, Dublin,
CA) set-up in dual-analytical mode. The dimensions of the two cHiPLC
analytical columns were 75 µm inner diameter and 15 cm in length, both
pre-packed with ChromXP C18-CL stationary phase (3 µm, 120 Å) by the
manufacturer. Operating in dual-analytical mode provided a total column
length of 30 cm for reversed-phase separation of hydrophobic, hydrazide
labelled N-glycans.5 Mobile phases A and B were prepared as 98% water/2%
acetonitrile/0.2% formic acid, and 2% water/98% acetonitrile/0.2% formic
acid, respectively. Samples were loaded onto the cHiPLC system at 2 µL/min
with mobile phase A and separated via gradient elution profile at a flow rate
of 275 nL/min. Gradient Elution was initiated at 2% B for 1 min followed
by a 1 min ramp to 22%B, then from 22-35% B over 20 min then 1 min
The cHiPLC system is coupled directly to the nanoESI source;
derivatized glycans were ionized in the gas-phase by applying 2.25 kV to the
zero-dead-volume union tee that joins the LC eluent capillary to a 10 µm
PicoTip (New Objective, Woburn, MA), and directed into the heated capillary
inlet (set to 225°C) of a Q-Exactive mass spectrometer (Thermo Fisher
Scientific, San Jose, CA). Tagged-glycans were detected in data dependent
acquisition (DDA) mode for the top 5 precursor ions per full scan (700-1800
m/z range); selected precursor ions were subjected to fragmentation by
higher energy collision dissociation (HCD) and placed on an exclusion list
for 25 seconds. Precursor ions are sent to the Orbitrap for detection and
mass spectral data acquisition at a resolving power of 70,000 (FWHM at m/z
=200); automatic gain control (AGC) set to 1 × 10⁶ for a maximum ion
injection time of 250 ms. The HCD cell was set to fragment precursor ions
at a normalized collision energy (NCE) of 20, whereby product ions were
generated and sent to the Orbitrap for detection at a resolving power of
17,500 (FWHM at m/z=200); AGC set to 2 ×10⁴ for a maximum ion injection
2.3 Results and Discussion
The multi-functional hydrophobic, hydrazide reagents included in the
INLIGHT approach are shown in Figure 2.1. These tagging reagents provide three main advantages: First, the chemistry used to couple the hydrophobic
tags with cleaved N-linked glycans is hydrazone formation (Figure 2.2), which provides efficient derivatization without requiring addition (and
post-labelling removal) of salts (as required in reductive amination techniques).
Second, the hydrophobic extension region dramatically improves response
in electrospray ionization and allows the use of reversed-phase
chromatography. Third, the ability to produce a version with a
stable-isotope label (13C6) enables relative quantification of cleaved N-linked
glycans. These were key determinants during the reagent development
2-(4-phenethylphenyl)acetohydrazide
N H2 N H O Hydrophobic Extension Region Reactive Hydrazide Group Stable-Isotope Incorporation (13C6)
Figure 2.1 INLIGHT Tagging Reagent - Hydrophobic, hydrazide derivatization reagent: 2-(4-phenethylphenyl)-acetohydrazide. INLIGHT™ N-glycan tagging kit (GTK-1000), including both natural (12C) and stable isotope-labeled (13C6) reagents are made available by Cambridge Isotope Laboratories Inc. (Tewksburg, MA).
Figure 2.2 Hydrazone Formation Reaction - INLIGHT derivatization of PNGase F released N-glycans with tagging reagents via hydrazone formation. A hydrazone is formed at the carbonyl reactant functional group (aldehyde/ketone) with reactive hydrazide in acidified organic solution incubated at 56°C for 3 hours.
Hydrazone Formation Reducing Terminus O OH O O H NH OH O O OH OH O O H NH O
Δ, H+ MeOH O OH O O H NH O NN H O H N H N
The INLIGHT N-glycan preparation protocol is shown in Figure 2.3; starting with two samples for comparative analysis); these could be a
complex biological matrix such as plasma, or biologic samples (protein
therapeutic) being characterized and/or compared to a biosimilar during
production and quality control. The first step is to release the N-linked
glycans from the glycoproteins using the enzyme PNGase F with subsequent
purification of the released glycome by solid-phase extraction (SPE). The
next step is to react the N-linked glycans with the hydrazide reagent (light or
heavy form) via hydrazone formation. The two derivatized N-glycome
I
ndividuality
N
ormalization when
L
abeling with
I
sotopic
G
lycan
H
ydrazide
T
ags
INLIGHT™ Workflow Includes:
• N-Linked glycan release and purification
• Incorporation of natural or stable-isotope hydrazide reagents • Reversed phase nLC-ESI-MS data acquisition
• Generating extracted ion chromatograms (Light and Heavy) • Peak area integration (Light and Heavy)
• Isotopic overlap correction (perN-glycan)
• Total glycan abundance normalization (per data acquisition)
Sample 1
Sample 2
PNGase F
Glycan Cleavage Solid PhaseExtraction DerivatizationN-Glycan Data AcquisitionLC/MS
Thermo Scientific’s LCMS software program (Xcalibur 2.2 SP1.48) was
used to process centroid data acquired by the Q-Exactive mass
spectrometer. A processing method was developed for peak integration of
both light and heavy- labelled glycans based upon their calculated exact
masses (mass tolerance of ±5 ppm). An in-house N-glycan database provided
a foundation for building the component list in Xcalibur; the component list
is essentially a library of m/z values to be extracted from the LC-MS data
file. The list of INLIGHT derivatized N-glycans and their m/z values are
shown in Appendix C- Table C.1. Processing results were manually curated to confirm the following: 1) the specified ions were accurately extracted, 2)
INLIGHT glycan pairs co-elute, and 3) resulting peak areas were exclusive
(containing only the ion of interest).
The glycan abundance ratio (Peak Area Light: Peak Area Heavy)
represents the INLIGHT response variable in its ‘rawest’ form. Combining
two differently labeled glycome samples just prior to LC-MS analysis
produced identifiable ‘glycan pairs’ in the mass spectrum that correspond to
co-eluting Light- and Heavy- labeled N-linked glycans in the extracted ion
2(4-phenethylphenyl)acetohydrazide
*Synthesized with either 12C
6or 13C6
nano-flow LC-ESI-MS V
25 26 27 28 29 30 31 32 33 34 35 Retention Time (min)
* Theoretical Isotopic Distribution
Hex6HexNAc5NeuAc3
m/z3+ = 1039.38797
XIC (±5 ppm)
25 26 Correction Factor 𝐴+6𝐿𝑖𝑔ℎ𝑡 𝐴𝐿𝑖𝑔ℎ𝑡 = 3.90 68.27= 0.057 [H:L]corr= 0.699
[H:L]norm = 0.904
Total Glycan Normalization Factor
𝑇𝐺𝑁𝐹 =∑ 𝑃𝑒𝑎𝑘 𝐴𝑟𝑒𝑎𝐻𝑒𝑎𝑣𝑦 ∑ 𝑃𝑒𝑎𝑘 𝐴𝑟𝑒𝑎𝐿𝑖𝑔ℎ𝑡= 0.773 [H:L]raw = 0.763
Peak Area Ratio Rel. Abundance =HeavyLight
RT (min)
m/z3+ = 1041.39468
L
H
Each pair of INLIGHT labeled glycans detected, [M+nH+]n+, are subject
to isotope overlap bias between the A+6 isotope of the Light-Glycan and the
A isotope (i.e., monoisotopic peak) of the Heavy-Glycan (Equation 1). Therefore, raw data (i.e., extracted peak areas) is subjected to an ‘isotopic
overlap correction’ to account for any bias in relative peak area. 1b, 1d, 1e, 2b,
2f-h, 2j, 2k, 7 Theoretical isotopic distributions are used to derive a glycan-specific ‘overlap factor’ based on a glycan’s relative isotope abundance. The overlap
factor is applied to the heavy peak area using Equation 2.
Relative glycan abundance can then be calculated using Equation 3. INLIGHT workflow suggests that each glycan peak area ratios be normalized
to the total glycan abundance detected during LC-MS data acquisition. The
Total Glycan Normalization Factor (TGNF), shown as Equation 4, is an efficient approach to normalize individual glycan ratios to the sum of glycan
ratios detected in a single LC-MS run.1d The resulting peak area ratio, after
isotope correction and normalization is the response variable that allows one
to relative quantify the difference/change in glycan abundance, between
6 Light Light A OverlapFactor A + =
[
M nH
+
+ +]
nHeavyCorrected=
[
M nH
+
+ +]
nHeavy−
[
OverlapFactor
×
[
M nH
+
+ +]
nLight]
∑
∑
∑
[ ] : [ ] n HeavyCorrected n Light M nHAbundanceRatio H L
M nH + + + + + = = +
∑
∑
n Heavy i n Light i Area TGNF Area =∑
∑
2.4 Summary
The labeling of N-linked glycans using these novel hydrazide reagents
allows for efficient comparative analysis of two samples. The tags afford
many benefits. The coupling of the hydrazide tag with N-linked glycans
cleaved from proteins via hydrazone formation has been optimized with a
reaction efficiency of >98%.1a In addition, derivatized glycome samples are
analyzed, without rigorous post-derivatization purification, minimizing
sample loss and time from derivatization reaction to LC-MS analysis. As a
result of increased hydrophobicity, an increase in glycan abundance is
observed which allows detection of lower abundant glycans.1a, 6b Moreover, Equation 2.1
Equation 2.2
Equation 2.3
separation efficiency. Note that the versatility of the method allows use of
either HILIC or reversed-phase HPLC in an online LC MS platform.1c
The incorporation of a stable isotope label allows for relative
quantification of N-linked glycomes derived from two different samples.1b
Derivatized glycan samples are processed in parallel, mixed and analyzed
together eliminating instrument and ESI variability. Collectively, the
INLIGHT N-glycan tagging reagents and comprehensive relative
quantification strategy described in this chapter, are an efficient and
2.5 References
1. Walker, S. H.; Lilley, L. M.; Enamorado, M. F.; Comins, D. L.; Muddiman, D. C., Hydrophobic derivatization of N-linked glycans for increased ion abundance in electrospray ionization mass spectrometry. J Am Soc Mass Spectrom 2011, 22 (8), 1309-17.
2. Walker, S. H.; Budhathoki-Uprety, J.; Novak, B. M.; Muddiman, D. C., Stable-Isotope Labeled Hydrophobic Hydrazide Reagents for the Relative Quantification of N-Linked Glycans by Electrospray Ionization Mass Spectrometry. Anal Chem 2011, 83 (17), 6738-6745.
3. Walker, S. H.; Carlisle, B. C.; Muddiman, D. C., Systematic comparison of reverse phase and hydrophilic interaction liquid chromatography platforms for the analysis of N-linked glycans. Anal Chem 2012, 84 (19), 8198-206.
4. Walker, S. H.; Taylor, A. D.; Muddiman, D. C., Individuality Normalization when Labeling with Isotopic Glycan Hydrazide Tags (INLIGHT): a novel glycan-relative quantification strategy. J Am Soc Mass Spectrom 2013, 24 (9), 1376-84.
5. Walker, S. H.; Taylor, A. D.; Muddiman, D. C., The use of a xylosylated plant glycoprotein as an internal standard accounting for N-linked glycan cleavage and sample preparation variability. Rapid Commun Mass Spectrom 2013, 27 (12), 1354-8.
6. Barnidge, D. R.; Hall, G. D.; Stocker, J. L.; Muddiman, D. C., Evaluation of a cleavable stable isotope labeled synthetic peptide for absolute protein quantification using LC-MS/MS. Journal of proteome research 2004, 3 (3), 658-661.
7. Johnson, K. L.; Muddiman, D. C., A method for calculating 16O/18O peptide ion ratios for the relative quantification of proteomes. J Am Soc Mass Spectrom 2004, 15 (4), 437-45.
9. Atwood, J.; Cheng, L.; Alvarez-Manilla, G.; Warren, N.; York, W.; Orlando, R., Quantitation by isobaric labeling: Applications to glycomics. Journal of proteome research 2008, 367-374.
10. Botelho, J. C.; Atwood, J. A.; Cheng, L.; Alvarez-Manilla, G.; York, W. S.; Orlando, R., Quantification by isobaric labeling (QUIBL) for the comparative glycomic study of O-linked glycans. International Journal of Mass Spectrometry 2008, 278 (2-3), 137-142.
11. Orlando, R.; Lim, J.; Atwood, J.; Angel, P.; Fang, M.; Aoki, K.; Alvarez-Manilla, G.; Moremen, K.; York, W.; Tiemeyer, M.; Pierce, M.; Dalton, S.; Wells, L., IDAWG: Metabolic Incorporation of Stable Isotope Labels for Quantitative Glycomics of Cultured Cells. Journal of variability. Rapid Commun Mass Spectrom 2013, 27 (12), 1354-8.
12. Gimenez, E.; Sanz-Nebot, V.; Rizzi, A., Relative quantitation of glycosylation variants by stable isotope labeling of enzymatically released N-glycans using [C-12]/[C-13] aniline and ZIC-HILIC-ESI-TOF-MS. Analytical and bioanalytical chemistry 2013, 405 (23), 7307-7319.
13. Atwood, J. A., 3rd; Cheng, L.; Alvarez-Manilla, G.; Warren, N. L.; York, W. S.; Orlando, R., Quantitation by isobaric labeling: applications to glycomics. J Proteome Res 2008, 7 (1), 367-74.
14. Packer, N. H.; von der Lieth, C. W.; Aoki-Kinoshita, K. F.; Lebrilla, C. B.; Paulson, J. C.; Raman, R.; Rudd, P.; Sasisekharan, R.; Taniguchi, N.; York, W. S., Frontiers in glycomics: Bioinformatics and biomarkers in disease - An NIH White Paper prepared from discussions by the focus groups at a workshop on the NIH campus, Bethesda MD (September 11-13,2006). Proteomics 2008, 8 (1), 8-20.
15. Dreyfuss, J. M.; Jacobs, C.; Gindin, Y.; Benson, G.; Staples, G. O.; Zaia, J., Targeted analysis of glycomics liquid chromatography/mass spectrometry data. Analytical and bioanalytical chemistry 2011, 399 (2), 727-735
17. Kato, K., [Structural biology of post-translational modifications of proteins]. Yakugaku Zasshi 2012, 132 (5), 563-73
18. Wuhrer, M., Glycomics using mass spectrometry. Glycoconj J 2013, 30 (1), 11-22; (o) Walker, S. H.; Muddiman, D. C., Nano-flow Liquid Chromatography Mass Spectrometric Analysis of Glycans in Cancer. In Nanomedicine and Cancer, Preedy, V. R., Ed. Science Publishers: Boca Raton, FL, 2011.
19. Yu, S. Y.; Wu, S. W.; Khoo, K. H., Distinctive characteristics of MALDI-Q/TOF and TOF/TOF tandem mass spectrometry for sequencing of permethylated complex type N-glycans. Glycoconjugate Journal 2006, 23 (5-6), 355-369
20. Miyamoto, S.; Leiserowitz, G. S.; Lebrilla, C. B., Human serum processing and analysis methods for rapid and reproducible N-glycan mass profiling. J Proteome Res 2010, 9 (10), 4952-9
21. Kang, P.; Madera, M.; Alley, W. R.; Goldman, R.; Mechref, Y.; Novotny, M. V., Glycomic alterations in the highly-abundant and lesser-abundant blood serum protein fractions for patients diagnosed with hepatocellular carcinoma. International Journal of Mass Spectrometry 2011, 305 (2-3), 185-198.
22. Tharmalingam, T.; Adamczyk, B.; Doherty, M. A.; Royle, L.; Rudd, P. M., Strategies for the profiling, characterisation and detailed structural analysis of N-linked oligosaccharides. Glycoconjugate Journal 2013, 30 (2), 137-146.
23. Packer, N. H.; Lawson, M. A.; Jardine, D. R.; Redmond, J. W., A general approach to desalting oligosaccharides released from glycoproteins. Glycoconj J 1998, 15 (8), 737-47
CHAPTER 3: Longitudinal
N
-Glycome Profiling of
Plasma for Elucidating Glycostasis in the Laying Hen
3.1 Introduction
The challenge of distinguishing healthy and diseased populations is
embraced through collaborative efforts to quantify biological change at the
molecular level. Part of the difficulty lies in the inappropriate establishment
of population-based reference intervals (RI). Since its introduction in 1969,
population-based RIs are routinely used in clinical laboratories for
determining whether a patient is “healthy” based on the 95% of “healthy”
individuals from which the RIs were established. Although these reference
values are derived from healthy populations, there is a lack of appreciation
for natural bio-chemical variability associated with each individual. Innate
variability within a single biological system is not a foreign concept; for
example, the post-translational modification, glycosylation, is known to be
involved in the regulatory affairs of a proteome, weakening our ability to
distinguish abnormal protein structure and function from the norm.
The hen model is unique among other animal models used to study
ovarian cancer because it not only spontaneously develops ovarian cancer,
domesticus) makes it the ideal candidate for MS-based biomarker discovery applications. The high incidence of ovarian tumors in the hen is first studied
in commercial laying hens and was correlated to their dramatic decline in
egg production following their first year of egg-laying.1,2 Fredrickson
showed that laying hens between the ages of 2 and 7, approximately 11-35%
of laying hens developed ovarian tumors.1
Availability, ease of care and ability to control numerous genetic and
environmental factors is imperative for characterization of ovarian cancer
and biomarker discovery research. A number of potential biomarkers found
in women with ovarian cancer have also been identified in the domestic
laying hen.3 Similar alterations have been identified at the gene and protein
3.2 Materials and Methods
3.2.1 Longitudinal Bio-Repository
275 domestic hens are carefully maintained by NCSU Poultry Science
staff personnel with expertise in management and health regulation of
commercial egg layer hen flocks. This interdisciplinary collaboration affords
opportunity not typically available to researchers who do not have the access
nor expertise requisite in acquiring such delicate biological samples for
research purposes. In addition to hen maintenance and bio-specimen
collection, the number of eggs produced by each hen is recorded daily. These
numbers are used to calculate egg production efficiencies to be used as a
rudimentary “health” metric of our hen subjects; it is calculated as follows:
Initial protocol development for establishing a comprehensive
bio-specimen repository focused on the longitudinal collection of plasma for a
sub-population of hens that would ultimately be used to define N-linked
glycostasis. The first five collections were done in month-long intervals for
24 randomly selected hens.
(%) EggsLaid 100
Efficiency
DaysOvulating
3.2.2 Biospecimen Collection
Pre-collection preparations include recruiting help, gathering supplies
and pre-labelling all syringes and vials to prevent cross-contamination or
loss of samples. Teams of two were organized to collect whole blood samples;
one person to careful remove the individually-caged hen and position it with
its wing extended up exposing the brachial vein. The collection of whole
blood was performed by trained and certified personnel, under NCSU IACUC
Protocol #08-076-B, drawing approximately 5 mL of whole blood from the
in an ice bath. It was established that whole blood be processed for
separation of plasma within one hour from collection. Under the conditions
specified: obtain approximately 3-5 mL of whole blood, blood is mixed well
to prevent coagulation, fresh blood stored on ice (chilled, not frozen), and
plasma isolated and frozen in dry ice within 1 hour.
Whole blood is processed by centrifugation at 3500 × g for 5 minutes
(4°C) and again placed on ice. Within 30 minutes of centrifugation, the
plasma (top layer) is carefully pipetted from the remaining lipid (middle) layer
and red blood cells (bottom layer) and transferred into a pre-labelled
cryovial. Approximately 1-2 mL of plasma can be obtained using this
method. Immediately upon transfer, cryovial containing plasma is capped
and stored frozen in a bed on dry ice until they can be placed in long-term
storage (cryogenic freezer set to -80°C).
Following glycostasis plasma collection, red blood cells of all 200+
hens was obtained using the same protocol just described. Red blood cells
containing genetic information for each individual was collected and stored
at -80°C, for genomic analysis possibilities in the future. Only one 1 mL
aliquot of red blood cells was attained for each hen and these collections
In order to apply our relative quantification strategies for tissue
glycomics, it is important to develop an efficient and reproducible protocol
for tissue harvesting, storage, and sample preparation. Although the
process of procuring samples seems trivial, it requires strategic planning
and collaboration to create bio-repositories for research and development
applications. At the end of the three year period, hen subjects will be
euthanized and necropsied. At the time of necropsy, harvested tissues will
be divided for histology examination (H&E staining) and MS-based glycomics
research (fresh frozen by liquid nitrogen). The long term goal here is to
obtain histological confirmation by a certified pathologist as to which hens
developed ovarian cancer and to what stage the cancer has progressed. In
addition, the availability of fresh frozen tissue samples will allow for future
Storage @ -80
°
C
June
July
Aug
Sept
Oct
30
60
90
75
45
15
Eg
g
Pr
od
uct
ion
E
ffi
ci
en
cy
(%
) 110
0
26
30
35
39
43
Age (weeks)
Plasma Collection 2012
24
24
23
23
22
Plasma
Repository
(1-2 ml)
Samples
Whole Blood (~5 mL)
5 min. Centrifugation; 3500 xg @ 4
°
C
US STD
Uterine
Prolapse Impacted
Oviduct