University of Windsor University of Windsor
Scholarship at UWindsor
Scholarship at UWindsor
Electronic Theses and Dissertations Theses, Dissertations, and Major Papers
2011
Development of Manufacturing Cells Using an Artificial Ant-Based
Development of Manufacturing Cells Using an Artificial Ant-Based
Algorithm with Different Similarity Coefficients
Algorithm with Different Similarity Coefficients
Mohammed Taboun University of Windsor
Follow this and additional works at: https://scholar.uwindsor.ca/etd
Recommended Citation Recommended Citation
Taboun, Mohammed, "Development of Manufacturing Cells Using an Artificial Ant-Based Algorithm with Different Similarity Coefficients" (2011). Electronic Theses and Dissertations. 159.
https://scholar.uwindsor.ca/etd/159
This online database contains the full-text of PhD dissertations and Masters’ theses of University of Windsor students from 1954 forward. These documents are made available for personal study and research purposes only, in accordance with the Canadian Copyright Act and the Creative Commons license—CC BY-NC-ND (Attribution, Non-Commercial, No Derivative Works). Under this license, works must always be attributed to the copyright holder (original author), cannot be used for any commercial purposes, and may not be altered. Any other use would require the permission of the copyright holder. Students may inquire about withdrawing their dissertation and/or thesis from this database. For additional inquiries, please contact the repository administrator via email
Development of Manufacturing Cells Using an Artificial Ant-Based with Different Similarity Coefficients
by
Mohammed Salem Taboun
A Thesis
Submitted to the Faculty of Graduate Studies through Industrial and Manufacturing Systems Engineering
in Partial Fulfillment of the Requirements for the Degree of Master of Applied Science at the
University of Windsor
Windsor, Ontario, Canada
2010
Development of Manufacturing Cells Using an Artificial Ant-Based Algorithm with Different Similarity Coefficients
by
Mohammed Salem Taboun
APPROVED BY:
______________________________________________ Dr. Kevin Li
Odette School of Business
______________________________________________ Dr. Guoqing Zhang
Department of Industrial and Manufacturing Systems Engineering
______________________________________________ Dr. Michael Wang, Advisor
Department of Industrial and Manufacturing Systems Engineering
______________________________________________ Dr. Ahmed Azab, Chair of Defense
Department of Industrial and Manufacturing Systems Engineering
iii DECLARATION OF ORIGINALITY
I hereby certify that I am the sole author of this thesis and that no part of this
thesis has been published or submitted for publication.
I certify that, to the best of my knowledge, my thesis does not infringe upon
anyone’s copyright nor violate any proprietary rights and that any ideas, techniques,
quotations, or any other material from the work of other people included in my thesis,
published or otherwise, are fully acknowledged in accordance with the standard
referencing practices. Furthermore, to the extent that I have included copyrighted
material that surpasses the bounds of fair dealing within the meaning of the Canada
Copyright Act, I certify that I have obtained a written permission from the copyright
owner(s) to include such material(s) in my thesis and have included copies of such
copyright clearances to my appendix.
I declare that this is a true copy of my thesis, including any final revisions, as
approved by my thesis committee and the Graduate Studies office, and that this thesis has
iv ABSTRACT
Although there exists several ways of solving the cellular manufacturing problem,
including several ant-based algorithms, many of these algorithms focus on obtaining the
best possible answer instead of efficiency and ease of programming. These existing
ant-based algorithms which use similarity coefficients do not compare the efficiency of using
different similarity coefficients within the algorithm either. An existing artificial-ant
based algorithm was modified so that it is easier to manipulate. This modification was
necessary to apply the algorithm to cellular manufacturing. The original algorithm,
AntClass uses Euclidean vectors to measure the similarity between parts, because
similarity is used to group parts together instead of distances, the modified version uses
similarity coefficients. The concept of heaping clusters was also introduced to ant
algorithms for cellular manufacturing. Instead of using Euclidean vectors to measure the
distance to the center of a heap, as is such in the AntClass algorithm, an average
similarity was introduced to measure the similarity between a part and a heap. The
algorithm was tested on five common similarity coefficients to determine the similarity
v TABLE OF CONTENTS
DECLARATION OF ORIGINALITY ... iii
ABSTRACT ... iv
LIST OF FIGURES ...x
LIST OF EQUATIONS ... xii
CHAPTER I. INTRODUCTION General Overview ...1
Objectives of the Research ...5
Organization of the Research ...5
II. REVIEW OF LITERATURE Classification and coding techniques...6
Array-Based Techniques ...7
Similarity Coefficient Methods ...9
Comparative Studies of Similarity Coefficients ...13
Graph Theoretic Techniques ...17
Mathematical Programming Techniques ...20
Artificial Intelligence Techniques ...26
Genetic Algorithms ...28
Simulated Annealing ...33
Swarm Intelligence ...35
Motivation of The Research ...38
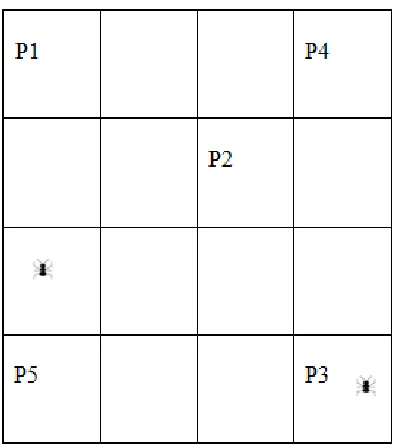
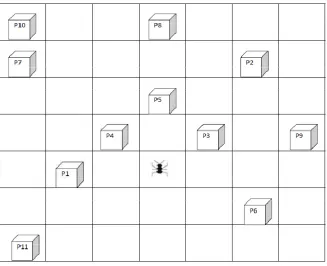
III. DESIGN AND METHODOLOGY The Environment: A Two Dimensional Chessboard ...40
vi
Phase 1: Creating Part Families ...43
Ant is unloaded: Picking up a Part ...43
Ant is Loaded: Dropping a Part ...45
Phase 2: Refining Part Families ...46
Phase 3: Combining Part Families ...47
Performing the ant algorithm ...48
Phase 4: Comparing Different Similarity Coefficients ...52
IV. ANALYSIS OF SAMPLE PROBLEMS Small Problem (Chow and Howaleshka, 1992) ...55
Small Problem: Jaccard Similarity Coefficient ...57
Small Problem: Russel and Rao’s Similarity Coefficient ...59
Small Problem: Simple Matching Similarity Coefficient ...61
Small Problem: Relative Matching Similarity Coefficient ...63
Small Problem: Baroni-Urbani and Buser Similarity Coefficient ...65
Refining the Part Families for a Small Example ...67
Medium Problem ...68
Medium Problem: Jaccard Similarity Coefficient ...69
Medium Problem: Russel and Rao’s Similarity Coefficient ...71
Medium Problem: Simple Matching Similarity Coefficient ...73
Medium Problem: Relative Matching Similarity Coefficent ...75
Medium Problem: Baroni-Urbani and Buser Similarity Coefficient ..77
Refining Part Families for Phase 2 ...79
Combining heaps into Part Families ...80
Large Problem ...82
Large Problem: Jaccard Similarity Coefficient ...82
Large Problem: Russel and Rao’s Similarity Coefficient ...83
vii
Large Problem: Relative Matching Similarity Coefficient ...85
Large Problem: Baroni-Urbani and Buser Matching Similarity Coefficient ...86
Refining the Part Families in the large example ...87
V. COMPARING THE RESULTS OF THE TESTS Results of the solution qualities yielded from different similarity coefficients ...88
Comparison of algorithm efficiency between different similarity coefficients ...92
VI. CONCLUSIONS AND RECOMMENDATIONS Concluding Remarks ...96
Recommendations for future research ...97
APPENDICES Layout Presentation and Similarity Coefficient Calculations ...100
Output for two dimensional chessboards ...100
Similarity Coefficient Calculations ...101
APPENDIX B: Data from Large Example ...102
Equations and Variables ...104
List of Equations ...104
List and definition of Variables ...106
Source Code ...108
REFERENCES ...119
viii LIST OF TABLES
TABLE 2.1LIST OF SIMILARITY COEFFICIENTS EXAMINED (MOSIER,1989) ... 13
TABLE 2.2SIMILARITY COEFFICIENTS COMPARED (YIN AND YASUDA,2006) ... 16
TABLE 4.1INITIAL MACHINE-PART MATRIX FOR THE SMALL EXAMPLE ... 55
TABLE 4.2MACHINE PART MATRIX FOR THE FIRST PHASE OF THE SMALL EXAMPLE USING
THE JACCARD SIMILARITY COEFFICIENT ... 57
TABLE 4.3MACHINE-PART MATRIX FOR PHASE 1 OF A SMALL EXAMPLE USING RUSSEL
AND RAO’S SIMILARITY COEFFICIENT ... 59
TABLE 4.4MACHINE-PART MATRIX FOR PHASE ONE OF A SMALL PROBLEM SOLVED USING
SIMPLE MATCHING SIMILARITY COEFFICIENT ... 61
TABLE 4.5MACHINE-PART MATRIX FOR PHASE ONE OF A SMALL PROBLEM SOLVED USING
RELATIVE MATCHING SIMILARITY COEFFICIENT ... 63
TABLE 4.6 MACHINE-PART MATRIX FOR PHASE ONE OF A SMALL PROBLEM SOLVED USING
BARONI-URBANI AND BUSER MATCHING SIMILARITY COEFFICIENT ... 65
TABLE 4.7MACHINE-PART MATRIX FOR THE SOLUTION TO THE SMALL EXAMPLE (END OF
PHASE 2) ... 67
TABLE 4.8INITIAL MEDIUM MACHINE PART MATRIX ... 68
TABLE 4.9PHASE 1 OF THE MEDIUM EXAMPLE SOLVED WITH THE JACCARD COEFFICIENT 69
TABLE 4.10PHASE 1 OF THE MEDIUM EXAMPLE SOLVED WITH THE R AND RSIMILARITY
COEFFICIENT ... 71
TABLE 4.11PHASE 1 OF THE MEDIUM EXAMPLE SOLVED WITH THE SIMPLE MATCHING
ix TABLE 4.12PHASE 1 OF THE MEDIUM EXAMPLE SOLVED WITH THE RELATIVE MATCHING
SIMILARITY COEFFICIENT ... 75
TABLE 4.13PHASE 1 OF THE MEDIUM EXAMPLE SOLVED WITH THE BARONI-URBANI AND BUSER SIMILARITY COEFFICIENT ... 77
TABLE 4.14MEDIUM PROBLEMS RESULT OF K-MEANS CLUSTERING:MACHINE-PART MATRIX ... 79
TABLE 4.15FINAL MACHINE PART MATRIX FOR THE MEDIUM SIZED EXAMPLE ... 80
TABLE A.1SIMILARITY COEFFICIENT CALCULATION AND STORAGE ... 101
TABLE B.1INITIAL MACHINE-PART MATRIX ... 102
x LIST OF FIGURES
FIGURE 3.1TWO DIMENSIONAL CHESSBOARD ... 41
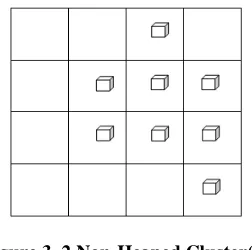
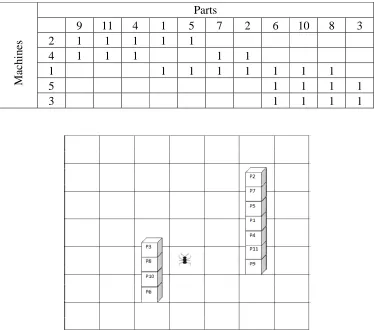
FIGURE 3.2NON-HEAPED CLUSTER(S)... 42
FIGURE 3.3TWO CLUSTERS OR DISTINCT HEAPS ... 42
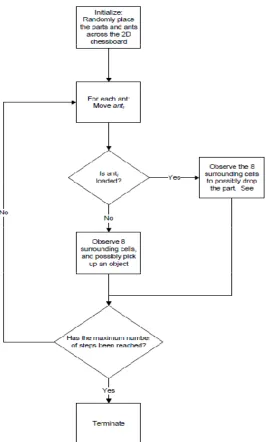
FIGURE 3.4CORE ARTIFICIAL ANT-BASED ALGORITHM ... 49
FIGURE 3.5ARTIFICIAL ANT THOUGHT PROCESS PICKING UP A PART ... 50
FIGURE 3.6ARTIFICIAL ANT LOGIC:DROPPING A PART ... 51
FIGURE 4.1INITIAL MACHINE-PART MATRIX FOR SMALL EXAMPLE ... 56
FIGURE 4.2LAYOUT OF THE 2-DIMENSIONAL CHESSBOARD FOLLOWING THE FIRST PHASE FOR THE SMALL EXAMPLE, USING THE JACCARD SIMILARITY COEFFICIENT ... 57
FIGURE 4.32-DCHESSBOARD’S LAYOUT FOR PHASE 1 OF THE SMALL EXAMPLE USING R AND RSIMILARITY COEFFICIENT ... 59
FIGURE 4.42-DCHESSBOARD’S LAYOUT FOR PHASE ONE OF A SMALL PROBLEM SOLVED USING SIMPLE MATCHING SIMILARITY COEFFICIENT ... 61
FIGURE 4.52-DCHESSBOARD’S LAYOUT FOR PHASE ONE OF A SMALL PROBLEM SOLVED USING RELATIVE MATCHING SIMILARITY COEFFICIENT ... 63
FIGURE 4.62-DCHESSBOARD’S LAYOUT FOR PHASE ONE OF A SMALL PROBLEM SOLVED USING RELATIVE MATCHING SIMILARITY COEFFICIENT ... 65
FIGURE 4.72-DCHESSBOARD FOR THE SOLUTION TO THE SMALL EXAMPLE (END OF PHASE 2) ... 67
xi FIGURE 4.9MEDIUM LAYOUT FOR PHASE 1 USING THE JACCARD SIMILARITY COEFFICIENT
... 69
FIGURE 4.10MEDIUM LAYOUT FOR PHASE 1 USING THE R AND RSIMILARITY COEFFICIENT ... 71
FIGURE 4.11MEDIUM LAYOUT FOR PHASE 1 USING THE SIMPLE MATCHING SIMILARITY COEFFICIENT ... 73
FIGURE 4.12LAYOUT FOR PHASE 1 USING THE RELATIVE MATCHING SIMILARITY COEFFICIENT ... 75
FIGURE 4.13LAYOUT FOR PHASE 1 USING THE BARONI-URBANI AND BUSER SIMILARITY COEFFICIENT ... 77
FIGURE 4.14MEDIUM PROBLEMS RESULT OF K-MEANS CLUSTERING:2-DCHESSBOARD 79 FIGURE 4.15FINAL LAYOUT OF THE MEDIUM SIZED PROBLEM ... 80
FIGURE 5.1SMALL SIZED EXAMPLE:GROUPING EFFICIENCY ... 88
FIGURE 5.2SMALL SIZED EXAMPLE:EXCEPTIONAL ELEMENTS... 89
FIGURE 5.3MEDIUM PROBLEM:GROUPING EFFICIENCY ... 89
FIGURE 5.4MEDIUM PROBLEM:EXCEPTIONAL ELEMENTS ... 90
FIGURE 5.5LARGE EXAMPLE:GROUPING EFFICIENCY ... 90
FIGURE 5.6LARGE EXAMPLE:EXCEPTIONAL ELEMENTS ... 91
FIGURE 5.7JACCARD SIMILARITY COEFFICIENT RUNNING TIME ... 93
FIGURE 5.8RUSSEL AND RAO'S SIMILARITY COEFFICIENT RUNNING TIME ... 93
FIGURE 5.9SIMPLE MATCHING SIMILARITY COEFFICIENT RUNNING TIME ... 94
FIGURE 5.10RELATIVE MATCHING SIMILARITY COEFFICIENT RUNNING TIME ... 94
xii LIST OF EQUATIONS
EQUATION 1CALCULATING THE SIZE OF THE 2 DIMENSIONAL CHESSBOARD ... 40
EQUATION 2CALCULATING THE NUMBER OF ARTIFICIAL ANTS ... 41
EQUATION 3:SIMILARITY DENSITY FUNCTION TO MEASURE THE SIMILARITY OF A PART PK WITH ITS SURROUNDINGS ... 44
EQUATION 4:PROBABILITY TRANSFER FUNCTION FOR AN ARTIFICIAL ANT TO PICK UP A PART ... 44
EQUATION 5:PROBABILITY TRANSFER FUNCTION FOR AN ARTIFICIAL ANT TO DROP A PART ... 45
EQUATION 6:AVERAGE SIMILARITY BETWEEN A PART AND A HEAP ... 46
EQUATION 7:JACCARD SIMILARITY COEFFICIENT ... 52
EQUATION 8:RUSSEL AND RAO’S SIMILARITY COEFFICIENT ... 52
EQUATION 9:SIMPLE MATCHING COEFFICIENT ... 52
EQUATION 10:RELATIVE MATCHING COEFFICIENT ... 52
EQUATION 11:BARONI-URBANI AND BUSER SIMILARITY COEFFICIENT ... 52
EQUATION 12:GROUPING EFFICIENCY FOR A MACHINE-PART MATRIX ... 54
EQUATION 13:LEFT SIDE PARTIAL GROUPING EFFICIENCY ... 54
1 CHAPTER I
INTRODUCTION
General Overview
Globalization and the development of global markets and technology are
progressively accelerated forcing companies in today’s competitive environment to
change dramatically to satisfy the urgency and variability of consumer tastes and
demands. To cope with this trend, companies must develop/adopt novel approaches and
practical strategies to deal with various production parameters such quantity (smaller
batches), variety (larger diversity) and so on to optimize their production systems. Batch
production is one of the strategies that can be used to meet customer demand of lower
volume and small batches; however, this strategy cannot be easily adopted in the efficient
serial production lines.
On the other hand, low volume/high-variety manufacturing parts can be produced
in batches using the flexibility of functionally arranged machines with the additional
expense of some inefficiency. Batch production accounts for 50 – 75 % of world
manufacturing systems (Zhao and Wu 2000). The inefficiency stemming from the
inherent functionally arranged production systems include high set-up/operation time
ratios, excessive non-value added material handling activities, greater work in process,
long lead times, waiting periods and throughput, which leads to lower manufacturing
productivity. To overcome productivity and inefficiency concerns, the concept of
manufacturing cells has been considered as an acceptable solution that compromises
2 Cellular Manufacturing Systems (CMS) is considered as an application of Group
Technology (GT) concept to factory reconfiguration and shop floor layout design (Irani et
al. 1999). Although both terms CMS and GT are occasionally used interchangeably, GT
is an area of study devoted to parts clustering and machine cells formation and considered
as the starting point of cell design. Furthermore, Da Silveira (1999) puts the grouping
process of parts and machines in a central position of CMS implementation techniques.
The grouping process of classifying similar parts facilitates both design and
manufacturing; where part shape similarity is helpful in design but process similarity is
important in the arrangement of machines and manufacturing g facilities.
In most cases, parts with similar shapes share the same process requirements such
as rotational parts and prismatic parts. However, some parts with dissimilar shape may
share the same set of machining requirements to produce them and vice versa. Burbridge
(1992) indicated that routing information alone is sufficient to design manufacturing cell.
The relationship between parts and their process requirements in terms of machines are
arranged in a 0/1 binary structured format of two-dimensional matrix, known as
part-machine incidence matrix. Most of the grouping and clustering approaches use this data
structure as a starting point to form part families and machine cells.
During the past few decades many approaches have been proposed for solving
part families and machine cells formation that can be classified into several techniques;
(1) classification and coding techniques; (2) array-based techniques; (3) similarity
coefficient techniques; (4) graph theoretic techniques; (5) mathematical programming
3 Classification and coding techniques ranges from basic visual classification of
part geometry to sophisticated computer coding techniques. Array-based technique
makes use of the binary information to form part families and machine cells
simultaneously by sorting both the rows and columns of part-machine incident matrix
alternatively to form cluster blocks around the matrix diagonal (King 1980). Similarity
coefficient techniques in GT is pioneered by Mc Auley (1972), which makes use of a
similarity index to determine the similarity coefficients either between parts or machines
then use this information in a clustering algorithm to form part families and machine
cells.
Graph theoretic technique makes use of the part-machine incident matrix to
develop a graph whose vertices correspond to the machines and whose edges represents
the relationship created machines and parts using them. Rajagopalan and Batra used this
technique to partition the machine-machine graph into a number of sub-graphs by
removing edges with weak relationships to form machine cells and allocating parts to part
families.
In mathematical programming techniques a number of part families/machine cells
formation models have been developed using integer programming, mixed integer
programming and goal programming. Kusiak (1987) formulated the machine cell
formation problem into a 0/1 integer programming model with the objective of
maximizing the sum of similarities while considering different system constraints.
Although, different design objectives and system constraints can be incorporated into a
4 artificial intelligence (AI) techniques are widely used to solve this problem in a
reasonable time.
Finally, a number of artificial intelligence techniques have been used to solve part
families and machine cells formation during the past two decades. Some of these
techniques include artificial neural networks, genetic algorithms and knowledge-base
systems. Chow and Hawaleshka (1993) used knowledge-based systems to form machine
cells. Moon (1990), Chu (1993), Kaparthi et al. (1993), and Venugopal and Narendran
(1994) employed artificial neural net works to form part families and machine cells.
Venugopal and Narendran (1992) and Islier (1998) used genetic algorithms to form part
families and machine cells. Recently, swarm intelligence techniques also known as Ant
search algorithms have been used to form part families and machine cells. Islier (2005),
Kao and Fu (2006), Kao and Li (2008) and Zhao et al. (2008) used this techniques to
form part families and machine cells.
Since efficient and optimal grouping are the primary steps to a successful CMS
implementation, research in this field will continue to develop novel grouping techniques.
The proposed research topic is devoted to the development of an efficient algorithm ant
based swarm intelligent technique. Various similarity measures used to determine the
association between parts and machines will be integrated into the ant clustering model.
Also, the impact of the similarity measures on optimal grouping will be compared and
5 Objectives of the Research
The objectives of the research are as follows:
To select and manipulate a multistage ant-based swarm intelligent
algorithm that can be used to solve part families and machine cells formation
problem.
To evaluate the impact of different similarity measures on both the
efficiency of the manipulated ant-based swarm intelligent algorithm and to
evaluate the quality of the developed solutions
Organization of the Research
The research in this thesis proposal is organized as follows:
Chapter 1: Introduction
Chapter 2: Literature review on various aspects of part family and machine
cell formation within the context of CMS and GT.
Chapter 3: Development of the Ant-Based Swarm Intelligent Algorithmic
Model.
Chapter 4: Analysis of various similarity measures and the assessments of
their impact on the model efficiency and optimal grouping
solutions.
Chapter 5: Numerical examples to test the model and its application.
6 CHAPTER II
REVIEW OF LITERATURE
Group technology is the first step stone for the design of manufacturing cells.
During the past few decades several approaches have been proposed for solving part
families and machine cells formation. These approaches can be divided into the
following:
• Classification and coding techniques • Array-based techniques
• Similarity coefficient techniques • Graph theoretic techniques
• Mathematical programming techniques • Artificial intelligent techniques
Review of literature based on the above classification is describes in the following
sections.
Classification and coding techniques
Classification and coding (CC) systems can be used as tool for GT by providing a
structure for the classification of parts into groups based on selected part attributes and by
assigning specific code to each part (Groover and Zimmers 1984, Hyer and Wemmerlov
1984, 1985). Some of the earliest coding systems include “Optiz Sytem”, developed in
the 1960’s in Germany and perhaps is the most widely known and used coding system at
that time in Europe (Optiz 1970, and Optiz and Wiendahl 1971). It has been used for
both machined and non-machined parts.
Another CC system developed during the 1960’s is known as the “Bisch Birn”.
7 Hyde 1981, Hyer et al. 1989). More recent commercial coding systems take advantage of
advanced computing technology databases (Tatikonda and Wemmerlov 1992). Examples
of these systems include Decision and Classification System (DCLASS), Computer
Aided Process Planning (CAPP) systems, Manufacturing Information Classification
System (MICLASS) and several other commercial systems that integrate both design and
manufacturing information in various databases.
Array-Based Techniques
In array based clustering techniques a machine part index matrix is constructed.
This matrix consists of 0, 1 entries where an entry 1 in the (i, j) position means that
machine i is used to process part j, and an entry 0 means that machine i is not used to
process part j. Algorithms are developed that transform the original matrix into a more
structured form, and consequently, result in the formation of part families (Al-Sultan,
1997). Some examples of matrix formulation methods are similarity coefficient methods,
the bond energy algorithm, the cluster identification algorithm and the extended cluster
identification algorithm.
El-Essawy and Torrance (1972) proposed a method called component flow
analysis (CFA). In some respects, the methodology of CFA differs from the of
Burbridge’s PFA procedure in the sense that CFA first partitions the problem, where PFA
does not.
McCormick et al. (1972) developed a method called the Bond Energy Algorithm.
This algorithm involves the evaluation of so called “bond energy” in the part machine
matrix. A bond is said to exist between a pair of adjacent row elements or column
8 equal to the product of the two adjacent elements. The total bond energy of the matrix is
equal to summation of the product of any two adjacent elements. The algorithm
manipulates the columns and rows of the part-machine matrix and tries to find a matrix
containing the highest total bond energy. This algorithm can identify part families and
machine cells simultaneously but still needs extensive manipulation of the final
part-machine matrix to form cells of the required size.
King (1980) developed the Rank Order Clustering (ROC) algorithm which
rearranges the rows and columns of the initial machine incidence matrix in decreasing
binary values to obtain a block diagonal form. However, the applicability of the
algorithm was restricted by the strong dependence of the results on the initial order of the
machine-part matrix and existence of storage problems created by the usage of binary
value used for reallocation.
Chan and Milner (1982) developed the Direct Clustering Algorithm (DCA) to
solve the part family and machine grouping problems for cellular manufacturing systems.
The Direct clustering Algorithm has four stages:
1. Count the number of positive entries in each row and column of the part-machine
matrix
2. Starting from the first column, transfer the rows with positive entries in that
column to the top portion of the matrix
3. Starting from the first column, transfer the rows with positive entries in that
column to the top portion of the matrix
4. Iterate between steps (2) and (3) until no further transfer is required.
This procedure allows user interaction to deal with the problems of the
9 Chandrasekharan and Rajagopalan (1986) proposed an ideal seed non-hierarchical
clustering algorithm which involves three primary stages. In the first stage, the problem
is formulated as a bi-partite graph which consists of a machine graph and a part
sub-graph. The k-means algorithm is then used to construct k parts and k machines by
grouping vectors which are close together. In the second stage, a performance measure
called group efficiency is used to compare different grouping alternatives. In the third
stage, parts and machines are rearranged to the closest ‘imaginary groups’ in an attempt
to improve the initial assignment.
Chow and Hawaleshka (1993) developed an algorithm to solve the machine
grouping problem that minimizes the intercellular movements with allocating a new
machine. It is observed that the total number of exceptional parts generated by the (n+1)
total number of machine cells is always greater than those generated by n total number of
machine cells.
Abdule-Wahab et al. (2006) presented a new hybrid algorithm for data clustering,
based off of the scatter search algorithm. Scatter search operates on a small set of
solutions and makes only a limited use of randomization for diversification when
searching for globally optimal solutions. The method proposed automatically discovers
cluster number and cluster centers without prior knowledge of a possible number of
classes, and without any initial partition. This algorithm was used by Rabbani et al.
(2007) to solve the dynamic cell formation problem.
Similarity Coefficient Methods
Several researchers have developed techniques to form the part families and
10 based on sequence of operations, the processing requirements of parts, the tooling
requirements of parts and availability of the tools on the machines etc. The first
similarity coefficient was developed by McAuley (1972) was the first to apply the
Jaccard similarity coefficient (Jaccard, 1908) to the machine cell formation problem and
is the most widely used in the literature (Yin & Yasuda, 2006). Most of the
similarity/dissimilarity coefficients based on binary data that can be found in literature
(Baulieu, 1989). However, only a handful of these measures has been suggested and
investigated within the context of GT/CMS for the purpose of cell formation and machine
groupings.
De Witte (1980) proposed three similarity measures which can be used in
production flow analysis. Since two of these coefficients showing the absolute relations
and mutual interdependence, they were considered mainly for cell formation. Threshold
values for these three similarity coefficients were arbitrary selected. In addition, the
approach requires classification of machines as primary, secondary and tertiary.
Similarly, Waghhodekar and Sahu (1984) proposed the use of one of three similarity
coefficients for Machine-components CeEll formation (MACE). Similarity coefficient
machine pairs can be either (i) additive type; (ii) product type or (iii) based on total flow
of common components.
Selvam and Balasubramanian (1985) developed a dissimilarity measure based on
operation sequence of manufacturing components. The dissimilarity matrix input
considered the total number of components and processing sequence of each one as well
as the production volume per period and handling cost per move between consecutive
11 et al. (1986) who suggested a dissimilarity coefficient using operation sequences and
Kamrani and Parsaei (1993) who proposed a weighted dissimilarity index based on a
disagreement measure of both design and manufacturing attributes between pairs of parts.
Choobineh (1988) developed a similarity measure, which based on the most
relevant attributes of manufacturing parts. These attributes include manufacturing
operations and their processing sequence that can be easily determined from their process
plans. Subsequently, the measure is used to form part families and machine cells.
Information obtained from manufacturing process plans were also utilized by Guiasingh
and Lashkari (1986) to develop a similarity measure that expressed the capability
between two machines in processing a set of parts requiring both machines. Machine
capability is defined in terms of the tools available and tooling requirements to process
the parts. Similarly, Tam (1990) suggested another similarity measure based on the
operation sequence of manufacturing parts to form part families and machine cell
groupings.
Gupta and Seifoddini (1990) proposed a new similarity index which took into
consideration relevant production data that should be included in the early stages of the
machine-component grouping process. The important production parameters
incorporated in the computation of similarity coefficient were pair-wise routing sequence,
part-wise average production volume, and unit operation time for each operation
performed. It was indicated that by incorporating important production that the proposed
measure has advantages and disadvantages. Some of the advantages included higher
coefficient values that were indirectly assigned to pairs of machines which process parts
12 (1993) suggested a new similarity coefficient which assigned pair-wise similarity among
machines with usage factors of all alternative routings.
Kusiak and Cho (1992) proposed two similarity measures, the first one is based
on binary information where a block diagonal structure is impeded into the machine-part
matrix and took into consideration basic and alternative process plans. Basically, it is a
binary measure that indicated weather one’s part’s process plan is a subset of another
part’s process plan. The second one is a modified version that generalizes the first
similarity measure. The modified version can be used for parts or machines when the
value of the first similarity measure would have been zero.
Moussa and Kamel (1996) proposed a new similarity measure based on the
information provided in process plans. The information taken into consideration included
manufacturing processing sequence of parts and their processing times during the
assignment process. Jeon et al. (1998) extended the use of manufacturing attributes to
include machine failure. Jeon and Leep (2006) proposed a new similarity measure,
which took into consideration the number of available alternative process routes when
available during machine failure. It was indicated that the measure draws on the number
of alternative routes during machine failure when alternative routes are available instead
of drawings on other production attributes including; operations, sequence, machine
capabilities, production volume, processing requirements or operational times.
Islam and Sarker (2000) proposed a new similarity coefficient that is able to
reflect the extent of true similarity of pairs of machines or parts in an incident matrix.
The new measure of similarity is called relative matching coefficient. Unlike other
13 to commonly known similarity properties defined in literature such as (i) No mismatch,
(ii) Minimum match, (iii) No match, (iv) Complete match, and (v) Maximum match. The
new similarity coefficient is used as an intermediate tool to form cohesive manufacturing
cells.
Comparative Studies of Similarity Coefficients
One of the earliest studies conducted to compare the effectives of various
similarity measures or coefficients was reported by Mosier (1989). The study applied a
mixture model experimental approach to compare seven similarity coefficients and four
clustering algorithms. The similarity coefficients that were examined are given in Table
2.1.
The four well-known algorithms used in this study are, (i) Single Linkage
(SLINK); (ii) Complete Linkage (CLINK); (iii) Centroid (CENT); and Ward’s Method
(WARD) by using Monte Carlo simulation to generate 30 problems with 100 parts and
100 machines. Four performance measures were used to evaluate the goodness of
generated solutions including; 9i) Simple matching measure; (ii) Generalized matching
measure; (iii) Product moment measure; and (iv) intercellular transfer measure.
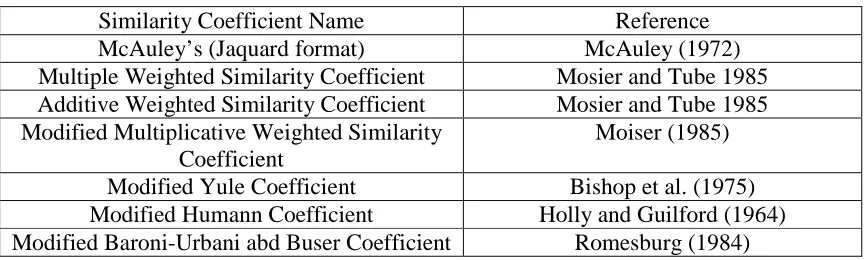
Table 2.1 List of Similarity Coefficients Examined (Mosier, 1989)
Similarity Coefficient Name Reference
McAuley’s (Jaquard format) McAuley (1972)
Multiple Weighted Similarity Coefficient Mosier and Tube 1985 Additive Weighted Similarity Coefficient Mosier and Tube 1985 Modified Multiplicative Weighted Similarity
Coefficient
Moiser (1985)
Modified Yule Coefficient Bishop et al. (1975)
Modified Humann Coefficient Holly and Guilford (1964)
14 The results of this study indicated that McAuley’s similarity coefficient and the
modified multiplicative weighted similarity coefficient are preferable compared with
other similarity coefficients. However, Shafer and Rogers (1993) pointed out some of the
limitations including that three of four performance measures are for measuring how
closely the solution generated by the cell formation procedures matched the original
machine-part matrix. In addition, the original machine-part matrix may not necessarily
be the best or even a good configuration. Only the intercellular transfer measure of
performance is considering specific objectives associated with machine cell formation
problem. Further research recommendations to examine clustering efficacy and other
measures were also sighted.
Shafer and Roger (1993) compared 16 similarity coefficients in conjunction with
four clustering algorithms using 11 small example data based binary machine-part data
sets mostly from the literature. Part family and machine cell grouping results were
evaluated using four performance measures. The use of small well structured data set
with some of the performance measures may not provide the discriminatory power
needed to separate superior, from good and good from inferior techniques. In addition,
the use of well structured small data set may provide results with a little general
reliability due to strong dependency on the original input data. (Anderberg, 1973;
Milligan and Cooper 1987; Vakharia and Wemmerlöv, 1995).
Seifoddinin and Hsu (1994) studied three different similarity coefficients
(Jaccard’s similarity coefficient, weighted similarity coefficient, and commonality score)
30 machine-component grouping problems. Several performance measures were used to
15 grouping capability index. Results showed that the weighted similarity coefficient
generates better solutions based on the number of exceptional parts. On the hand, it was
observed that grouping efficiency, grouping efficacy and the grouping capability index
were not consistent performance measures.
Vakharia and Wemmerlöv (1995) conducted a study to evaluate the impact of
dissimilarity measures and clustering algorithm techniques on the quality of solution with
respect to part family formation and machine cell groupings. Eight dissimilarity
measures were studied in conjunction with seven clustering algorithms using 24 binary
data sets. Results of this study revealed that high internal cell cohesiveness and low
levels of machine duplication were shown to be conflicting goals. The study also
revealed that performance is sensitive to many factors, notably the underlying data and
the stopping parameters. It was indicated that more research work is needed to link data
structures to choice of clustering technique and dissimilarity measure. Also, more work
is needed to find measures and methods under which cell system solutions can be
compared at the aggregate level while considering individual cell properties.
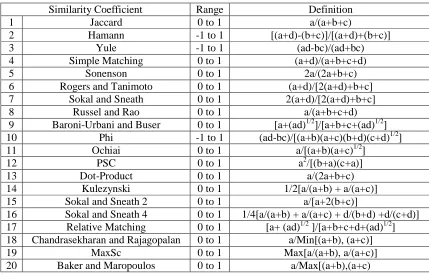
Yin and Yasuda (2005 & 2006) conducted a study to evaluate the performance of
20 similarity coefficients shown in Table 2. In addition, a total of 94 data sets obtained
literature and another 120 generated deliberately were used in this study in conjunction
with three clustering algorithms (Single linkage clustering, SLC; complete linkage
clustering, CLC; and average linkage clustering, ALC) were used in this study. Nine
performance measures were used to evaluate the grouping solutions. The performance
measures are the following:
16 • Grouping efficiency,
• Group efficacy,
• Machine utilization index (grouping measure, GM), • Clustering measure (CM),
• Grouping index (GI),
• Bond energy measure (BEM),
• Grouping capability index (GCI), and
• Alternative routing grouping efficiency (ARG efficiency)
Table 2.2 Similarity Coefficients Compared (Yin and Yasuda, 2006)
Similarity Coefficient Range Definition
1 Jaccard 0 to 1 a/(a+b+c)
2 Hamann -1 to 1 [(a+d)-(b+c)]/[(a+d)+(b+c)]
3 Yule -1 to 1 (ad-bc)/(ad+bc)
4 Simple Matching 0 to 1 (a+d)/(a+b+c+d)
5 Sonenson 0 to 1 2a/(2a+b+c)
6 Rogers and Tanimoto 0 to 1 (a+d)/[2(a+d)+b+c]
7 Sokal and Sneath 0 to 1 2(a+d)/[2(a+d)+b+c]
8 Russel and Rao 0 to 1 a/(a+b+c+d)
9 Baroni-Urbani and Buser 0 to 1 [a+(ad)1/2]/[a+b+c+(ad)1/2]
10 Phi -1 to 1 (ad-bc)/[(a+b)(a+c)(b+d)(c+d)1/2]
11 Ochiai 0 to 1 a/[(a+b)(a+c)1/2]
12 PSC 0 to 1 a2/[(b+a)(c+a)]
13 Dot-Product 0 to 1 a/(2a+b+c)
14 Kulezynski 0 to 1 1/2[a/(a+b) + a/(a+c)]
15 Sokal and Sneath 2 0 to 1 a/[a+2(b+c)]
16 Sokal and Sneath 4 0 to 1 1/4[a/(a+b) + a/(a+c) + d/(b+d) +d/(c+d)]
17 Relative Matching 0 to 1 [a+ (ad)1/2 ]/[a+b+c+d+(ad)1/2]
18 Chandrasekharan and Rajagopalan 0 to 1 a/Min[(a+b), (a+c)]
19 MaxSc 0 to 1 Max[a/(a+b), a/(a+c)]
20 Baker and Maropoulos 0 to 1 a/Max[(a+b),(a+c)
Where:
17
d is the number of machines which produce neither components i or j
Study results revealed that three similarity coefficients are more efficient and four
similarity coefficients are inefficient for solving the cell formation problem. In addition,
it was found that Jaccard similarity coefficient is the most stable similarity coefficient. It
was indicated that further research is needed to consider some production factors such as
production volume, sequences of parts and so on.
Based on the above review of similarity measures, it can be revealed that most of
these measures assume that the demand for each product during the planning period
remains constant. The demand and processing times are assumed to be known with
certainty. This may not be true in many production environments, hence there is a
potential for discrepancy in the design solutions. In addition, none of these measures
takes into consideration production lot size for each product and production scheduling
constraints.
Graph Theoretic Techniques
Graph theoretic methods convert a machine part index matrix into a hypothetical
graph where the vertices represent machines and/or parts and the edges stand for the
similarity coefficients between machines. Matula (1969, 1970) was the first to
demonstrate the applicability of high connectivity in similarity graphs to cluster analysis.
Matula’s approach is based on the cohesiveness function. This function is defined for
every vertex and edge of a graph G to be the maximum edge-connectivity of any
sub-graph containing that element. Hartuv and Shamir (2000) adopted the same technique to
develop a clustering algorithm, where similarity data is used to form a similarity graph.
18 clusters are highly connected sub-graphs whose edge connectivity exceeds half the
numbers of vertices.
Rajagopalan and Batra (1975) used graph partitioning approach to solve grouping
problem of machine cells. Input data derived from the route cards of the components in
analyzed and used to derive a graph whose vertices correspond to the machines and
whose edges represents the relationship created between machines by the components
using them. Once machine cells are formed by using the graph partitioning approach, the
parts are allocated to the machine cells and the number of machines of a particular type in
each cell is determined. One of the limitations of this technique is that machine cells and
part families are not formed concurrently.
Kumar et al. (1986) used the graph theoretic technique and solved a graph
partitioning problem to determine machine cells and part families for a fixed number of
groups with machine cell size boundaries. Subsequently, Vannelli and Kumar (1986)
extend the work and developed graph theoretic models to determine machines that need
duplication in order to obtain a perfect block diagonal structure. In addition, Kumar and
Vanelli (1987) used similar techniques for determining parts to be subcontracted to obtain
a perfect block diagonal structure. Solutions obtained from these methods are found to
depend on the choice of initial pivot elements.
Askin and Chiu (1990) developed a heuristic graph partitioning procedure to
solve machine assignment and cell formation problem. First, a mathematical
programming model is developed to incorporate costs of inventory, machine
depreciation, machine setup, and material handling. The formulation is then divided into
19 then the second sub-problem grouped machine into cells. Then the sub-problems are
solved using a heuristic graph partitioning procedure. Finally, an approach to determine
the economic batch size is also included.
Vohra et al. (1990) proposed a network-based algorithm to minimize the amount
of machining times performed outside the part primary cells. A non-heuristic network
approach is used to form manufacturing cells with minimum intercellular interactions.
The machine-part matrix containing machining times is represented as a network which is
subsequently partitioned by using a modified Gomory-Hu algorithm to find a minimum
intercellular interaction.
Sinh and Mohanty (1991) developed a method for selecting an efficient path in
fuzzy multi-objective networks to solve the routing problem in the manufacturing cell.
An application of the methodology was also illustrated as the process plan selection
problem. Askin et al. (1991) proposed a formulation for machine and part grouping
problem, so called Hamiltonian Path approach. The part-matrix incidence matrix was
used to represent the problem. The jaccard’s similarity measure was used to form a
distance measure for each machine pair and part pair.
Wu and Salvendy (1993) developed a network (an undirected graph) model to
partition the machine graph into cells by considering operation sequences. Two
algorithms are used in this model. The first algorithm partitions the network by finding
the minimum cut sets in the network so that the resultant interaction between cells is
minimal. The second algorithm is a simplified version of the first algorithm by selecting
20 However, the solution from this method is not guaranteed optimal (minimum intercellular
movements).
Kandiller (1998) presented a cell formation technique using the hyper graph
representation of the manufacturing systems. The proposed method approximates the
hypergraph model by graphs so that the cuts are less affected by the approximation. A
Gomory-Hu cut tree of the graph approximation then can be obtained. The minimum
cuts between all pairs of vertices are calculated easily by the means of means of this tree,
and a partition tree is produced. An algorithm is also presented to cut the partition tree.
This algorithm is subjected to an experimentation of randomly generated manufacturing
situations.
Recently, Zhao et al. (2008) developed a mathematical model of part clustering of
product family based on weighted directed graph technique. The model is extended to
incorporate swarm intelligent algorithm to develop e-manufacturing model, which can be
used to solve the part family formations and machine cell groupings in e-manufacturing
environment for mass customization. It was indicated that the system can be used as a
support technology for mass customization, which is very important to develop optimal
formation of manufacturing cells and could be more efficient in e-manufacturing mode
than in traditional manufacturing mode.
Mathematical Programming Techniques
In mathematical programming techniques a number of part families/machine cells
formation models have been developed using integer programming, mixed integer
programming and goal programming. The objective functions of such models include,
21 the intercellular movements of parts, or machine workload deviations. Most of these
models incorporate some kind of system constraints such as available capacity and/or
machine cell size
Kusiak (1987) developed two different models that are based on p-median
clustering techniques. The problems are formulated as 0/1 integer program to form part
families and machine cells with the objective of maximizing the sum of similarities while
considering different system constraints. In some cases, the models have difficulties in
assigning the initial p-value. Ben-Arieh and Chang (1994) modified the p-median model
by introducing p, the number of machine cells into the objective function to overcome the
difficulty of assigning an initial p value; thus improving the optimization process to form
part families and machine cells. Won (2000), and Won and Lee (2004) modified the
p-median models to include new measures of similarity between machine pairs to solve
machine grouping problem and deal with disadvantages of previous models such as large
number of binary variables and constraints.
Co and Araar (1988) proposed a three-stage procedure to from machine cells to
process specific sets of jobs. A mathematical program is formulated in the first stage to
assign operations to machines with the objective of minimizing the deviations between
workload assigned to machines and the available capacity. System constraints were
based the available machining times. A direct search algorithm is implemented to define
the composition of manufacturing cells.
Askin and Chiu (1990) proposed a mathematical model and solution procedure
for the group technology configuration problem. In this model, costs of inventory,
22 mathematical programming formulation. The formulation is then divided into two
sub-problems in order to find a solution. A heuristic graph partitioning procedure is then
proposed for each sub-problem. The first sub problem assigns components to specific
machines. The second sub-problem groups machines into cells.
Rajamani et al. (1990) developed three mathematical programming models to
simultaneously form part families and machine groupings to analyze the effects of
alternative process plans on the utilization of resources. The first model assigns
machines to parts while minimizing the total investment cost subject to machine capacity
and available budget. The second model assumes that part families are known and
selects a process plan for each part, required machine for each operation and the number
of machines in different cells. The objective in this case is to minimize the total
investment cost subject to the same system constraints described in the first model. The
third model determines both part families and machine groupings simultaneously subject
to the same set of limitations. Comparisons of cost functions for the three models are
also provided.
Demodaran et al. (1992), Liang and Taboun (1992), Shafer et al. (1992) and
Rajamani et al. (1992) developed mathematical programming models that
simultaneously form part families and machine groupings which minimizes the
intercellular movement of parts and their associated costs. System limitations such as
machine capacities, exceptional elements and precedence relationships of parts are some
of those constraints considered for different models.
Dahel and smith (1993) proposed two mathematical programming models to
23 model takes into consideration available machine capacity and cell size as system
constraint while minimizing intercellular movements of parts. The second model is
formulated as a multi-objective mathematical program to from machine cells which are
flexible and have minimum interactions. Bothe models are analyzed and examined under
the inter-cell routing flexibility criteria.
Logendran (1993) proposed a 0/1 quadratic mathematical program to
simultaneously form part-machine grouping and evaluate the effectiveness of this
grouping techniques in CMS. The objective function considered in this model consists of
maximizing unified measure of effectiveness evaluated as the weighted sum of total
moves and cell utilization subject to certain operational constraints. The constraints in
processing times, sequence of operations, available machining capacities and
non-consecutive operations scheduled on the same machine. The model is extended to take
into consideration multiple routings for each part.
Adil et al. (1993) proposed a mathematical model which would take into
consideration investment and operational costs during the cellular manufacturing design
process. The majority of the cell formation models in literature consider grouping of
parts and machines, based on clustering techniques. The performance of manufacturing
cells formed therefore indicates that the cellular systems perform more poorly in terms of
work-in-process inventory, average job waiting time and job flow time than the improved
job shops. These cells, on the other hand, have superior performance in terms of average
move times and setup. The mixed integer model developed by Adil et al. (1993)
24 Moon and Gen (1999) and Sofianopoulou (1999) formulated a 0-1 integer
mathematical programming models which consider both machine duplication and
alternative process plans to form machine cells. Several manufacturing parameters
including production volume levels, machining capacities, processing times, and the size
of machine cells are taken into account as system constraints. Different optimization
techniques are used to solve each model including genetic and simulated annealing
algorithms.
Baykasoğlu et al. (2001) proposed an integer multi-objective non-linear model to
solve part family and machine grouping problem simultaneously. The model uses
generic capability units which are termed as resource elements to define processing
capabilities of machine tools. Also, it takes into consideration important objectives such
as minimization of part dissimilarity associated with production requirements and
processing sequence of parts, minimization of machine cell workload imbalance and
minimization of extra capacity requirements for cell formation.
Slomp et al. (2005) considered a new type of virtual cellular manufacturing (CM)
system is considered, and proposed a multi-objective design procedure for designing such
cells in real time. Retaining the functional layout, virtual cells are addressed as temporary
groupings of machines, jobs and workers to realize the benefits of CM. The virtual cells
are created periodically, for instance every week or every month, depending on changes
in demand volumes and mix, as new jobs accumulate during a planning period. The
proposed procedure includes labor grouping considerations in addition to part-machine
grouping and is based on interactive goal programming methods. Factors such as capacity
inter-25 cell movements of parts and provision of flexibility are considered. In labor grouping, the
functionally specialized labor pools are partitioned and regrouped into virtual cells.
Factors such as ensuring balanced loads for workers, minimization of inter-cell
movements of workers and providing adequate levels of labor flexibility are considered
in a pragmatic manner.
Dafersha and Chen (2006) proposed a comprehensive mathematical model for the
design of CMS based on tooling requirements of the parts and tooling available on the
machines. The model incorporates dynamic cell configuration, alternative routings, lot
splitting, and sequence of operations, multiple units of identical machines, machine
capacity, and workload balancing among cells, operation cost, and cost of subcontracting
part processing, tool consumption cost, setup cost, cell size limits, and machine adjacency
constraints. Computational experience on small problems showed that a significant
amount of cost savings can be achieved by considering system reconfigurations, lot
splitting and system flexibility; and that there are significant differences on workload
distribution among the cells, if workload balancing is not attempted.
Satoglu and Suresh (2009) proposed a goal-programming model for the design of
hybrid cellular manufacturing (HCM) systems, in a dual resource constrained
environment, considering many real-world application issues. The procedure consists of
three phases. The initial phase involves a Pareto analysis of demand volumes and
volatility. In the second phase, a machine-grouping phase is conducted to form
manufacturing cells, and a residual functional layout. In this phase, over-assignment of
parts to the cells, machine purchasing cost, and loss of functional synergies are attempted
26 allocation phase (the third phase) is carried out by considering worker capabilities and
capacities. The total costs of cross-training, hiring, firing and over-assignment of workers
to more than one cell are sought to be minimized.
Arikan and Güngör (2009) proposed a new multi-objective fuzzy mathematical
model for the cellular manufacturing system (CMS) design and its solution methodology.
The goal of their m model is to handle two important problems of CMS design called cell
formation and exceptional elements simultaneously in fuzzy environment. The objective
functions of the model are minimization of the cost of exceptional element elimination,
minimization of the number of outer cell operations and maximization of the utilized
machine capacity. The fuzziness stems from model parameters which are part demand,
machine capacity and the exceptional elements' elimination costs. To illustrate the model,
an example problem with fuzzy extension is adopted from literature and computational
results are obtained by using the two-phased solution procedure proposed in their study.
The approach is performed to reach simultaneous optimal solutions for all objective
functions. The model solutions are investigated by using well-known performance
measures and also three problem-specific performance measures are proposed. The
model is capable of expressing vagueness of all the system parameters and gives the
decision-maker (DM) alternative decision plans for different grades of precision.
Artificial Intelligence Techniques
An artificial neural network is a mathematical model or computational model that
tries to simulate the structure and/or functional aspects of the brain. It consists of an
interconnected group of artificial neurons and it processes information using a
27 intelligence and are capable of learning. Du (2010) has outlined several neural network
clustering algorithms, including C-means clustering, competitive learning, and mountain
and subtractive clustering..
The most well-known data clustering technique is the statistical C-means, also
known as the k-means (Du, 2010). The C-means algorithm approximates the maximum
likelihood (ML) solution for determining the location of the means of a mixture density
of component densities (Moody & Darken, 1989). The C-means can be implemented in
either the batch mode (Linde, Buzo, & Gray, 1980; Moody & Darken, 1989) or the
incremental mode (MacQueen, 1967). The batch C means (Linde et al. 1980), is applied
when the whole training set is available. The incremental C-means is suitable for a
training set that is obtained on-line. In the batch C-means, the initial partition is
arbitrarily defined by placing each input pattern into a randomly selected cluster, and the
prototypes are defined to be the average of the patterns in the individual clusters (Du,
2010). When the C-means is performed, at each step the patterns keep changing from one
cluster to the closest cluster ck according to the nearest-neighbor rule and the prototypes
are then recalculated as the mean of the samples in the clusters (Du, 2010).
Competitive learning can be implemented using a two-layer neural network. The
input and output layers are fully connected. The output layer is called the competition
layer, wherein lateral connections are used to perform lateral inhibition. Based on the
mathematical statistics problem called cluster analysis, competitive learning is usually
derived by minimizing the mean squared error function (Tsypkin, 1973).
The mountain clustering is a simple and effective method for estimating the
28 The method grids the data space and computes a potential value for each grid point based
on its distance to the actual data points. Each grid point is a potential cluster center. The
potential for each grid is calculated based on the density of the surrounding data points.
The grid with the highest potential is selected as the first cluster center and then the
potential values of all the other grids are reduced according to their distances to the first
cluster center. The next cluster center is located at the grid point with the highest
remaining potential. This process is repeated until the remaining potential values of all
the grids fall below a threshold. However, the grid structure causes the complexity to
grow exponentially with the dimension of the problem. The subtractive clustering (Chiu,
1994a), as a modified mountain clustering, uses all the data points to replace all the grid
points as potential cluster centers. This effectively reduces the number of grid points to N
(Chiu, 1994a).
Genetic Algorithms
Genetic Algorithms (GA) have been developed by Holland (1975) at the
University of Michigan. Holland’s research had two primary goals. The first was to
abstract and rigorously explain the adaptive processes of natural systems. The second
was to design artificial system software that retains the important mechanisms of natural
systems. This approach has led to important discoveries in both natural and artificial
systems science. Genetic algorithms start with an initial set of random solutions called the
population. Each individual in the population is called a chromosome, representing a
solution to the problem at hand. A chromosome is a string of symbols, and is usually a
binary string. There are two kinds of operations encountered in genetic algorithms. The
29 operation (selection or reproduction). Some of the GA applications include
optimization, group technology and manufacturing cell formation. The following
literature describes some recent developments in GA within the context of GT and
machine cell formation.
Gonҫalves and Resende (2004) proposed a new approach for obtaining machine
cells and product families. This approach combines a local search heuristic with a
genetic algorithm. The genetic algorithm uses a random keys alphabet, an elitist
selection strategy, and a parameterized uniform crossover. Computational experiences
performed on 34 different group technology problems, show that the algorithm performs
remarkably well when compared other algoritms.
Jeon and Leep (2006) developed a methodology which can be used to form
manufacturing cells using both a new similarity coefficient based on t he number of
alternative routes during machine failure and demand changes for multiple periods. The
methodology is divided into two phases. The first phase suggests a new similarity
coefficient, and the second phase uses a genetic algorithm for cell formation. This GA
considers the scheduling and operational aspects in cell design under demand changes.
Finally, machines are assigned to part families using mixed integer programming.
Tariq et al. (2008) developed a hybrid genetic algorithm for machine-part
grouping. This algorithm is an approach that combines a local search heuristic (LSH)
with genetic algorithms (GA). The GA uses integer type representation, multipoint
crossover and roulette wheel selection procedure. The computational experience done
show that the algorithm converges to the best solution in the initial generations but also
30 observed that the proposed algorithm was more consistent in terms of accuracy with
respect to the problem size, when compared to other algorithms.
Venugopal and Narendran (1992) proposed a genetic algorithm approach to the
machine-component grouping problem with multiple objectives. The algorithm is
bi-criteria mathematical model with a solution procedure based on the genetic algorithm.
This study is a first of its kind in group technology literature, and a successful
demonstration of the application of genetic algorithm to the machine-component
grouping problem. The algorithm is found to be effective in offering a collection of
satisfactory solutions, which is essential in a multi-objective environment, to enable the
decision maker to choose the best alternative. It is independent of the nature of the
objective functions. It is inherently parallel and is capable of super linear speed-up in
multi-processor systems. With the availability of parallel computers, this algorithm will
be particularly useful in solving part-family problems in complex, large scale FMS
environments.
Hsu and Su (1998) proposed a genetic algorithm based procedure to solve the
cellular manufacturing grouping problem. More specifically, they aimed to minimize (i)
total cost, which includes inter-cell and intra-cell part transportation costs and machines
investment cots; (ii) intra-cell machine loading imbalance; and (iii) inter-cell machine
loading imbalance under many realistic considerations. The procedure they proposed is
extremely adaptive, flexible, and efficient; and can be used to solve real manufacturing
grouping problem problems in factories by providing robust manufacturing cell formation