University of Windsor University of Windsor
Scholarship at UWindsor
Scholarship at UWindsor
Electronic Theses and Dissertations Theses, Dissertations, and Major Papers
2010
Plasma Electrolytic Oxidation (PEO)Coatings on a Zirconium Alloy
Plasma Electrolytic Oxidation (PEO)Coatings on a Zirconium Alloy
for Improved Wear and Corrosion Resistance
for Improved Wear and Corrosion Resistance
Ying Chen
University of Windsor
Follow this and additional works at: https://scholar.uwindsor.ca/etd
Recommended Citation Recommended Citation
Chen, Ying, "Plasma Electrolytic Oxidation (PEO)Coatings on a Zirconium Alloy for Improved Wear and Corrosion Resistance" (2010). Electronic Theses and Dissertations. 179.
https://scholar.uwindsor.ca/etd/179
Plasma Electrolytic Oxidation (PEO) Coatings on a
Zirconium Alloy for Improved Wear and Corrosion
Resistance
by
Ying Chen
A Thesis
Submitted to the Faculty of Graduate Studies through Engineering Materials
in Partial Fulfillment of the Requirements for the Degree of Master of Applied Science at the
University of Windsor
Windsor, Ontario, Canada
2010
Plasma Electrolytic Oxidation (PEO) Coatings on a Zirconium Alloy For Improved Wear and Corrosion Resistance
by
Ying Chen
APPROVED BY:
______________________________________________ Dr. V. Stoilov
Department of Mechanical, Automotive and Materials Engineering
______________________________________________ Dr. A. Fartaj
Department of Mechanical, Automotive and Materials Engineering
______________________________________________ Dr. X. Nie, Co-advisor
Department of Mechanical, Automotive and Materials Engineering, Advisor
______________________________________________ Dr. D.O. Northwood, Co-advisor
Department of Mechanical, Automotive and Materials Engineering, Advisor
DECLARATION OF CO-AUTHORSHIP/PREVIOUS
PUBLICATIONS
I hereby declare that this thesis incorporates material that is the result of a
joint research undertaken under the supervision of professors Derek O. Northwood
and Xueyuan Nie. The research collaboration is covered in Chapter 4 and 5 of the
thesis. In all cases, the key ideas, primary contributions, experimental designs, data
analysis and interpretation, were performed by the author, and the contributions of
the co-authors was in the capacity of supervision of the research in the form of
technical advice and suggestions.
I am aware of the University of Windsor Senate Policy and Authorship and I
certify that I have properly acknowledged the contribution of other researchers to
my thesis, and have obtained written permission from each of the co-authors to
include the above materials in my thesis.
I certify that, with the above qualification, this thesis, and the research to
which it refers, is the product of my own work.
This thesis includes 2 original papers that have been previously
published/submitted for publication in peer reviewed journals, as follows:
1. Y. Chen, X. Nie & D. O. Northwood, Plasma Electrolytic Oxidation (PEO)
coatings on a zirconium alloy for improved wear and corrosion resistance,
2. Y. Chen, X. Nie & D.O. Northwood. Investigation of Plasma Electrolytic
Oxidation (PEO) coatings on a Zr-2.5Nb alloy using high
temperature/pressure autoclave and tribological tests, Surface & Coatings
Technology (2010), In Press. doi: 10.1/j.surfcoat.2010.08.038.
I certify that I have obtained permission from the copyright owners to
include the above published materials in my thesis. I certify that the above material
describes work completed during my registration as a graduate student at the
University of Windsor.
I certify that, to the best of my knowledge, my thesis does not infringe upon
anyone’s copyright nor violate any proprietary rights and that any ideas, techniques,
quotations, or any other material from the work of other people included in my
thesis, published or otherwise, are fully acknowledged in accordance with the
standard referencing practices. Furthermore, to the extent that I have included
copyrighted material that surpasses the bounds of fair dealing within the meaning of
the Canada Copyright Act, I certify that I have obtained a written permission from
the copyright owner(s) to include such material(s) in my thesis.
I declare that this is a true copy of my thesis, including any final revisions,
as approved by my thesis committee and the Graduate Studies office, and that this
thesis has not been submitted for a higher degree to any other University or
ABSTRACT
A Plasma Electrolytic Oxidation (PEO) process was used to produce thin oxide
coatings on a Zr-2.5wt%Nb alloy. Effects of current density on surface
morphologies and wear properties of PEO coatings were investigated and compared
to the substrate and the black oxide coating. Corrosion properties at ambient and
high temperature/pressure conditions were studied using potentiodynamic
polarization tests and autoclave tests, respectively. Autoclave tests were carried out
at 300°C and 10MPa in 0.05M LiOH solutions. After the autoclave tests, PEO
coatings had larger weight gains in the first 10-day-exposure than the black oxide
coating. However, the black oxide coating exhibited a similar weight gain to PEO
coatings after the tests. PEO coatings prepared at low current densities had lower
weight gains. Although the black oxide coating exhibited a good corrosion
DEDICATION
To My Parents,
Jianping Chen and Zhiyin Chen,
ACKNOWLEDGEMNTS
I would like to express my whole-heartedly gratitude to Dr. Xueyuan Nie and Dr.
Derek. O. Northwood both, for their instructive and excellent supervision during my
studies and research work, as well as their kindness and patience.
I also wish to thank Mr. John Robinson for his generous technical help in
machine building, sample preparationm and XRD and SEM analysis.
Special thanks are given to my group members, Dr. Linlin Wang, Junfeng Su,
Peng Zhang and Dr. Riyad Hussein for their selfless help and suggestions
Last but not least, my deepest love and gratitude to my beloved parents, Jianpin
Chen and Ziyin Chen, whose spiritual presence was a constant inspiration for
TABLE OF CONTENTS
DECLARATION OF CO-AUTHORSHIP/PREVIOUS PUBLICATIONS ... III
ABSTRACT ... V
DEDICATION ... VI
ACKNOWLEDGEMNTS ... VII
LIST OF TABLES ... XIII
LIST OF FIGURES ... XIV
Chapter 1: INTRODUCTION ... 1
1.1 Motivation ... 1
1.2 Objectives and contents of this study ... 3
1.3 Organization of the thesis ... 3
Chapter 2: LITERATURE REVIEW ... 5
2.1 Introduction to the CANDU nuclear reactor ... 5
2.2 Development of pressure tubes in CANDU nuclear reactor ... 8
2.3 Fabrication of pressure tubes in the nuclear plant ... 12
2.4 In-reactor deformation of pressure tubes in CANDU reactor ... 17
2.4.1 Life-limiting factors for a pressure tube ... 17
2.4.2 Methods to reduce the degradation during service ... 17
2.5.1 The kinetics of the oxidation of corrosion of zirconium and its alloys ... 23
2.5.1.1 Pretransition period ... 25
2.5.1.2 The transition ... 26
2.5.1.3 Post-transition period ... 29
2.5.2 The Phase-Transformation theory and failure of oxide film ... 31
2.5.3 Properties of the oxide film ... 34
2.6 Methodology for evaluation of of Zr-2.5Nb tubes and deuterium uptake ... 35
2.7 The effects of Lithium on the corrosion behavior of zirconium alloys ... 38
2.8 Wear concerns in the reactor core ... 41
2.9 Technical problems to be addressed ... 43
2.10 Development of PEO technique ... 44
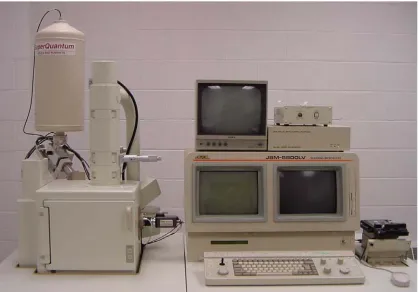
2.11 PEO equipment ... 45
2.12 Coating procedure ... 47
2.13 Phenomena during the PEO process ... 47
2.14 General principles of PEO ... 49
2.15 PEO coatings fabricated on zirconium alloys ... 51
2.16 PEO coating structure on Zirconium alloys ... 53
2.17 Summary of the literature review ... 57
Chapter 3: EXPERIMENTAL PROCEDURES ... 59
3.1.2 Chemicals ... 60
3.2 Specimen preparation ... 62
3.3 Deposition process for PEO coatings ... 63
3.4 Evaluation of the properties of the coatings ... 64
3.4.1 Surface morphology and coating thickness ... 64
3.4.2 Phase identification of the coatings ... 65
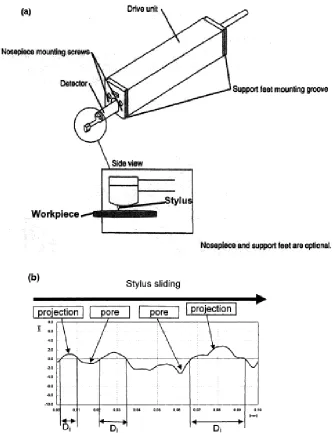
3.4.3 Surface roughness measurement ... 66
3.4.4 Pin-on-disc tribology test ... 67
3.4.5 Potentiodynamic polarization testing ... 68
3.4.5.1 Three-electrode cell ... 68
3.4.5.2 The calculation of polarization resistance Ra ... 70
3.4.6 Autoclave experiment ... 71
3.4.7 Nano-hardness measurement ... 74
Chapter 4: EXPERIMENTAL RESULTS AND DISCUSSION ... 77
4.1 Microstructure of Zr-2.5Nb alloy ... 77
4.2 Characterization of PEO coatings ... 78
4.2.1 The characteristics of the PEO process using DC power with a Zr-2.5Nb alloy ... 78
4.2.2 Voltage increment curve analysis during PEO process ... 83
4.4.1 EDX spectra for coated and uncoated samples ... 92
4.4.2 XRD patterns for coated and uncoated samples ... 94
4.5 Corrosion protection properties of PEO coatings ... 96
4.5.1 Potentiodynamic polarization tests ... 96
4.5.2 Autoclave experiments ... 100
4.5.3 SEM micrographs for samples at different exposure times during autoclave experiment. ... 102
4.5.4 XRD analysis after autoclave tests. ... 110
4.5.5 Potentiodynamic polarization testing of autoclaved specimens to determine changes in corrosion resistance. ... 112
4.5.6 Surface roughness of autoclave exposed samples ... 114
4.5.7 Nano-hardness testing of autoclave exposed samples ... 115
4.6 Pin-on-disc tests ... 117
4.6.1 Sliding tests under different conditions. ... 117
4.6.2 SEM micrographs of wear traces ... 119
4.7 Summary ... 123
Chapter 5 CONCLUSIONS AND FUTURE WORK ... 126
5.1 Effects of process parameters of PEO treatment on coating surface morphology ... 126
5.2.1 Potentiodynamic polarization tests ... 127
5.2.2 Autoclave tests ... 127
5.2.3 Wear tests ... 128
5.3 Future work ... 129
REFERENCES ... 130
LIST OF TABLES
Table 2.1 Constants of the kinetics of the oxidation of zirconium and Zr-2.5Nb . ... 26
Table 2.2 Corrosion tests on zirconium alloys in steam at 650°C . ... 27
Table 2.3 Studies of PEO technique on zirconium alloys. ... 52
Table 3.1 Chemical analysis of Zr-2.5 wt.% Nb alloy ... 60
Table 3.2 Chemicals used in this study ... 61
Table 3.3 Treatment parameters for PEO coatings ... 64
Table 4.1 Average thickness of PEO coatings measured on cross-sectional SEM micrographs ... 90
Table 4.2 Results of potentiodynamic polarization tests (ranking chart) in a 0.2mol/L LiOH solution ... 99
Table 4.3 Results of the potentiodynamic polarization tests on samples removed from autoclave corrosion tests at fixed time intervals. ... 113
Table 4.4 Nano-hardness (H) and elastic modulus (E) of PEO coatings and substrate before and after autoclave testing. ... 116
Table 4.5 Wear/Failure distances of coated & uncoated samples under rotating mode. ... 118
LIST OF FIGURES
Fig. 2.1 CANDU basic lattice cell for 37-element fuel ... 6
Fig. 2.2 CANDU-PHW reactor core, the fuel bundle and how a fuel bundle settled
inside the pressure tube ... 8
Fig. 2.3 (a) The corrosion and hydrogen increase in Zircaloy-2 pressure tubes after
reactor service and (b) Deuterium concentration in Zircaloy-2 and Zr-2.5Nb
pressure tubes including Wolsong-1 reactor ... 11
Fig. 2.4 Abridged flow chart for the fabrication of CANDU Zr-2.5Nb pressure
tubes ... 13
Fig. 2.5 Typical grain structure in Zr-2.5Nb pressure tubing looking down the axis
of the tube. The light colored α-phase platelets are interspersed with
dark-colored β-phase filaments ... 14
Fig. 2.6 Schematic Zr-Nb binary phase diagram ... 15
Fig. 2.7 Though-wall crack in a CANDU Zr-2.5Nb pressure tube, showing oxidized
crack growth bands. The crack initiated at the inside surface just inboard of
the rolled joint . ... 19
Fig. 2.8 Three regions separated by two interfaces in the corrosion area. ... 22
Fig. 2.9 (a) Micrograph of a pre-transition (40hr) sample showing uniform oxide
non-uniform oxide layer . ... 30
Fig. 2.10 Schematic illustration of the process occurring during the oxidation of
Zr-2.5Nb in an aqueous environment. (a) corrosion on α–Zr; (b) boundary
corrosion . ... 33
Fig. 2.11 Refueling on power. ... 43
Fig. 2.12 (a) Typical treatment unit for PEO process (1. window, 2. mixer, 3.
connecting wires, 4. exhaust/ventilation system, 5. grounded case, 6. power
supply unit, 7. work piece, 8. cooling system, 9. bath, 10. insulating plant) and
(b) Electrolyte bath ... 46
Fig. 2.13 Two types of current-voltage diagram for the processes of plasma
electrolysis: discharge phenomena phenomena are developed (a) in the
near-electrode area and (b) in the dielectric film on the electrode surface . ... 47
Fig. 2.14 SEM of the coating formed on Zirlo for 1800s at 10Adm-2. (a) secondary
electron image of the cross-section; (b) backscattered electron image of the
barrier layer region and (c, d) backscattered electron image at increased
magnification of the intermediate and outer layers respectively ... 53
Fig. 2.15 Profiles of nanohardness (H) and elastic modulus (E) across the 240μm
PEO coating on Zr-2.5Nb alloy. ... 56
Fig. 3.1 Schematic diagram showing the sample coupon cutting method. ... 62
unit of surface profilometer and (b) a typical surface profile plot. ... 66
Fig. 3.4 Sliding tester attached on (a) Sciland Pin/Disc Tribometer PCD-300A (b)
load cell and cantilever beam, (c) sample holder for reciprocating mode (d)
sample holder for rotating mode. ... 68
Fig. 3.5 (a) Schematic view of three-electrode cell and (b) Electrochemical
corrosion polarization testing equipment. ... 70
Fig. 3.6 Determination of corrosion current density by extrapolation of linear part of
the polarization curve, icorr—corrosion current density, Ecorr—corrosion
potential. ... 71
Fig. 3.7 Stainless steel (type 304) autoclaves with copper gasket on and steel sample
holder. ... 73
Fig. 3.8 Design of autoclave used for corrosion test. ... 74
Fig. 3.9 Ubi 1TM nano-mechanical testing system and Berkovich tip used in
hardness test. ... 75
Fig. 3.10 Typical Force-Displacement curve in nano-hardness testing: (a) PEO
coating S1 and (b) Zr-2.5Nb substrate. ... 76
Fig. 4.1 SEM micrograph of etched radial-tangential section of Zr-2.5Nb substrate
parallel to axial direction of pressure tubing. ... 77
Fig. 4.2 Voltage vs. time for a 10min PEO treatment on Zr-2.5Nb. ... 79
Fig. 4.4 EDX spectra on melted area (A) and broken surface area (B) of Fig. 4.3(b),
respectively. ... 82
Fig. 4.5 Surface profiles for (a) fresh polished Zr-2.5Nb substrate and (b and c) PEO
coatings made at 0.1A/cm2 for 2min (S2) and 10min. ... 83
Fig. 4.6 Voltage U vs. treatment time t of all six sets of PEO coated samples: (a)
samples of Group A and (b) samples of Group B. ... 86
Fig. 4.7 SEM micrographs on the morphology of (a to f) PEO coatings S1 to S6 and
(g) the black oxide coating. ... 88
Fig. 4.8 Cross-sectional SEM micrographs at different magnifications of the PEO
coatings. (a-f) PEO coatings from S1-S6 and (g) the black oxide coating. ... 89
Fig. 4.9 Surface profiles of (a) PEO coating sample S1 and (b) inner surface of
black oxide coating. ... 91
Fig. 4.10 Surface roughness Ra for thePEO coatings and the black oxide coating. .... 92
Fig. 4.11 EDX spectra for the surface of (a) Zr-2.5Nb substrate, (b) PEO-coated
sample S1 and (c) The black oxide coating. ... 94
Fig. 4.12 XRD spectrum of (a) Zr-2.5Nb substrate (b) black oxide coating and (c)
PEO sample S1. ... 96
Fig. 4.13 Potentiodynamic polarization curves of the uncoated Zr-2.5Nb, PEO
coated sample S1 and black oxide coating. ... 97
Fig. 4.15 SEM micrographs of surface morphology of Zr-2.5Nb substrate after
10-day exposure in autoclave at different magnifications. There are many
blister-like features distributed in lines parallel to the axial direction. ... 103
Fig. 4.16 Surface morphologies of Group A PEO coatings at different exposure
times in autoclave experiment: (a, b) sample S1 at 5 and 30 days exposure; (c)
sample S2 at 30 days exposure and (d and e) sample S3 at 30 days exposure at
different magnifications. ... 105
Fig. 4.17 Surface morphologies of Group A PEO coatings at different exposure time
in autoclave experiment: (a to c) sample S4 at 15 exposure days under
different magnification; (d) sample S5 at 15 exposure days and (e, f) sample
S6 at 15 and 30 exposure days. ... 107
Fig. 4.18 Morphology of the black oxide coating after 30 exposure days in the
autoclave corrosion test. ... 108
Fig. 4.19 Cross-sectional SEM micrographs distribute the thickness of oxide on
PEO-coated samples after 30 days exposure: (a) sample S1 with PEO coating
remained and (b) sample S4 without PEO coating remained. ... 109
Fig. 4.20 Photos showing the spalled-off oxide from PEO coated samples of Group
B after 30-day autoclave treatment. ... 110
Fig. 4.21 XRD patterns on (a) PEO coating S1 and (b) spalled-off powder after 30
exposure in the autoclave experiment. ... 115
Fig. 4.23 Transverse roughness on the wear trace of (a) Zr-2.5Nb substrate and (b)
PEO coated sample S4 under 2N load, dry air, rotating mode with 50m and
1000m sliding distances respectively. ... 118
Fig. 4.24 Rotating wear trace on different PEO coatings and substrate: (a, b) S1,
1000m, before autoclaved; (c, d) S1 1000m, 5 and 10 days in autoclave; (e, f)
S4, 1000m, 10 days in autoclave; (g) S4, 50m, 30 days in autoclave and (h, i)
Zr-2.5Nb substrate 50m, 5 days in autoclave. ... 121
Fig. 4.25 SEM showing wear traces of (a) PEO sample S1, (b) the black oxide
Chapter 1: INTRODUCTION
1.1 Motivation
Canada’s leading role and eminent accomplishments in nuclear development now
span more than half a century. The structural material used in the core section of atomic
reactors, as well as the fuel-element cladding, should absorb as few thermal neutrons as
possible. Zirconium has satisfactory nuclear and physical characteristics and good
mechanical properties at room and elevated temperatures. It also has good corrosion
resistance in most coolants used in nuclear reactors and it can be readily shaped.
In the CANDU-PHW nuclear reactors, Zr-2.5Nb is currently used for the
manufacture of pressure tubes because of its low cross sectional neutron absorption, high
corrosion resistance, high strength and creep resistance. The Zr-2.5Nb CANDU pressure
tubes are heated for 24hr at 400°C in an autoclave to form a black adherent oxide film of
~1 to 2 μm in thickness was produced [1] This thin black oxide film has corrosion
protective properties. However, this black oxide could be damaged during the regular
refueling process, thus causing hydrogen/oxygen ingression. There is thus the need for a
more wear resistant coating that also has improved corrosion resistance.
The surface reaction between the zirconium tubing and the coolant water in nuclear
reactors leads to the oxidation of the tubing and the release of hydrogen. The pick-up of
This embrittlement is manifest as reduced ductility and crack growth resistance which
can shorten the useful lifetime. Therefore, there is a great incentive to minimize the
amount of oxidation and hydriding that zirconium alloys experience in reactor. Since the
oxide film formed on the surface of zirconium alloys can act as a barrier against
hydrogen permeation and further oxidation, the corrosion behavior and the useful lifetime
of the zirconium tubes are closely related to properties of the oxide film.
Electrolytic plasma processing (EPP) is a plasma-assisted electrochemical treatment
that is both cost-effective and environmentally friendly. This versatile technique can be
widely used in metal surface cleaning, metal-coating, carburizing, nitriding, and
oxidizing. When EPP is an anodic oxidizing process, it is called plasma electrolytic
oxidation (PEO). The technique is basically the anodic polarization of a metal in an
aqueous electrolyte except that a much higher voltage is used. A number of studies have
examined in the coating formation mechanisms and characteristics of the coating
deposited on the metals like Aluminum, Magnesium and Titanium [2-8]. There have been
very few studies on zirconium alloys such as Zr-2.5Nb [9, 10].
In this study, Zr-2.5Nb was used as anode in the PEO process and oxidized in a
silicate solution. A complex Zr-Si-O ceramic coating with a high adhesion, hardness, and
uniform thickness was made on the substrate material. Different parameters (current
density, treatment time and concentration of electrolyte) were used during PEO process.
About 5 to 6 μm thick coatings were produced in a very short treatment time (<4min).
produced commercially. Long PEO treatment times gave thick coatings which would
adversely affect heat transfer in reactor. Therefore, a DC power source was used in this
study to produce a thinner oxide film.
1.2 Objectives and contents of this study
The objectives of this study were to:
1. Deposit protective silicate coatings on Zr-2.5Nb alloy in Na2SiO3 and KOH
electrolyte with different concentration ratios and current densities.
2. Characterize the corrosion behavior of different types of PEO coatings and
compare with black oxide coating, at both ambient and high temperature and pressure
conditions were used.
3. Optimize the PEO process parameters for Zr-2.5Nb in the coating
production, based on the observed corrosion and wear behavior.
1.3 Organization of the thesis
This thesis contains seven chapters. Chapter 1 gives introductory information on the
usage of Zr-2.5Nb in nuclear industry applications and the need for improved corrosion
and wear resistance, and outlines the study plan.
Chapter 2, which is the Literature Review, summarizes the usage of pressure tubes in
time, high temperature/pressure and radioactive service conditions, the corrosion
resistance properties have assumed significant importance. Furthermore, sliding wear
problems resulting from online refueling are a not-insignificant accelerate corrosion.
Chapter2 also describes the evolution of the Plasma Electrolytic Oxidation (PEO) process
and its applications to light metals such as Al, Mg Ti and Zr.
In Chapter 3, the experimental procedures and instrumentation are described. The
results and analysis are given in Chapter 4. Chapter 5 gives the conclusions from the
Chapter 2: LITERATURE REVIEW
2.1 Introduction to the CANDU nuclear reactor
In Canada, nuclear energy has been utilized for over sixty years in many fields for
peaceful purposes: electricity generation, medicine, agriculture, research and
manufacturing. The CANDU-PHW (Canadian Deuterium Uranium-pressurized Heavy
Water) reactors, which are the current nuclear energy generator, supply 53% of the
electricity used in Ontario, 6.1% in New Brunswick, and around 3.0% in Quebec in 2008.
The CANDU nuclear power reactor has been operated safely for 50 years.
There were 436 operable nuclear power reactors in 30 countries on April 1, 2009 and
there were 44 nuclear reactors under construction, another 108 being planned and 272
Fig. 2.1 CANDU basic lattice cell for 37-element fuel [12].
The CANDU type reactor was first designed and constructed in Canada. As shown in
Fig. 2.1, a CANDU 6 fuel bundle consists of 37 elements, which are arranged in circular
rings, and each element consists of sintered natural uranium dioxide (UO2) cylindrical
pellets, which are contained in a Zircaloy-4 sheath closed at each end by an end cap. The
fuel elements in a bundle are held together by end plates at each end with spacers
providing the necessary separation between the elements. Bearing pads on the outer
elements of the fuel bundle provide the necessary separation between the outer elements
and a pressure tube. Each pressure tube in a CANDU 6 (Fig 2.2) contains 12 fuel bundles
a low-pressure cool moderator by a gas annulus formed between the pressure tube and the
calandria tube surrounding it. The calandria tube contains D2O moderator at 70°C, and is
penetrated by 380 horizontal fuel channels each six meters long. Each channel consists of
a pressure tube containing fuel and coolant D2O at a temperature ranging from 250-270°
C at the inlet to 290-310°C at the outlet. The inlet pressure is about 10.5MPa and the
outlet pressure is about 9.9MPa, resulting in an initial axial stress in the pressure tube
wall of about 65MPa and an initial hoop stress that varies from about 130MPa at the inlet
to about 122MPa at the outlet. The coolant pH is maintained in the specified range 10.3
as a result of the addition of LiOH, and the recommended range for dissolved deuterium
is 3 to 10 cm3 D2/kg deuterium oxide (D2O). Two end-fittings at each end of the fuel
channel incorporate a feeder connection through which pressurized heavy water coolant
enters and leaves the fuel channel. The feeders are connected to the reactor inlet and
outlet headers. A CANDU 6 has two independent loops, containing 190 fuel channels in
each loop and four steam generators with two in each of the loops. The fission heat
produced in the fuel is transferred to the light water in the secondary side of the steam
generators to produce steam, which drives the turbine generators to produce electricity
[13, 14].
The safety of the CANDU pressure tube is based on the “leak-before-break” criterion
[15]; namely, the critical crack length is sufficiently large that coolant leakage will be
detected before the crack grows to the critical unstable length.
transverse view of the fuel bundles, respectively.
(a)
(b)
(c)
Fig. 2.2 CANDU-PHW reactor core, the fuel bundle and how a fuel bundle settled inside
2.2 Development of pressure tubes in CANDU nuclear reactor
The pressure tube, which was first manufactured in 1957, is a major component of
the CANDU reactor, which supports the nuclear fuel bundles and heavy water coolant.
Early CANDU reactors—Nuclear Power Demonstration (NPD) Douglas Point, and
Pickering 1 and 2—used Zircaloy-2. The Zr-2.5Nb alloy was selected for Pickering 3 and
4 because it had a better in-reactor creep resistance and its higher strength permitted the
use of a thinner wall tube with a resultant advantage in neutron economy over Zircaloy-2.
Zr-2.5Nb has been used in all subsequent CANDU reactors [17].
Zriconium-based alloys are commonly used to manufacture nuclear reactor
components since they have a low neutron absorption cross section, high strength and
high corrosion resistance under operating conditions [18]. It was initially thought that the
poor corrosion resistance of some batches of unalloyed zirconium produced by the van
Arkel process was a result of stray impurities. However, it was found that improving the
purity did not eliminate these problems.
During the initial years of exposure to the reactor environment, the zirconium alloys
exhibit a rather constant and low rate of corrosion and hydrogen uptake [1]. Fig. 2.3 (a)
shows that Zircaloy-2 tubes start to corrode at a faster rate after a period of about five
effective full power years, as evidenced by the rate of change of oxide thickness on the
tubes and amount of deuterium in the tubes. Data measured in Wolsong-1—one of the
hydrogen/deuterium-pick-up rate than for Zircaloy-2 (Fig. 2.3 (b)).It has been proposed
that when the oxide is thin, D2 in the coolant can penetrate the oxide to suppress the
oxidizing species formed in the oxide pores by radiolysis. This suppression cannot occur
when the oxide reaches a critical thickness of 15-20µm (larger than the deuterium
penetration range), resulting in an increase in the oxidizing power of the electrolyte in the
pores and an increase in the rate of corrosion. One criticism of this explanation for
increased corrosion rates with time is that after a certain oxide thickness is reached and a
porous oxide layer (post-transition oxide) forms, deuterium is plentiful and present at the
bottom of all pores, provided less than 100% of the deuterium evolved during the
cathodic reaction is absorbed by the metal. Whatever the explanation of this acceleration
in Zircaloys, Zr-2.5Nb tubes do not exhibit this phenomenon to the same extent. Also, the
second phase particles present in Zircaloys, but not in Zr-2.5Nb, have been blamed for
this acceleration of attack because they apparently act as preferred sites for deuterium
evolution and pickup. As a result, the Zircaloy-2 pressure tubes in CANDU reactors have
(a)
(b)
Fig. 2.3 (a) The corrosion and hydrogen increase in Zircaloy-2 pressure tubes after
reactor service and (b) Deuterium concentration in Zircaloy-2 and Zr-2.5Nb pressure
It is very important to note, however, that the reason that the pressure tube concept
was viable is the use of zirconium and its alloys. In the pressure-tube design, there is a
large mass of metal inside the reactor, which could absorb a significant amount of
neutrons. This would definitely be the case with steel pressure tubes–the fission chain
reaction could not be made self-sustaining, on account of the large neutron absorption by
the steel. Fortunately, zirconium, which is a “magic” nuclide with a very low
neutron-absorption cross section, came on the scene in time for application in NPD.
Incidentally, this “coming to the fore” of zirconium was as the result of materials research
in Chalk River for the US nuclear program [12].
2.3 Fabrication of pressure tubes in the nuclear plant
The production route for Zr-2.5Nb pressure tube is a multi-step process involving
forging of the ingot, machining of hollow billets, extrusion and cold drawing. Fig. 2.4 is
an abridged flow diagram showing the main steps in the fabrication of Zr-2.5Nb pressure
tubes. By autoclaving at 400°C for 24hr, a protective oxide layer is formed on the both
Fig. 2.4 Abridged flow chart for the fabrication of CANDU Zr-2.5Nb pressure tubes [20].
The tubes are fabricated by hot-working ingots in (α+β)-phase region. These ingots
are machined to produce hollow billets that are approximately 560mm long × 195mm
diameter suitable for extrusion. After water-quenching from the β-phase the hollow billets
6.3 m with a final thickness of about 4.3mm and an inside diameter of about 104 mm.
The tubes are stress-relieved at 400°C for 24hr prior to installation in a CANDU reactor
[21]. The microstructure consists of elongated grains of hexagonal-close-packed (hcp)
α-Zr, partially surrounded by a thin network of filaments of body-centered-cubic (bcc)
β-Zr. The alpha-phase grains are platelets (containing about 0.6 to 1 wt% Nb in solution)
with aspect ratios of about 1, 10, and 40 in the radial, transverse and longitudinal
directions, respectively. A typical microstructure is illustrated in Fig. 2.5.
Fig. 2.5 Typical grain structure in Zr-2.5Nb pressure tubing looking down the axis of the
tube. The light colored α-phase platelets are interspersed with dark-colored β-phase
filaments [22].
From the Fig. 2.5, we can clearly see that the α-grains are stacked together and are
separated by a non-equilibrium β-phase containing about 20 wt% Nb: see Fig.2.6 for the
Zr-Nb binary phase diagram. As can be seen in Fig. 2.6, the solubility limit for Nb in α-
phase, having the bcc β-Zr structure with the Nb being in solution. On slow (equilibrium)
cooling to room temperature, a two phase, α- Zr and β-Nb, structure is produced. The α-
Zr phase is hcp with the Nb being in solution. The β-Nb phase is bcc structure containing
~85wt%Nb. The width of the β-phase in the radial direction is about one-tenth that of the
α-phase. The width of the α-phase is typically about 0.3 μm. This microstructure greatly
affects the growth of oxide on its surface.
Operation temperature
Fig. 2.6 Schematic Zr-Nb binary phase diagram [23].
The correlation between the microstructure of pressure tubes and the corrosion
behavior has been studied in detail by many researchers [24-26]. It was believed that a
full understanding of the corrosion mechanism of zirconium alloys requires an in-depth
complex interactions of parameters in the process of the growth of oxide film make it
difficult to predict corrosion behavior of zirconium alloys. The studies focusing on the
microstructures of the oxide film and their relations to the corrosion often lead to results
that seem to contradict each other [27-34].For example, it is generally accepted that high
compressive stress near the oxide/metal interface may produce a high tetragonal phase
fraction in the oxide film, but very recent studies show that there seems to be no obvious
correlation between the compressive stress and the tetragonal phase fraction [27, 28].
Some authors observed that zirconium alloys with a high tetragonal oxide fraction near
the interface exhibit a higher corrosion rate, whereas in other papers completely different
results have been reported [27, 29-31]. Yilmazbayhan et al. [29], Bossis et al. [32] and
Bechade et al. [33] found higher percentages of tetragonal oxide in Zircaloy-4 than in
Zr–1% Nb, whereas Vrtilkova et al. reported a high value of the tetragonal phase fraction
in Zr–1% Nb but very low value in Zircaloy-4 [34]. Despite numerous studies undertaken
by different authors, many questions still remain open. To date, it has been difficult to
predict the corrosion behavior of zirconium alloys as there is no unified or overall model
that may clarify the intrinsic factors affecting the microstructural aspects of the ZrO2
2.4 In-reactor deformation of pressure tubes in CANDU reactor
2.4.1 Life-limiting factors for a pressure tube
The service life of a pressure tube is determined by the allowable dimensional
changes, by its capability to accommodte dimensional changes, by its capability to resist
crack initiation and, as defence in depth, by its ability to meet a leak before break
criterion developed for the tubes. Four factors are important in the pressure tube’s
degradation (aging) during service [14, 21]:
(i) Dimensional changes,
(ii) Corrosion and hydrogen ingress,
(iii) Changes in mechanical properties,
(iv) Flaw development.
2.4.2 Methods to reduce the degradation during service
In this case, methods for improving the pressure tube performance can be divided
into the following five categories [35]:
(v) minimizing the variation of the pressure tube’s dimension (diameter, length),
(vi) decreasing the defects at which DHC(delayed hydride cracking) can be
initiated,
(vii) increasing the fracture toughness of the pressure tube,
(ix) minimizing hydrogen uptake.
Localized oxidation caused some small regions (most of which, are grain boundaries)
exhibit a much higher corrosion rate. After a certain period of corrosion, especially in
high temperature/pressure condition, the initiation of small cracks could be the origins of
disastrous ‘break-away’ of the corrosion rate.
Whether serendipitously or not, this problem was solved by the addition of transition
metals (Cr, Fe, Ni), that were largely insoluble in the zirconium matrix and appeared as
small particles of intermetallic phases, and tin which was soluble in zirconium and which
nullified the negative effects of the nitrogen impurity present in the Kroll process
zirconium [36].
Dimensional changes are controlled by thermal and irradiation creep and by
irradiation growth. These phenomena cause diametric and length increases in the tube and
pressure tube sag. To reduce dimensional variation, to minimize the defect and to increase
the fracture toughness, manufacturing processes should be modified. Corrosion leading to
metal loss on the inside of the tubes is a result of contact of the metal with the hot,
pressurized heavy water. Furthermore, the gradual build-up of deuterium in the tubes as a
result of corrosion, combined with the possibility of the generation of flaws of sufficient
depth, makes the tubes susceptible to the initiation of delayed hydride cracking (DHC).
The hydrogen and deuterium uptakes and the concomitant DHC are the most important
factors in the lifetime of a pressure tube. Fig.2.7 gives an example of a failed pressure
Fig. 2.7 Though-wall crack in a CANDU Zr-2.5Nb pressure tube, showing oxidized crack
growth bands. The crack initiated at the inside surface just inboard of the rolled joint [37].
To prevent DHC, hydride formation should be avoided. Since the solubility limit of
hydrogen in zirconium is low, hydrogen concentration in the pressure tube must be
lowered in order not to form hydride. Hydrogen is partially absorbed during pressure tube
manufacturing process but most of it is picked up during operation (see Fig. 2.3)[1, 38,
39]. To prevent ingress of hydrogen into the pressure tube during operation, several
methods have been studied such as forming a black oxide layer about 1μm thick by
autoclaving for 24hr at 400°C before installation, changing the microstructure of the
pressure tube surface using laser or shot peening, adding some elements such as Fe, V
and Cr which are known to have beneficial effects in reducing hydrogen uptake, and
coating a thin stress-free zirconium oxide layer on the pressure tube. Among these
methods, the ZrO2 coating technologies are preferred since an oxide layer grown by this
method contains very few cracks.
pressure tubes and thus are a function of the manufacturing process and operating
conditions (radiation damage). Northwood and Kosasih [40] summarized the problems of
the pressure tube performance in reactor as follows: “Obviously any change in the
mechanical processing route to enhance dimensional stability will also change the
microstructure which will in turn affect other properties in addition to irradiation growth
and irradiation creep. One property that would change is the corrosion resistance and the
associated problem of hydriding. During reactor operations there is a corrosion reaction
between the zirconium alloy pressure tube and the heavy water moderator/coolant. As a
result of this corrosion reaction there is a release of hydrogen (deuterium) and this can be
“taken up” by the pressure tube material. Hydrogen pick-up above a certain level will
give rise to solid hydrides at reactor operating temperatures. These hydrides are subject to
brittle fracture, particularly when the reactor is shut-down (cooled down).”
In the research study forming the basis of this thesis, the corrosion behavior is one of
the key points of concern.
2.5 Corrosion characteristics of zirconium and its alloys
The elevated-temperature aqueous corrosion and associated deuterium uptake of
Zirconium alloy nuclear reactor pressure tubes have been studied for over 50 years [11,
41]. Zircaloy tubes exhibited rapid deuterium ingress after a period of in-reactor exposure,
and have been replaced with tubes fabricated from the more resistant Zr-2.5Nb alloy.
indicate that the material has quite good corrosion resistance.
During the initial period of oxidation, the surface of the metal is covered by a thin
black protective film which adheres well. During this period, the rate of oxidation can be
represented by a curve that approaches parabolic, cubic or logarithmic form. When the
thickness of the oxide film reaches a certain limit, there is an abrupt change in the
corrosion resistance. In a relatively short time, the oxide film changes its color to gray or
white and becomes friable, and spalling occurs. The oxidation rate increases and
conforms to an almost linear law.
Because of the shape of the curve, the change in corrosion resistance is often called
“breakaway” or “transition” and the moment at which the change occurs is called the
“breakaway point” or “transition point”.
The exact moment of transition during the corrosion of Zr-2.5Nb and other
zirconium alloys depends on a number of different factors, which are often difficult to
predict quantitatively. This phenomenon is characteristic of zirconium and its alloys, and
limits the life of the metal. In the nuclear industry, the pressure tubes in CANDU reactors
have been operating for times up to about 25 years.
The basic reaction of the zirconium alloy with the corrosive medium, H2O (D2O),
can be represented by the following equation [40, 42]:
Zr+2H2OÆZrO2+2H2 (2.1)
However, the basic mechanisms are much more complex and three regions should be
Fig.2.8:
H2O
______________________ Interface II
Oxide (ZrO2)
______________________ Interface I
Metal (Zr)
Fig. 2.8 Three regions separated by two interfaces in the corrosion area.
The growth of the oxide layer is considered to involve the diffusion of oxygen ions
and anionic vacancies (oxygen ions missing from lattice which carry an effective charge
of 2+ and are represented by the symbol □2+). The reaction of note at the interface II, the
interface between the corrosive medium and the oxide can be represented by the
equation:
□2++2e-+H2OÆO2+2H+ (2.2)
This reaction leads to the formation of hydrogen ions (protons) and oxygen ions. The
oxygen ions diffuse in and react with the metal (Zr) at interface I to form oxide, electrons,
and anionic vacancies as shown by the following equation
Zr+2O2-ÆZrO2+2□2++8e- (2.3)
These electrons and anionic vacancies diffuse out to continue the corrosion process.
It is to be noted that for zirconium that the oxidation proceeds by the diffusion of oxygen
ions into the oxide and not by diffusion of the metal out through the oxide. It is the
aqueous solution such as LiOH rather than pure water changes the corrosion
characteristics and reactions only through its effect on the nature of the oxide film. With
Li ions being incorporated into the ZrO2 film there is an increase in the number of anionic
vacancies which gives rise to faster rates of diffusion for the oxygen ions and hence a
higher rate of corrosion [40].
The ZrO2 film formed on the pressure tube surface serves as a protective layer to
limit further oxidation. While most of the ‘corrosion-generated’ deuterium combines to
form D2 and is released into the coolant, a small fraction (2-10%) is absorbed by the
underlying metal substrate. Over time, the deuterium concentration increases, and high
levels of deuterium in the pressure tube can have negative effects on its mechanical
properties, e.g., reduced fracture toughness. If the deuterium concentration exceeds the
terminal solid solubility in the zirconium alloy, brittle hydrides (deuterides) can
precipitate and cause problems related to delayed hydride cracking (DHC) and hydrogen
blister susceptibility.
2.5.1 The kinetics of the oxidation of corrosion of zirconium and its alloys
As mentioned in section 2.5, the growth of the zirconium oxide is controlled by
inward oxygen diffusion through the oxide thin film, so that the thicker the oxide film,
the more difficult the oxygen diffusion is. Therefore, the thickness of the oxide layer
plays an important role in the control of the oxidation kinetics. Moreover, the existence of
Pure zirconium has quite good corrosion resistance. The presence of impurities and
alloying elements, the addition of which is necessary to increase the strength, leads to a
reduction in the corrosion resistance. The kinetics of the reaction of zirconium with water
or steam is generally characterized by two periods [43]: During the first period, an
adhering protective oxide film is formed. This film is either black or an iridescent color.
The weight gain of the specimen is governed by the laws applying to metals that form a
protective layer of corrosion products. After a certain time, the second period begins. The
corrosion rate sharply increases, and in place of the black protective film, the metal
becomes covered with a white or light grey, friable, spalling oxide. During the second
period, the corrosion rate of zirconium is usually very high, and rapid failure of the metal
occurs. The characteristic change in the oxidation rate of zirconium and its alloys is often
called ‘transition’ or ‘breakaway’. The duration of these two periods can change,
depending on the conditions under which oxidation occurs (temperature, pressure, time,
etc.).
The steady corrosion of zirconium during the first period may be represented by the
equation:
Δm=ktn (2.4)
or in logarithmic coordinates
lgΔm=k+nlgt,, (2.5)
where Δm is the weight gain of zirconium due to the formation of the oxide film, after a
2.5.1.1 Pretransition period
The oxidation curve of zirconium and its alloys in water or steam for the
pretransition period can be divided into two stages.
For a relatively short time, the surface of the zirconium is actively oxidized and
covered by a protective oxide film. As the thickness of the film and its protective property
increase, the oxidation slows down and becomes a constant rate. The minimum thickness
of the oxide film necessary to protect the metal, and at which the corrosion rate becomes
stable, is dependent on a number of factors including: temperature, pressure, nature of the
corrosive medium, and the chemical composition and structure of the alloy.
After an oxide film of a certain minimum thickness has formed, the corrosion
process stabilizes, and, up to the transition point, it can be represented in logarithmic
coordinates by a straight line. The exponent n then determines the oxidation rate and the
growth of oxide film.
Values of the constants of the equation of the kinetics of oxidation, characterizing the
behavior of zirconium and Zr-2.5Nb in water and steam at various temperatures are given
in Table 2.1. An exponent n=0.3 characterizes a cubic oxidation rate law; n=0.5
characterizes a parabolic and n=1 a linear law [36, 43]. Table 2.1 shows that Zr-2.5Nb
will corrode under a relative low rate—parabolic corrosion law when using pure water as
Table 2.1 Constants of the kinetics of the oxidation of zirconium and Zr-2.5Nb [43].
Alloy
Test conditions
Equation constants
Δm=ktn
medium
Temperature
°C
Pressure, atm k n
Iodide
zirconium
Water 350 168 0.5 0.3
steam 400 300 0.7 0.38
Zr-2.5Nb water
300 88 0.2 0.47
350 168 0.22 0.62
2.5.1.2 The transition
In general it is not possible to grow oxide films on zirconium alloys that are thicker
than 2 μm without a change in the kinetics to either an approximately linear or a cyclic
kinetic stage (post-transition) that is considered to indicate the development of some sort
of porosity in the previously protective oxide [36]. As already mentioned, the corrosion
of zirconium and its alloys is characterized by high corrosion resistance during the first
period of oxidation, followed by an increase in the corrosion rate, without change of the
external factors. This phenomenon reduces the life of zirconium alloys, and introduces an
element of uncertainty into choosing alloys for given applications. Since the zirconium
investigations. The time at which transition takes place depends on the combined effect
of different factors. The most important factors are temperature and alloying elements.
(i) Temperature. The higher the temperature, the earlier and clearer is the transition
point on the oxidation curve.
(ii) Alloy elements. Alloying zirconium may modify its corrosion resistance
considerably. The principal purpose of alloying is to increase the protective properties of
the oxide film, and increase the time to transition. The results obtained from tests in
steam at 650°C of several zirconium alloys are given in Table 2.2. From Table 2.2, we
can find that Zr-2.5Nb has an insufficient corrosion resistance property at high
temperature: However, we are not using Zr-2.5Nb at temperatures as high as 650°C
Table 2.2 Corrosion tests on zirconium alloys in steam at 650°C [43].
Alloy Time to
transition, hr
Weight gain
mg/dm2
Corrosion rate after transition,
mg/(dm2·day)
Zircaloy-2 4 100 30
Zr-1%Nb 20 200 17
Zr-2.5%Nb 5 110 18
Zr-2.5%Nb-0.5%Sn 2 100 40
Zr-1.0%Cu-1.5%Mo 360 400 20
Zr-0.5%Cu 300 400 16
Zr-0.5%Cu-0.5%Mo 700 700 /
or H2O to the metal surface is formed. Some amount of the t-ZrO2, which is still present
in the dense layer before the transition occurs, transforms to m-ZrO2. This was explained
by Beie et al.[44] as being due to two reasons: first, the tetragonal phase within the dense
layer may be stabilized by the large compressive stress that is relieved at the transition.
The second reason may be the increased concentration of hydrogen that favors the m-
ZrO2.
Transition is a complex process, being dependent on the combined effect of many
factors. To determine the suitability of a zirconium alloy for service, prolonged corrosion
field tests must be carried out, since the extrapolation of short-time tests is unreliable and
often unacceptable, because of the possibility of breakaway taking place. In order to
study and simulate the long-term corrosion/hydriding behavior of the pressure tubes in
reactor, there is a method which has been proven to be suitable and is accepted and used
by many researchers in this field, that is the autoclave test [40]. In this test, pressure tube
material is put in pressurized lithium hydroxide solution at 300°C. The purpose of this
investigation is to study the effect of various thermo-mechanical processing schedules on
the corrosion/hydriding behavior as exhibited in these accelerated corrosion tests in
pressurized lithium hydroxide solution. In this thesis, this method is also used to study the
corrosion behavior of PEO-coated Zr-2.5Nb samples and black oxide-coated samples
under high temperature and pressure. A high concentration of lithium hydroxide was used
to shorten the experimental time. However, due to the limitations of laboratory
research.
2.5.1.3 Post-transition period
The post-transition period in the oxidation of zirconium commences when a white or
grey spalling oxide is formed on the surface. This period is characterized by rapid
oxidation and failure of material. The oxidation rate during this period is determined only
by the rate of ingress of oxygen to the surface of the metal, and by the thermodynamic
conditions applying to the reaction between zirconium and oxygen. For zirconium and
most of its alloys, the oxidation rate during the post-transition period follows a linear or
near-linear law. It was believed that the transition limits the service life of pressure tube,
and that after transition has occurred the metal is unserviceable. The formation of a
porous oxide film leads to rapid continuous corrosion, to failure of the metal part, and to
contamination of reactor coolant with oxidation products and fuel.
After the transition point, the corrosion kinetics, the oxide morphology and
oxide/metal interface topography of the corroded samples show great differences to those
in the pre-transition period. Ding and Northwood [45] comprehensively compared by
SEM oxide/metal interface of Zr-2.5Nb alloy formed in aqueous corrosion medium
before and after transition. Groups of Zr-2.5Nb coupons were corroded in a pressurized
solution of 4.8g LiOH per liter deionzied water at 300°C. After study of the weight gain
vs. exposure time curve, the transition point was found to be taken place after about 80hr
to remove metal close to the oxide/metal interface and finally examined using SEM from
different directions. Fig. 2.9 (a) and (b) show the SEM micrographs taken from the axial
direction of a pressure tube.
(a)
(b)
Fig. 2.9 (a) Micrograph of a pre-transition (40hr) sample showing uniform oxide layer
and (b) Micrograph of a post-transition (480hr) sample showing a non-uniform oxide
layer [45].
From Fig 2.9, it can be seen that a uniform thick of oxide layer was formed on the
pre-transition sample and that the oxide layer which formed on the post-transition sample
was not uniform. This was explained by the fact that there were different corrosion rates
2.5.2 The Phase-Transformation theory and failure of oxide film
There are three different phase structures of zirconium dioxide which exist in
different temperature ranges from room temperature to over 1300°C. They are the
monoclinic phase, the tetragonal phase and the cubic phase [43].
Some research [24-26] have been carried out in order to gain an insight into the
formation and growth of the oxide layer. These researchers emphasize the importance of
the microstructure and composition of oxide film and attempt to relate corrosion
resistance to the presence of the tetragonal zirconium oxide phase in the oxide layer.
On the basis of electron-diffraction analysis and kinetic investigations, Korobkov et
al. [43] have developed a theory to describe the dependence of the corrosion resistance of
zirconium on the phase transformations taking place in the oxide film. The authors
investigated the oxidation of thin (300-400 Å) foils of zirconium and zirconium alloys,
which had been prepared by evaporation and condensation in a high vacuum
(approximately 10-7 mmHg). It was found that thin zirconium foils heated in air at
temperatures in the range of 270-650°C were fully oxidized. The oxide had a cubic
structure with a lattice constant a=5.09Å. Increasing the temperature from 650 to 750°C
led to the formation of a tetragonal zirconium oxide, with the following lattice constants:
a=5.07Å, c=5.16Å, c:a=1.02. An increase in the temperature of oxidation from 750 to
1,100°C led to the formation of a mixture of tetragonal an monoclinic forms, while at
formed. The lattice constants of the monoclinic ZrO2 were: a=5.17Å, b=5.26Å, c=530Å
and β=80°48´. They further found that the transformation from the tetragonal to
monoclinic form was dependent on temperature and heating time, and that it took place at
a certain thickness of the oxide film, which they called the critical thickness.
Investigations based on Raman spectroscopy and transmission electron microscopy
(TEM) confirmed that there are two phases (monoclinic(m) and tetragonal (t) phase) in
ZrO2 film formed on zirconium alloys, and the distribution of tetragonal phases in ZrO2
film is not uniform. The percentage of tetragonal phase is much higher near the
oxide/metal interface than that in the outer oxide layer [18, 41, 46-49]. Electron
diffraction patterns and kinetic data showed the conclusion that the acceleration of the
oxidation of zirconium is caused by the transformation of tetragonal zirconium dioxide to
a monoclinic structure. This view of the mechanism of failure of the oxide film has been
confirmed by number of other investigations.
Ding and Northwood [45] have presented another model to explain the corrosion
process on Zr-2.5Nb. In the early stages, the oxide is mainly formed from the grain
boundary phases, i.e., β-Zr and its decomposition products. The oxide formed from grain
boundary phases may be not dense enough to act as a barrier layer, especially the upper
oxide layer. Oxidation of the α-Zr grains may form a dense protective oxide barrier—this
oxide is predominantly t- ZrO2. With the progress of corrosion, all the t- ZrO2
transformed into monoclinic phase and formed a porous oxide outer layer and only the
Fig. 2.10 is. schematic illustration of the process occurring during the oxidation of
Zr-2.5Nb in an aqueous environment (left) corrosion on α-Zr; (right) boundary corrosion.
Fig. 2.10 Schematic illustration of the process occurring during the oxidation of Zr-2.5Nb
in an aqueous environment. (a) corrosion on α–Zr; (b) boundary corrosion [45].
Cox [36] is also of the same opinion that the failure of the zirconium oxide film may
be due to phase transformations. He thought that the cracking of zirconium oxide may be
the result of a tetragonal or cubic to a monoclinic form of the oxide, this involving a
volume change. The centers of this transformation may be inclusions in the metal,
including particles which have been converted to hydrides.
Numerous X-ray investigations have shown that in the first stages of oxidation only,
it is sometimes possible to identify an oxide with a cubic or tetragonal structure. During
investigation of samples has not shown any distinct dependence of the time to transition
on the phase transformations taking place in the oxide film.
Beie et al. [44] studied the long-time corrosion test using Zircaloy samples. In the
first step of corrosion, substoichiometic ZrO2 was formed. This oxide (which may remain
amorphous for a certain time) crystallized to small equiaxed tetragonal grains. When the
size of these grains reaches some critical value, they transform to the monoclinic
modification. Some amount of t- ZrO2 will survive since it is stabilized for its small
crystallite size by high compressive stress at the metal-oxide interface, or by dissolved
alloying elements, or both. It was also mentioned that a high hydrogen concentration at
the metal-oxide interface facilitates the transformation from the tetragonal to monoclinic
phase. The further oxide formation at the metal-oxide interface leads to a preferential
growth of the monoclinic crystals. If the corrosion is uniform, this process leads to a
dense layer with a columnar structure consisting mainly of monoclinic zirconium dioxide.
But in nodular oxides, equiaxed grains are formed at the metal-oxide interface and no, or
probably only a thin compact layer, exists.
2.5.3 Properties of the oxide film
Zirconium dioxide is an insulator with a large bandgap at 5eV. This oxide has
potential applications in various fields such as protective coatings, dielectric compounds
in metal oxide semiconductor devices and as a high temperature O2- conducting
be obtained by sputtering, pulsed laser deposition, chemical vapor deposition and atomic
layer epitaxy and also by wet methods such as anodization [50, 51].
Analysis of the oxide film has shown that its chemical composition may differ from
the stoichiometric properties. The black protective oxide film shows an oxygen
deficiency, while the white friable oxide film has a chemical composition corresponding
exactly to the formula ZrO2. Bibb and Faschia. [52], who have investigated the
deformation of the crystal lattice of the oxide film by considering the width of the
deformation peaks at their halfheight, have found that in all cases the crystal lattice of the
black oxide is more distorted than that of the white oxide. It is therefore assumed that the
transition from the black oxide to the white, and, correspondingly, the breakaway point
on the oxidation curve, are connected with the recrystallization of the oxide.
Recrystallization and failure will occur if the stresses in the oxide film reach a high value,
as a result of film growth, the presence of inclusions, grain boundaries, or other factors.
This may also be brought about if the distorted oxide film is heated for a sufficiently long
time at a high temperature.
2.6 Methodology for evaluation of of Zr-2.5Nb tubes and deuterium
uptake
Many mechanistic, semi-empirical and empirical models for Zircaloy corrosion have
been presented and critically compared in previous publications. There are few published
Fitness-for-service guidelines have been developed to provide a systematic procedure
for the evaluation of pressure tubes. The rationale is that a low probability of pressure
tube rupture must be assured. Procedures have been developed to determine whether
tubes containing detected or postulated flaws are susceptible to crack initiation. As
defence in depth, tubes with detected flaws that are not susceptible to crack initiation
must also satisfy a leak-before-break (LBB) criterion [14].
For the evaluation of generic changes in fracture properties a flaw is postulated that
corresponds to the smallest part-through crack just prior to through-wall penetration. This
flaw is examined for the possibility of unstable propagation based on the material fracture
properties and hydrogen plus deuterium concentration prevailing at the time. When
hydrides and deuterides are present at nominal operating, ful-power conditions, the
postulated flaw is also examined to determine whether it has adequate resistance to DHC.
To assure LBB in pressure tubes, the crack length when the leaking crack is detected
must be less than the critical crack length (CCL) for unstable propagation and the reactor
must be shut down before the crack length exceeds the CCL. The response time t,
assuming that double-ended crack growth is one of the scenarios, is given by
DHCV leakCL CCL × − = 2
t (2.6)
Where ‘leak CL’ is the crack length at first detected wall penetration and DHCV is
the axial DHC velocity of the leaking crack. To demonstrate LBB, the postulated length
of a through-wall flaw growing by DHC must be less than the CCL during the entire
assessment is performed by assuming a length for crack at breakthrough and detection
and specifying the subsequent reactor shutdown sequence employed. This means taking
account of the variation in DHC velocity and CCL as the coolant temperature and
pressure in the tubes are reduced. It is evient that to assure LBB up to the design life of
the pressure tube, the changes with time of the parameters in Eq. (2.6) need to be known.
Based on Cox’s [35] model, the zirconium oxide layer is treated as a bilayer with an
inner protective barrier and an outer porous nonprotective layer. It is assumed that the
rate of corrosion depends solely on transport across the dense barrier layer. The point
defect model of oxide film growth of Macdonald [54] has been used to describe this
phenomenon. The transformation of the barrier layer into a nonprotective porous layer at
the outer side of the barrier layer ultimately controls the reaction, because the thickness
of the barrier layer is dependent on this transformation. Similar work has been reported
by Macdonald on oxide films in which the steady-state growth and dissolution of the
barrier layer was studied. Work done by Pensado-Rodriguez et al. [55] on Li oxides in
alkaline solutions has clearly shown that at steady state, the cathodic reaction in the
system, i.e. hydrogen evolution, is proportional to the porosity of the outer layer and that
porosity is needed to maintain water transport to allow the cathodic process to occur. In
Zr-2.5 Nb, the exact mechanism for the transformation of a dense barrier layer to a
nonprotective porous layer is not understood but is critical to the entire corrosion
reaction.
dissolution of the zirconium oxide. Zirconia will dissolve chemically to form zirconate if
the pH is high enough.
The oxides at the oxide-metal interface formed in an aqueous environment are
mainly extended along grain boundaries, and are characterized by long to short-circuit
diffusion at the grain boundaries which is caused by the nature of the crystallite
boundaries of the oxide, the flaws arising from the oxidation of the grain boundary
phases (β-Zr, its decomposition products as well as impurities), and cracking of the oxide
due to phase transformations in ZrO2.
2.7 The effects of Lithium on the corrosion behavior of zirconium alloys
LiOH is added to the primary coolant of most PWR’s to maintain an alkaline pH so
as to control the transport of corrosion products from the structural materials of the
reactor coolant system. Bulk concentrations of lithium in the coolant typically range from
0.2 to 2 ppm (3×10⁻⁵ to 3×10⁻⁴ molal LiOH). Lithium can adversely affect the corrosion
of zirconium alloys and, in this regard, corrosion of Zr-2.5Nb is more sensitive than the
Zircaloys to Li+ ion content. The evidence for this so called “lithium effect” is from
laboratory tests. With increase in lithium hydroxide concentration, >50 to 100 ppm Li, the
corrosion rate is seen to increase.
Several hypotheses have been proposed to account for this phenomena: (1) An
increase in anion vacancies in the oxide caused by the substitution of zirconium by
dissolution of t-ZrO2 in zirconia films exposed in more than 0.1M LiOH aqueous solution
[57]; (3) A modified crystal growth mechanism induced by the formation of surface OLi
groups, which impedes the diametrical and columnar growth of the oxide crystallites
[58].
A lot of research has been carried out on the crystallization and degradation of
zirconium oxide in different pH alkaline solutions, most of which were done in lithium
hydroxide solutions [59, 60]. Zirconium alloys generally show an accelerated corrosion
rate in LiOH solutions, and the rate increased dramatically with increasing concentration
of LiOH (pH value) and increase in temperature. When tested in very high pH solutions
(>13.5), there would no longer be a pre-transition period and the thickness of oxide
increased rapidly [56]. It is interesting to note that this accelerated corrosion rate of
zirconium alloys always occurs in LiOH solutions, not in other metal hydroxide solutions
such as KOH, NaOH and NH4OH at the same molar content or in 1M lithium salt
solutions such as LiNO3, Li2SO4 and Li2CO3. In a KOH solution of pH 14, however,
some acceleration of corrosion occurs. This suggests that not only the cations but the
concentration of OH- ion, that is, pH, may govern the corrosion of zirconium alloys at the
same time [61]. Thus far, it is not clearly understood why the corrosion of zirconium
alloys depends on pH and higher accelerated corrosion occurs in LiOH solutions.
Garzarolli et al. [62] proposed that the amorphous oxide formed at the oxide/metal
interface initially crystallizes to fine equiaxed tetragonal zirconia, which grows and
![Fig. 2.1 CANDU basic lattice cell for 37-element fuel [12].](https://thumb-us.123doks.com/thumbv2/123dok_us/1450427.1177676/26.612.202.466.50.375/fig-candu-basic-lattice-cell-element-fuel.webp)


![Fig. 2.4 Abridged flow chart for the fabrication of CANDU Zr-2.5Nb pressure tubes [20]](https://thumb-us.123doks.com/thumbv2/123dok_us/1450427.1177676/33.612.118.529.52.515/fig-abridged-flow-chart-fabrication-candu-pressure-tubes.webp)

![Fig. 2.6 Schematic Zr-Nb binary phase diagram [23].](https://thumb-us.123doks.com/thumbv2/123dok_us/1450427.1177676/35.612.146.499.244.516/fig-schematic-zr-nb-binary-phase-diagram.webp)