Design and ultimate behavior of RC plates and shells
Chang-shik Min 1)
1) Department of Civil and Environmental Engineering, Dongguk University, Pil-dong 3 ga 26, Chung-gu, Seoul, 100-715 KOREA
ABSTRACT
An iterative numerical computational algorithm is presented to design a plate or shell element subjected to combined membrane and flexural forces. Based on equilibrium consideration for the ultimate limit state, equations for capacities of top and bottom reinforcements in two orthogonal directions have been developed. The design algorithm is implemented in a finite element analysis computer program developed by Mahmoud and Gupta. The amount of reinforcement is then determined at the center of each element by an elastic finite element analysis for the design ultimate load. Two cases of design are performed for (1) a hyperbolic paraboloid saddle shell [Lin-Scordelis saddle shell] and a hyperbolic cooling tower [Grand Gulf cooling tower] to check the design strength against a consistent design load, therefore, to verify the adequacy of the presented design algorithm. Based on ultimate nonlinear analyses performed, the analytically calculated ultimate load exceeded the design ultimate load from 7% to 34% for analyses with tension stiffening parameter from 5 to 20 for the saddle shell problem. For the cooling tower problem the calculated ultimate load exceeded the design ultimate load from 26% to 63% for analyses with tension stiffening parameter from 5 to 20. Since the effective tension stiffening would very over the life of the shells due to environmental factors, a degree of uncertainty seems inevitable to calculate the actual failure load by the numerical analysis. Even though, the ultimate loads have strong dependence on the tensile properties of concrete, the calculated ultimate loads are higher than the design ultimate loads for the both design cases. For the cases designed, the design algorithm gives a lower bound on the design ultimate load with respect to lower bound theorem. This show the adequacy of the design algorithm presented at least for the shells studied. To generalize the conclusion many more designs - analyses should be performed with different shell configurations.
I N T R O D U C T I O N
Shell structures mobilize geometry to activate both the membrane and the flexural internal force systems to efficiently support any distributed loads applied to those structures. In current design practice for concrete shells [1], stresses due to design loads from elastic analysis are used to design reinforcement in shells based on point-wise limit state behavior [2,6,7]. A possible justification for the practice -- elastic analysis and point-wise limit design -- can be found from the lower bound theorem of plasticity. A linear elastic analysis indeed provides an equilibrium state of stresses, and the same type of design procedure is used in other reinforced concrete structures also [1]. Even though the reinforced concrete is not an elastic- perfectly-plastic material as in the theorem, the validity of the present practice has been established through many years of analysis, testing, and experience for other types of structures, such as frames.
Even, shells resist applied forces primarily through in-plane membrane action, bending is still induced on the shell. Therefore, in the design process it is more rational approach to include combined membrane forces and bending moments simultaneously. Design of reinforcement in plates and shells for a combined membrane and bending state of stress is a complex problem. Such a general solution is recently starting to evolve [8,9,10]. Gupta [8] developed an iterative trial-and- error design method using the Principle of Minimum Resistance by dividing the element into two imaginary concrete layers with each orthogonally placed reinforcing bars. Later, Laurenco and Figueiras [9,10] presented an automated design of reinforced concrete plates and shells in accordance of MC90 code. They implement the design equations to a computer program and performed several design examples, such as simply supported slab and shallow dome.
A complete iterative computational algorithm is developed to design a plate or a shell element subjected to combined membrane forces and bending moments. The algorithm is developed with the base of Gupta's derivation [8]. Gupta obtained the design equations only partly for the case of the reinforcement required in the top and bottom layers, simultaneously. There are three more cases need to be developed [ 19]. In the design equations, the reinforcement will contribute for tension and the concrete compression struts parallel to the crack directions for compression. The reinforcement is assumed to have two orthogonal layers placed in the top and bottom surface with appropriate covers. Each reinforcement layer has rebars placed orthogonally in x- and y-directions, respectively. For the concrete compression struts, the stress will be assumed distributing in the depth of Whitney's stress block. The design algorithm is implemented in the nonlinear Mahmoud-Gupta's computer program [ 12]. To verify the design equations on the element level several experimantal examples are designed before [5] and performed nonlinear ultimate analysis using the Mahmoud-Gupta program to show the adequacy of the design equations. If the calculated ultimate strength is larger than the ultimate strength obtained from the test, then we can say that the design method is satisfactory. The calculated ultimate strengths are from 3% to 18% higher than the ultimate design loads obtained from the test results, and show that the design method is satisfactory on the element level.
SMiRT 16, Washington DC, August 2001 Paper # 1535
In the present study, the adequacy of the design algorithm on the global level is evaluated by designing two shells, such as (1) a hyperbolic paraboloid saddle shell and (2) a hyperbolic cooling tower. The reinforcement design is based on the elastic stresses obtained from a finite element analysis by applying the design ultimate load combinations [ 1 ].
DESIGN EQUATIONS FOR COMBINED MEMBRANE AND FLEXURAL FORCES
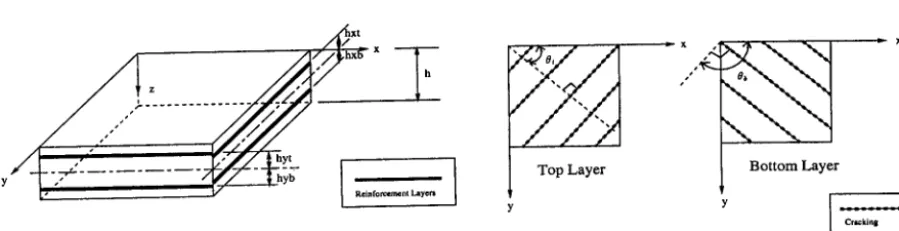
The bending moments M x, M y , M~y and membrane forces N x , N y , Nxy are applied simultaneously in a plate or shell element. In the limited ultimate state the applied forces have to be in equilbrium for the tensile forces in the reinforcement and the compressive forces in the concrete compression strut parallel to the crack direction. In this state, concrete stress in compression will be assumed as distributing in the depth of Whitney's stress block like a beam in flexure and the tensile strength of concrete is ignored as in the current design philosophy for simplification [ 1 ]. A rigid-plastic behavior is assumed for the reinforcement rebars. It is assumed that the reinforcement is consisted of two orthogonal layers placed at the top surface and the bottom surface with appropriate covers. And each orthogonal reinforcement layer has rebars in x- and y-directions, respectively. Therefore, the capacity of these reinforcements can be designanted by Nxt, Nx* b , N~t, N y b , where subscripts x
and y designate the directions, and t and b stand for the top and bottom layers, respectively. Fig. 1 (a) shows a plate or shell element with reinforcement depicted as smeared layres. At the limited state, a vertical plane of crack, whose normal makes an angle 0 t and 0 b with the x-axis in the xy plane, penetrates through the top and the bottom surface (see Fig. l(b)). The
concrete is under compression parallel to this crack; it is assumed that the depth of Whitney's stress block is a t and a b ,
respectively. In the design process, there are four different cases need to be considered. Only one case [reinforcement required in the top and bottom layers] is discussed here. Other cases are similar with the first case and ommitted here for brevity [ 19].
Reinforcement required in top and bottom layers: The reinforcement capacities of top and bottom layers in x and y orthogonal directions are given by considering equlibrium with the applied forces and moments as
Nx* t - Nxt + Nxy t Cxt t t a n 0 t + Nxy b Cxt b t a n 0 b (1)
Nxb - Nxb + Nxy t Cxb t t a n 0 t + N~y b Cxb b t a n 0 b (2)
N~t - N y t .-b Nxy t Cytt c o t 0 t + Nxy b Cytb c o t 0 b (3)
N~b - N y b + Nxy t Cybt c o t 0 t + Nxy b Cybb c o t 0 b (4)
and definition of each variables can be found from the Ref. [ 19].
When the values of 0 t or 0 b is very small, then the compressive forces will be very large and the iterative mothod will
become unstable. Laurenco and Figueiras [9,10] used 10 ° < (0 t , O h ) < 80 ° for the purpose. Based on the numerical experiment with the problems, we found that all the elements are converged within the maxiumn range of - 5 ° < (0 t , O b ) < 5 ° . Therefore, in the present study, we set (0 t , 0 b ) - - 0 ° w h e n I(ot , 0 b)l < 5 ° to avoid numerical instability. When the calculated value of Eqs. (1-4) is negative value, then no reinforcement is required on that direction. We can set the reinforcement capacity of that direction to zero and recalculate the values of 0 t or 0 b . In the present study,
minimun reinforcement area ( As, min ) of ACI 318 [ 1 ] is implemented for control of the crack width under the service loads.
Z
Y
x - F
x
Reinforcement Layers
(a) Shell Element Showing the Reinforcement Layers
I - Top Layer
= x ,1
s,, SS
Bottom Layer
Cr~eking
(b) Crack Directions
Fig. 1 Four reinforcement layers (two for top and two for bottom) and crack directions
Therefore, in Eq. (1), when Nx* t <_ Nmin, then we can set Nxt - Nmi n and calculate a new 0 t value as
0 t - tan -1 [ ( N ; i n - Nxt - mxy b Cxt b t a n 0 b ) / (mxy t Cxt t )] (8)
Similarly, from Eqs. (2-4) Nxb , N e t , N y b are smaller than Nmin, then set ]Vxb , m y t , Ny b = Nmi n , respectively, and obtain 0 t or 0 b values accordingly. More detailed derivation for step-by-step design algorithm of reinforcement required can be found else where and ommitted here [8,19].
SADDLE SHELL PROBLEM: Analysis model and methods
The design of reinforced concrete shells requires careful attention to all the parameters affecting their behavior. Some of these parameters for hyperbolic paraboloid shells, such as rise-span ratio, type of edge beams and it's eccentricity, type of supporting system, etc., have been theoretically and experimentally studied extensively [2]. The focus here is on designing the reinforcement for combining membrane and flexural forces and evaluating the adequacy of the design based on the ultimate behavior of the shell. The geometry and the material properties of Lin-Scordelis saddle shell [11 ] is used in the present design without any possible improvement for the design, which is also used by many research teams before, such as Muller and Scordelis [20]; Akbar and Gupta [4]; Min and Gupta [14,16] and Min [17,18]. The edge beams and the shell modeled by the same 4-node shell element. The shell elements are divided into ten concrete layers and two reinforcement layers, both direction reinforcements placed near the surface of the shell with proper cover. One quarter of the shell (divided by the orthogonal diagonal) is needed to analyze by recognizing two planes of mirror reflection symmetry and by applying appropriate constraint equations with 4-node bilinear elements
[14]. Considering the previous mesh convergence study [14,16] the most refined model, 64 by 64 mesh (element size =0.38m x 0.38m) is used. The combination of (1.4D+ 1.7L)/0.9 is used in accordance with ACI 318 [1] in which D represents stresses due to the dead loads of the shell and the edge beams and L due to the live loads. The combination of (1.4D+l.7L)/0.90 is called the ultimate design load. The strength reduction factor, 0.9 is used in the present design, which is recommnanded by ACI.
DESIGN AND ULTIMATE
BEHAVIOR: The shell was first analyzed elastically for the ultimate design load, and the required reinforcement ratios in each element are obtained at the center integration point. The shell thickness of 10.2cm (4in.) is used in the design as of Lin-Scordelis's saddle shell. Design parameters used in the design as follows [14,20]: (1) Nominal compressive strength parallel to the cracks is taken as 0.4f~' = 8.27 MPa; (2) Yield stress of the reinforcement is taken as 414 Mpa (60 ksi); (3) With proper cover 1.27cm (0.5in.), the top and bottom reinforcement layers are placed orthogonally at 3.8 cm (1.5in.) from the mid-surface of the section [Since the total shell thickness is only 10.2cm, we can choose welded wire fabric as the reinforcement.]; and (4) The minimum
Support Support
Tip Tip
S $~ppor
- ' (b) R h o y t 1 000
Support
/ Tip
/ II! ii ' l
" x \
Tip Support
(c) Rho..xb * 1,000
Support
/ Tip
/ 1~/Ix . . . " .. . . I . . . I . . . II il r~l
Tip
Support
(d) R h o y b * 1,000
Table 1. Total amount of reinforcement required for the Lin-Scordelis saddle shell by the various design methods
Muller-Scordelis [20]
Min-Gupta [ 16] Min [18]
Present study
Design methods
• Use Nxy only membrane analysis • Elastic design method
• Use Nxy o n l y - membrane analysis • Limit state design method
• Elastic finite element analysis • Use Nx, Ny and Nxy only • Limit state design method • Elastic finite element analysis • Use membrane and flexural forces • Presented design algorithm
Total amount of reinforcement required (unit = m3 )
x dir. y dir.
Each direction' 0.253 (reinforcement ratio=0.42%)
Each direction: 0.155 (reinforcement ratio=0.257%)
0.161
0.171
0.189
0.192
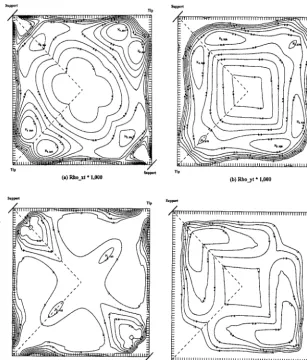
reinforcement ratio is set to 0.025% which is about 1/10 of the usual minimum reinforcement ratio in the practice. Fig. 2 shows the distribution of the required reinforcement ratios obtained by the computer program. The reinforcement ratios are generally greater than the minimum reinforcement ratio except near the tip and the support and alongside the edge beams. Fig. 2 (a) and (b) show that the contours for the top layer are more complicated than compare to the bottom layer for Fig. 2 (c)and (d). For the top layer in x-direction the peak reinforcement ratio is occurred near the tip parallel to the support-to-support diagonal by 0.466% and another peak is near the support with 0.339% of reinforcement ratio (see Fig. 2 (a)). For y-direction of the top layer the peak reinforcement ratio is occurred elsewhere near the support by 0.393% and other peak is near the tip with 0.368% of reinforcement ratio (see Fig. 2 (b)). On the other hand for the bottom layer in x-direction Fig. 2 (c) shows that the peak is occurred near the support on the diagonal line by 0.3% and for the most of the shell relatively uniform reinforcement ratio is required with 0.05% ratio. For y-direction in the bottom layer the 0.25% of peak ratio areas are occurred near the support and the reinforcement ratio for the shell is in the range of 0.1% to 0.25% ratio (see Fig. 2 (d)). In reality, it would be impractical to vary the steel distribution from element to element. Since the purpose of the present study is to evaluate the theoretical capacity of the shell based on the design equations, the reinforcement ratios used are obtained for each element without any effort for real reinforcing placement
Table 1 shows a comparion of the design methods and total reinforcement amount required by the various research teams. To compare with the previous design [18] based on the membrane forces only, the present design equations require 6% increase in x-direction and 2% increase in y-direction. Considering combined membrane and flexural forces in the design, we can expect that the design could reqire more amount of reinforcement. As one compares the total amount of reinforcement for the top and the bottom layers; in x-direction the top layer requires 2.5 times more reinforcement than the bottom layer [the top layer consists 71% of total amount of reinforceemnt and the bottom 29%] and in y-direction the top layer requires 1.7 times more reinforcement than the bottom layer [the top layer consists 63% of total amount of reinforcement and the bottom 37%]. Requiring 1.7 times to 2.5 times more reinforcement in the
top layers are indicating that quite significant bending actions are existed on the saddle shell.
LOAD-DEFLECTION CURVES: Mahmoud and Gupta [12] modeled tension stiffening as a gradual unloading of the concrete stress-strain curves in tension. The tension stiffening effect is a complex phenomenon and is dependent on the percentage of steel, diameter of the reinforcing bars, bond stress, concrete strength, and distribution of reinforcement. As discussed by Milford and Schnobrich [13] and Mahmoud and Gupta [12] there is still little experimental data available on which to quantify tension stiffening and rational modeling of the tension stiffening effect in a finite element analysis is still evolving. Since the tensile properties of concrete would very over the life of the shell, it is only able to predict the ultimate strength with a degree of uncertainty. Therefore, in the present study we performed ultimate analyses with tension stiffening
140
r ~
¢D
¢D
¢D
120
100
80
60
4020 Z
x 20 ili!
0
5
10 1520
Vertical tip displacement(cm)
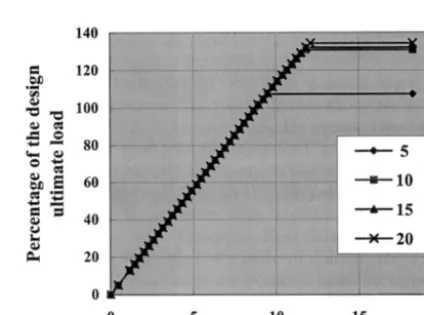
parameters of y = 5~20 cases.
Fig. 3 shows the load-deflection curves for the saddle shell with tension stiffening parameter, 7" = 5"°20 cases. The load- deflection curves are straight until it reaches the unconverged step. As observed by the previous study [17], the actual load-deflection curve goes down after it reaches the maximum factored load combination. Similar observations made by Muller and Scordelis [20] also. For the 7" - 5 case, the analysis reaches the convergence by 107% of the estimated ultimate load and a 9.5cm vertical tip displacement. At the next loading step, the saddle shell failed to reach a convergence and the load-deflection curve goes down as before [ 17]. The failure is initiated by a formation of failure lines near the tip of the shell in a direction parallel to the support-to-support diagonal, and consequently large residual forces are found in this area. Not only no yielding of reinforcement is observed up to the ultimate, but also increasing the steel yield stress did not delay or stop the formation of the failure lines on the concrete layers because of large unbalanced forces by forming triangular-shape edge failure areas. We considered that the last converged step as the calculated ultimate load. Increasing tension stiffening parameter to 10 the formation of the failure lines is delayed due to increase concrete strength after cracking, and the calculated ultimate load is increased to 131% with the vertical tip displacement of 11.8cm. Additional increasing of tension stiffening parameter to 15 and 20 have little effect on the calculated ultimate load by increasing the calculated ultimate load only 1% and 3% from the tension stiffening parameter 10 case, respectively.
DISCUSSION: A hyperbolic paraboloid saddle shell (Lin-Scordelis saddle shell) is designed to check the design strength against a consistent design load, therefore, to verify the adequacy of design equations presented [19]. The amount of reinforcement is obtained from an elastic finite element analysis by applying the design ultimate load combination, (1.4D+l.7L)/0.9. Based on nonlinear ultimate analyses performed, the analytically calculated ultimate load exceeded the design ultimate load from 7% to 34% for analyses with tension stiffening parameter from 5 to 20 cases. Observing the ultimate behavior, the shell shows that it resists not only by membrane action, but also by bending action. Therefore, designing the HP saddle shell with combined membrane and flexural forces are indispensable. Since tensile properties of concrete would very over the life of the saddle shell, it is only able to predict the ultimate strength with a degree of uncertainty. However, for the saddle shell studied the design method gives a lower bound on the ultimate load with respect to lower bound theorem.
C O O L I N G T O W E R PROBLEM: Analysis model and methods
Natural drought cooling towers are effective and economic choice among all technical solutions to avoid thermal pollution of natural water resources due the heated cooling water in the various industrial facilities. Cooling towers are shells of double curvature that resist the applied forces primarily through in-plane membrane action. These shells can be more than 150m in height and 60m in base diameter. These towers have wall thickness of about 20cm~25cm thick for most of the shell. The conventional approach to designing a cooling tower shell is based on the membrane stresses only and ignored bending stresses. The reason that design based on the membrane stress only is not only no general satisfactory solution was available for a combined membrane and bending state of stress before, but also it was believed that bending plays a secondary role for such shells. Membrane stresses are usually obtained performing a numerical elastic analysis for the design loads with a finite element computer program. Reinforcement is then proportioned using a point-wise limit design method [1,7]. Usually the reinforcement is provided in the meridional and the circumferential directions for the cooling tower.
The cooling tower designed for the Grand Gulf Nuclear Power Station, Port Gibson, Mississippi [21 ] is used in this study. We used the geometry and the material properties of the Grand Gulf Cooling Tower without any possible improvement for the
160 ¢~ 140 ~- 120 ~ ~00
• = - ~ 80 ~ 60 40
~a 20 N
0
(a) Circumfernential direction
• &
. . . I & ; : ::
I l l : ?~ :: i :
: ) l l
0 100 200 300 400 500 600 Reinforcement capacity in kN/m
160 o 140 120 ~ 100 ~ 80 e ~
~ 60 40 o o
20 o
(b) Meridional direction
i/;iii
g!;
N;iiii!i:i~ii 0 100 200 300 400 500 600Reinforcement capacity in kN/m
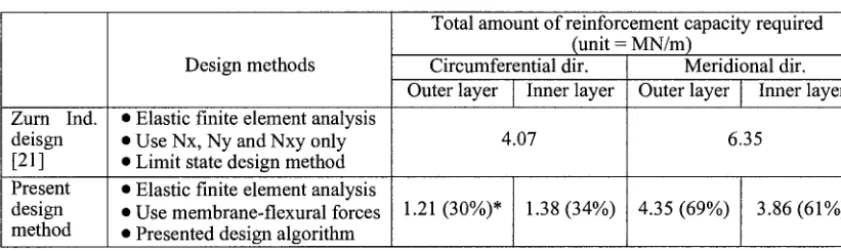
Table 2. Comparison of the total amount of reinforcement capacities required from the original Zurn Ind. design and the present design method
Zurn Ind. deisgn [21] Present design method
Design methods
• Elastic finite element analysis • Use Nx, Ny and Nxy only • Limit state design method • Elastic finite element analysis • Use membrane-flexural forces • Presented design algorithm
Total amount of reinforcement capacity required (unit = MN/m)
Circumferential dir. Outer layer Inner layer
4.07
1.21(30%)* 1.38(34%)
Meridional dir. Outer layer Inner layer
6.35
4.35
(69%)
3.86 (61%)* Percentage of the layer compare to the original Zurn's design capacity
design. Adequacy of the design method is evaluated by performing a nonlinear ultimate analysis using Mahmoud-Gupta's computer program [12]. Only one-half of the cooling tower needs to be analyzed because of the symmetry of the wind load about the windward meridian and the axi-symmetry of the cooling tower geometry. The half-circumference of the tower is discretized into 24 and 18 elements in the circumferential and the meridional directions, respectively. The choice of the mesh size is based on Min and Gupta's [14,15] convergence study. The combination of (0.9D+l.3W)/0.9 is used and called the ultimate design load. The wind load recommended in the ACI-ASCE Committee 334 report is used [3]. The reference wind speed (
Vf3 o )
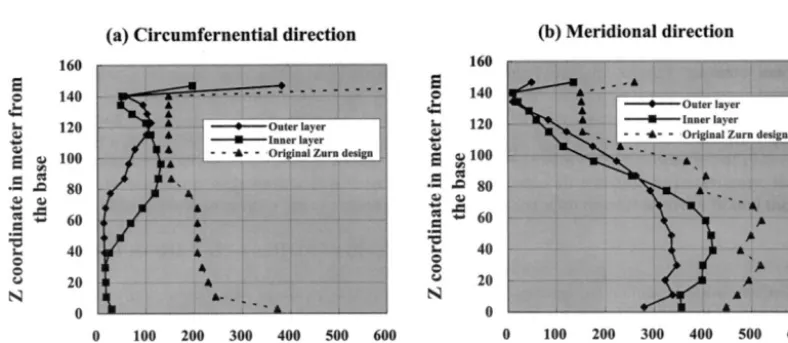
of 145km/h (90 mph) for a 100-year return period was used.DESIGN AND ULTIMATE BEHAVIOR: The tower was first analyzed elastically for the ultimate design load, and the required reinforcement ratios (the two meridional layers [outer and inner layers] and two circumferential layers) are obtained by choosing the maximum capacities of all the corresponding values calculated around the circumference at any height. Design parameters used in the design as follows [14,15]: (1) Nominal compressive strength parallel to the cracks is taken as 0.4f~' - 8.27 MPa; (2) Yield stress of the reinforcement is taken as 414 MPa (60 ksi.); (3) As with original Zurn design, 3.8 cm (1.5 in.) of concrete cover was assumed for entire tower; and (4) Again, the minimum reinforcement ratio is set to 0.025%. Fig. 4 shows the distribution of the required reinforcement capacity obtained by the computer program. Fig. 4 (a) shows that about 40m to 140m of the tower from the base the required reinforcement capacity for the outer and innner circumferential layers exhibit discrepancies and the maximum difference occurred around 68m from the base by 5.72 times more reinforcement required for the inner layer than the outer layer. Those discrepancies in the reinforcement capacity between the inner layer and outer layer indicates that the tower developed quite amount of bending actions in this direction to resist applied loads. For the meridional direction similar observation can be made from Fig. 4 (b) about 10m to 120m from the base of the tower. Even though somewhat less significant to compare with circumferential direction bending action is also occurred in the meridional direction. The maximum discrepancy is occurred at 106 m from the base by 1.53 times more reinforcement required for the inner layer than the outer layer. Fig. 4 also shows the original Zurn Ind. design. Since Zurn's design was rounded up for placing actual bar size used and usually in the design process the reinforcement is provided uniformly in one area, the reinforcement capacity of Fig. 4 was exaggerated than the actual calculated design capacity. The reinforcement capacities provided by the Zurn's designs are well coverd the reinforcement capacities required by the present design method. Table 2 shows a comparion of the total amount of reinforcement capacity required for the original Zurn design and the present design method. The present design method requires only 30% (outer layer) and 34% (inner layer) of total amount of reinforcement compared to the original Zurn's 4.07MN/m total reinforcement capacitiy in the circumferential direction. In the meridional direction 69% and 61% are required for the outer and inner layer compared to the 6.35MN/m provided in the original Zurn's design.
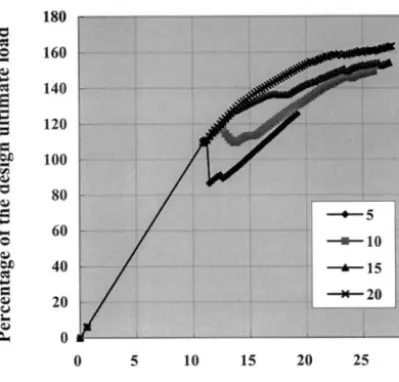
is observed. Additional increase of tension stiffness parameters to 15 and 20, the tower withstands at the ultimate by 154% - 27.4cm and 163% - 27.6cm, respectively. Those calculated ultimate loads are increased 3.4% and 9.4% from the tension stiffening parameter 10 case for tension stiffening parameter 15 and 20 cases, respectively.
DISCUSSION: The analytically calculated ultimate load exceeded the design ultimate load from 26% to 63% for an analysis with tension stiffening parameter 5 to 20 cases. The failure mode for the tower designed is the buckling of the tower triggered by the loss of circumferential bending capabilities by the reduction of stiffness due to concrete cracking below the throat region. Although it has an undesirable failure mode, the cooling tower designed in the present study is at least safe within the assumed design ultimate load. Due to the environmental factors, the actual effective values of concrete tensile characteristics, such as effective tension stiffening (after cracking) may vary significantly during the life of a tower, thus making the prediction of the realistic buckling load difficult. Furthermore, buckling is not the intended mode of failure in the present design philosophy.
C O N C L U S I O N S
180 160
m m
140 • j,,,l - " 120
100 oj,,~
80 ¢ D
60 o
40 20 0
0 5 10 15 20 25 30
Horizontal throat displacement at 120 m (cm)
Fig. 5 L o a d - d e f l e c t i o n c u r v e s o f t h e c o o l i n g t o w e r w i t h t e n s i o n s t i f f e n i n g p a r a m e t e r s o f 5 to 20
An iterative numerical computational algorithm is presented to design a plate or shell element subjected to combined membrane and flexural forces. Based on the equilibrium consideration for the imaginary divided into two layers (upper and lower concrete layers), design equations for capacities of top and bottom reinforcements in two orthogonal directions have been derived at the limited ultimate state in which the concrete is cracked and the reinforcement reaches to the yield stress. The design algorithm is implemented in a finite element analysis computer program developed by Mahmoud and Gupta [ 12]. Two cases of design are performed for (1) a hyperbolic paraboloid saddle shell and (2) a hyperbolic cooling tower to check the design strength against a consistent design load, therefore, to verify the adequacy of the design algorithm.
For the saddle shell problem, the amount of reinforcement is determined by applying the design ultimate load combination, (1.4D+l.7L)/0.9. Based on nonlinear ultimate analyses performed, the analytically calculated ultimate load exceeded the design ultimate load from 7% to 34% for analyses with tension stiffening parameter from 5 to 20 cases. Observing the ultimate behavior, the shell shows that it resists not only by membrane action, but also by bending action. Therefore, designing the HP saddle shell with combined membrane and flexural forces are indispensable. Since tensile properties of concrete would very over the life of the saddle shell, it is only able to predict the ultimate strength with a degree of uncertainty. However, for the saddle shell studied the design method gives a lower bound on the ultimate load with respect to lower bound theorem.
For the cooling tower problem, the combination of (0.9D+l.3W)/0.9 is used in the design for the two meridional layers and two circumferential layers. Based on nonlinear inelastic analyses performed, the analytically calculated ultimate load exceeded the design ultimate load from 26% to 63% for an analysis with tension stiffening parameter 5 to 20 cases. The failure mode for the tower designed is the buckling of the tower triggered by the loss of circumferential bending capabilities by the reduction of stiffness due to concrete cracking below the throat region. Although it has an undesirable failure mode, the cooling tower designed in the present study is at least safe within the assumed design ultimate load. Due to the environmental factors, the actual effective values of concrete tensile characteristics, such as effective tension stiffening may vary significantly during the life of a tower, thus making the prediction of the realistic buckling load difficult. Furthermore, buckling is not the intended mode of failure in the present design philosophy. Therefore, further research is needed to develop simple methods of predicting the buckling load of cooling tower, which can then be used by the designers to avoid a buckling failure.
Even though, the ultimate loads have strong dependence on the tensile properties of concrete, the calculated ultimate loads are higher than the design ultimate loads for the both design cases. For the cases studied, the design algorithm gives a lower bound on the design ultimate load with respect to lower bound theorem. This show the adequacy of the design algorithm presented at least for the shells studied. To generalize the conclusion many more designs - analyses should be performed with different shell configurations.
R E F E R E N C E S
1. ACI 318-99, Building Code Requirements for Reinforced Concrete and Commentary, American Concrete Institute, 1999.
2. ACI SP-110, Hyperbolic Paraboloid Shells' State of the Art, American Concrete Institute, Prepared by ACI Comm. 334 - Concrete Shell Design and Construction - Joint ACI-ASCE, SP-110, 1988.
3. ACI-ASCE. "Reinforced Concrete Cooling Tower Shells - Practice and Commentary.'" ACI Journal, Nov.-Dec. ACI-ASCE Comm. 334, 81-52, 1984.
4. Akbar, H., and Gupta, A. K., "Membrane reinforcement in concrete shells: design versus nonlinear behavior." Rep., North Carolina State Univ., Raleigh, N.C., Jan. 1985.
5. Cho, Hong-jin and Min, Chang-shik, "Combined membrane and flexural reinforcement in plates and shells." J. Korean Society of Civil Engineers, 29(5-A), 725-735, 2000 (in Korean).
6. Gupta, A. K., "Membrane reinforcement in concrete shells." J. Struct. Div., ASCE, 107(1), 41-56, 1981.
7. Gupta, A. K., "Membrane Reinforcement in Concrete Shells: A Review." Nuclear Engrg. Design, 82, 63-75, 1984.
8. Gupta, A. K., "Combined membrane and flexural reinforcement in plates and shells." J. Struct. Div., ASCE, 112(3), 550-557, 1986. 9. Lourenco, P. B. and Figueiras, J. A., "Automatic design of reinforcement in concrete plates and shells." Engrg. Comput., Vol. 10, 519-541,
1993.
10. Lourenco, P. B. and Figueiras, J. A., "Solution for the design of reinforcement concrete plates and shells." or. Struct. Engrg., ASCE, 121(5), 815-823, 1995.
11. Lin, C. S. and Scordelis, A. C., "Nonlinear analysis of RC shells of general form." J. Struct. Div., ASCE, 101(3), 523-538, 1973. 12. Mahmoud, B. E. H. and Gupta, A. K., "Inelastic large displacement behavior and buckling of hyperbolic cooling tower shells." Rep.,
North Carolina State Univ., Raleigh, N.C., May 1993.
13. Milford, R. V., and Schnobrich, W. C., "Nonlinear behavior of reinforced concrete cooling towers. " Tech. Rep., University of Illinois, Urbana-Champaign, IL, May. 514, 1984.
14. Min, Chang Shik and Gupta, A. K., "A study of inelastic behavior of reinforced concrete shells using supercomputers." Rep., North Carolina State Univ., Raleigh, N.C., March 1992.
15. Min, Chang Shik and Gupta, A. K., "Inelastic behavior of hyperbolic cooling tower." J. Struct. Engrg., ASCE, 119(7), July, 2235-2255, 1993.
16. Min, Chang Shik and Gupta, A. K., "Inelastic behavior of reinforced concrete hyperbolic paraboloid saddle shell." Engrg. Struct., 16(4), 227-237, 1994.
17. Min, Chang Shik, "Ultimate behavior of RC hyperbolic paraboloid saddle shell." Struct. Engrg. Mech., Int. J., 5(5), 507-512, 1997. 18. Min, Chang-shik, "Design versus nonlinear behavior of RC Hyperbolic Paraboloid saddle shell." J. Korean Society of Civil Engineers,
17(I-6), 935-945, 1997 (in Korean).
19. Min, Chang Shik, "Design of RC plates and shells subjected to membrane force and flexural moment." J. Korean Society of Civil Engineers, 19(I-2), 171-183, 1999 (in Korean).
20. Muller, G., and Scordelis, A. C., "Nonlinear analysis of reinforced concrete hyperbolic paraboloid shells." Tech. Rep., Univ. of California, Berkeley, CA 94720, Oct., 1977, Rep. UC-SESM 77-6.