S
H E F E T ,S
A R I DM
. Development of a quantitative visualization method
to characterize the flow behavior of food particulates in a continuous aseptic
sterilizer.
(Under the direction of Dr. Brian W. Sheldon).Presently, conventional continuous pasteurization systems which were designed primarily for liquids and semi-liquids do not satisfy either product quality specifications or safety requirements of U.S. regulatory agencies when applied to food containing particulates (Marcotte et al., 1994; Simunovic et al., 1995). One potential solution to the above problem was suggested in a recently issued patent by this author entitled ‘Hydrostatic Heating Apparatus’ (Shefet, 1996).
The objectives of this study were to develop a quantitative visualization tool for evaluating flow behavior of particles in a model hydrostatic heating apparatus or other flow systems and to estimate process paramenters (Reynolds numbers, Nusselt numbers, Biot numbers, heat transfer coefficients, holding tube length and process times) of a simulated aseptic process for potato spheres, based on the quantitative data collected during the study.
path. For a given point in a path, the net displacement is the distance along a straight line from the first point of the path to the given point. In contrast, the gross displacement is the distance along the actual path from the first point in the path to the given point. The ratio between these two quantities is termed the net to gross displacement ratio (Motion Analysis Corporation, 1990). As carrier liquid flow rate increased, there was an associated increase in both the mean and standard deviation speed and NGDR values. In general, larger ball sizes yielded lower speed and NGDR values (i.e., less movement). A concave (bowl-like) conveyor disk design as opposed to a 90° flat-edge disk design yielded greater speed and NGDR values when carrier velocity was 30 l/min. Speed and NGDR values having higher standard deviations were interpreted as having greater turbulent flow. Furthermore, speed and NGDR mean and standard deviations were highly correlated (r2 > 0.9) indicating that either statistic could be used to describe the flow behavior of particles. In addition, a high correlation (r2 > 0.9) was observed between measurements (speed, NGDR) taken in both planes (x;y, x;z). The average speed derived from the quantitative visualization method was subsequently used to calculate heat transfer and related properties in the model hydrostatic heating apparatus.
IN A CONTINUOUS ASEPTIC STERILIZER
by
SARID M. SHEFET
A thesis submitted to the Graduate Faculty of North Carolina State University
in partial fulfillment of the requirements for the Degree of
Doctor of Philosophy
DEPARTMENT OF FOOD SCIENCE
Raleigh 1998
DEDICATION
The great experience of attending this graduate school at North Carolina State University has been made possible through the encouragement and support I have received from friends in the Raleigh area, but mostly from my wife and the entire family back home in Israel.
BIOGRAPHY
ACKNOWLEDGMENTS
I am thankful to my advisor Dr. Brian W. Sheldon for all of the support and encouragement during the course of my degree. Thank you for taking the effort for advising me in a discipline that at the time was foreign to your primary field of research. I am also thankful to Dr. Brian E. Farkas for the long hours he patiently spent with me, and to Dr. Larry F. Stikeleather for his help and advice and for both for serving as members of my committee. Special thanks go to Dr. Kenneth R. Swartzel who had the vision and encouraged me to file the patent disclosure. Thank you all for the guidance, advice and support through the process. A sincere appreciation is extended to Susan Hale for all of her laboratory assistance.
TABLE OF CONTENTS
Page
List of tables...x
List of figures...xii
List of symbols...xviii
Introduction...1
Literature review...4
I. Definitions...4
1. Thermal death time...4
2. D value...4
3. z value...5
4. Q10...6
5. F...7
6. Fo...7
7. Commercial sterility...8
II. Aseptic processing and packaging...8
1. Background...8
2. Processing...14
1. Methods...15
a. Principles of HTST sterilization...15
b. Kinetic advantage of UHT processing...16
2. Enzyme inactivation...19
B. Aseptic processing of particulates...20
1. Background...20
a. Residence time distribution (RTD) in aseptic processing of particulate foods...22
i. Requirements for aseptic processing of particulate foods...23
ii. RTD of food particles in aseptic processing systems...24
iii. Theoretical background of RTD...26
iv. Supporting studies...29
v. RTD determination of food particles...30
b. Heat transfer...33
i. Heat transfer calculation...34
ii. Conduction...35
1. General...35
2. Conduction through a slab...36
1. Natural convection...37
2. Forced convection...38
iv. Heat load...38
v. Overall heat transfer coefficient...39
1. Logarithmic mean temperature difference...40
2. Overall particulate-liquid thermal energy balance...41
vi. Determination of heat transfer in a food system...42
2. Problems...43
3. Current solutions...44
a. TWINTHERM...44
b. Jupiter...45
c. Ohmic system / Multitherm system...46
d. APV paracel pasteurizer...46
e. Other...47
f. Recent developments...49
3. Packaging...51
A. Sterilization of containers...51
B. Filling and sealing...53
A. Evaluation of sterilization...55
B. Control of bacterial quality...56
C. Maintenance...57
D. Federal regulations...59
III. Flow...61
1. Fundamental flows...61
A. Laminar and turbulent flow in pipes...61
1. Flow characteristics...62
2. Laminar flow...63
3. Reynolds Number...63
4. Turbulent flow...64
B. Flow in food systems...64
C. Flow past a circular cylinder...65
2. Flow visualization...66
III. Summary...69
References...72
Manuscript. Development of a quantitative visualization method to characterize the flow behavior of food particulates in a continuous aseptic sterilizer...81
2. Introduction...84
3. Theory...87
4. Materials and methods...92
5. Results and discussion...103
6. Nomenclature...116
7. References...119
Summary...151
Appendix 1. United States Patent Number 5,546,849: Hydrostatic Heating Apparatus...153
Appendix 2. Dimensions and flow rates in the pilot plant apparatus and their equivalents in a full scaled model...182
Appendix 3. Procedures for using the ExpertVision™ Software with the Motion Analysis™ VP 110 video processor...185
LIST OF TABLES
Page Manuscript:
Table 1. The effect of pressure on the boiling point of water...122 Table 2. Dimensions of the pilot plant apparatus...122 Table 3. Areas in different sections of the pilot plant apparatus...122 Table 4. Linear correlation coefficients between mean and standard
deviation ball velocities in the x;y and x;z planes as
influenced by disk design and ball size...123 Table 5. Linear correlation coefficients between mean and standard
deviation NGDR values in the x;y and x;z planes as influenced
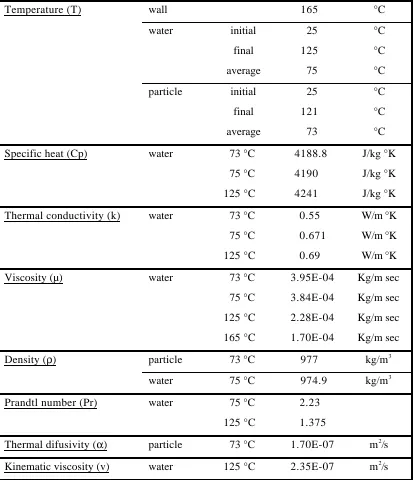
by disk design and ball size...123 Table 6. Initial, final and average temperatures of the tube wall, water
and particle (potato) and related heat transfer properties of
water at different temperatures...124 Table 7. Effect of tube diameter and medium velocity on Re and Nu
numbers, heat transfer coefficient, and the length of pipe and
time required to achieve a desired temperature of 121°C...125 Table 8. Mathematical relationships between changes of n magnitude
in diameter and medium velocity on Re and Nu numbers, heat transfer coefficient, and the length of pipe and time required
to achieve a desired temperature...125 Table 9. The effect of varying particle diameters and medium
Table 10. Biot, Re and Nu numbers, heat transfer coefficient and time to achieve a required temperature based on average velocities
of polystyrene balls using disk A...127 Table 11. Biot, Re and Nu numbers, heat transfer coefficient and time to
achieve a required temperature based on average velocities
of polystyrene balls using disk B...128
Appendix 2:
Table A2-1. Dimensions and volumes of the hydrostatic heating
apparatus...184 Table A2-2. Unit conversion of flow rates and the effect of varying flow
rates and areas on corresponding conveyor speed...184
Appendix 3:
Table A3-1. Vertical dimensions of cable conveyor in respect to
LIST OF FIGURES
Page Literature Review:
Figure 1. Derivation of the D value for a given temperature from a graph of the number of surviving organisms versus time...5 Figure 2. Derivation of z value from a plot of thermal death rate and D
value versus temperature...6 Figure 3. Time temperature relationships for spore destruction and
quality degradation levels...17 Figure 4. F value versus a z temperature of 10°C or °K....19 Figure 5. A graphical representation of time-temperature profiles for
liquids in the aseptic processing system...23 Figure 6. Typical tracer input patterns for determining RTD in
continuous processing systems...27 Figure 7. Typical E and F curves for RTD studies in aseptic systems...28 Figure 8. Typical design of the Hall Effect sensors around the holding
tube...32 Figure 9. Laminar and turbulent flow in a pipe...61 Figure 10. Variation of pressure drop with Reynolds number for pipe
flow...62 Figure 11. Distribution of fluid velocities inside a circular pipe for types
Manuscript:
Figure 1. A comparison of a hydrostatic heating apparatus system with
a moving cable-conveyor and a system with stationary disks...129
Figure 2. General design of the model pilot plant hydrostatic heating apparatus...130
Figure 3. General measurements of ‘Design A’ disk...130
Figure 4. View of ‘Design A’ disk mounted on a stainless steel rod...131
Figure 5. General measurements of ‘Design B’ disk...132
Figure 6. View of ‘Design B’ disk mounted on a stainless steel rod...133
Figure 7. A general scheme of ‘Design B’ disk...133
Figure 8. Design and construction dimension of ‘Design C’ disk...134
Figure 9. View of ‘Design C’ disk mounted on a stainless steel rod...134
Figure 10. General placement of a mirror beneath the plexi-glass tube to simultaneously view the x;y and x;z planes...135
Figure 11. Measurement of gross and net displacements between points A and B, for calculating net-to-gross-displacement-ratio...136
Figure 12. A simplified chart to represent heating of the particle cold spot via a heated medium...136
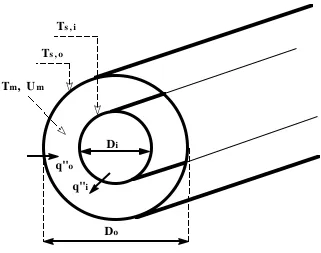
Figure 13. The concentric tube annulus...137
Figure 14. A general front view of the tube and the reflecting mirror as observed in the qualitative visualization...138
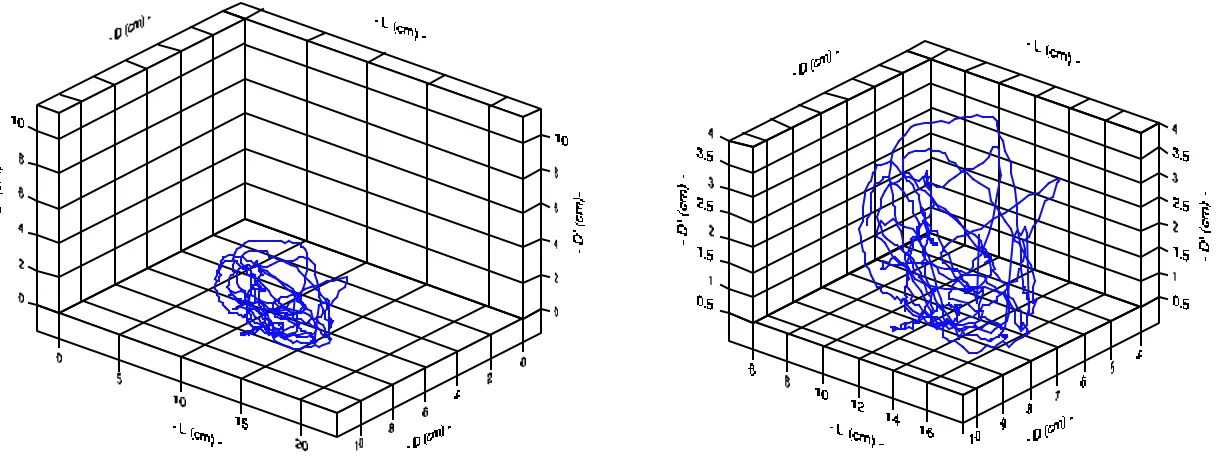
Figure 15. Typical flow profile obtained from x;y,z coordinates...139
Figure 17. Efect of disk design and liquid flow rate on the mean speed and standard deviation of different diameter polystyrene balls in x;y and x;z planes...141 Figure 18. Effect of disk design and liquid flow rate on the average
speed of different diameter polystyrene balls in the x;y plane...142 Figure 19. Effect of disk design and liquid flow rate on the speed
standard deviation of different diameter polystyrene balls in
the x;y plane...143 Figure 20. Effect of disk design and liquid flow rate on the average
speed of different diameter polystyrene balls in the x;z plane...144 Figure 21. Effect of disk design and liquid flow rate on the speed
standard deviation of different diameter polystyrene balls in
the x;z plane...145 Figure 22. Effect of disk design and liquid flow rate on the mean
net-to-gross-displacement-ratio (NGDR) and standard deviation of
different diameter polystyrene balls in x;y and x;z planes...146 Figure 23. Effect of disk design and liquid flow rate on the mean
net-to-gross-displacement-ratio (NGDR) of different diameter
polystyrene balls in the x;y plane...147 Figure 24. Effect of disk design and liquid flow rate on the
net-to-gross-displacement-ratio (NGDR) standard deviation of different
diameter polystyrene balls in the x;y planes...148 Figure 25. Effect of disk design and liquid flow rate on the mean
net-to-gross-displacement-ratio (NGDR) of different diameter
polystyrene balls in the x;z plane...149 Figure 26. Effect of disk design and liquid flow rate on the
net-to-gross-displacement-ratio (NGDR) standard deviation of different
Appendix 1:
Figure A1-1. A schematic illustration of a hydrostatic heating apparatus
of the present invention...177 Figure A1-2. A schematic illustration of a hydrostatic heating apparatus
with an alternative product outlet opening...177 Figure A1-3 A schematic illustration of a hydrostatic heating apparatus
with an alternative product inlet and outlet opening...178 Figure A1-4. A schematic illustration of a transporting means for a
hydrostatic heating apparatus...178 Figure A1-5. An alternative embodiment of a transporting means...179 Figure A1-6. A cross-sectional view of a return means for the
transporting means shown in Figure A1-5...179 Figure A1-7. A flow diagram of a combination liquid product line and
particulate product line with a hydrostatic heating
apparatus...180 Figure A1-8. A perspective view of an aseptic mixer...181 Figure A1-9. A schematic illustration of alternative embodiments of the
transporting means...181
Appendix 3:
Figure A3-1. Panasonic AG-6300 VHS recorder and VP110 video
processor...187 Figure A3-2. Location of the ‘THRESHOLD’ button on the VP110 video
processor control panel...188 Figure A3-3. Location of the ‘SECOND FUNCTION’ key on the VP110
Figure A3-4. Location of the ‘EDGE SETTING’ keys on the VP110 video
processor control panel...188 Figure A3-5. Location of the ‘FRAME RATE’ setting keys on the VP110
video processor control panel...189 Figure A3-6. Location of the ‘VIDEO’ key on the VP110 video processor
control panel...189 Figure A3-7. Location of the ‘FULL RATE’ key on the VP110 video
processor control panel...189 Figure A3-8. Location of the ‘HOST’ key on the VP110 video processor
control panel...189 Figure A3-9. Location of the ‘MANUAL’ key on the VP110 video
processor control panel...190 Figure A3-10. Vertical dimensions of cable conveyor...191
Appendix 4:
Figure A4-1. Comparison between the effect of disk design and liquid flow rate on the minimum and maximum speeds of different
diameter polystyrene balls in the x;y and x;z planes...198 Figure A4-2. Effect of disk design and liquid flow rate on the minimum
speed of different diameter polystyrene balls in the x;y
planes...199 Figure A4-3. Effect of disk design and liquid flow rate on the maximum
speed of different diameter polystyrene balls in the x;y
plane...200 Figure A4-4. Effect of disk design and liquid flow rate on the minimum
speed of different diameter polystyrene balls in the x;z
Figure A4-5. Effect of disk design and liquid flow rate on the maximum speed of different diameter polystyrene balls in the x;z
planes...202 Figure A4-6. Effect of disk design and liquid flow rate on the minimum
and maximum net-to-gross-displacement-ratio (NGDR) of different diameter polystyrene balls in the x;y and x;z
planes...203 Figure A4-7. Effect of disk design and liquid flow rate on the minimum
net-to-gross-displacement-ratio (NGDR) of different
diameter polystyrene balls in the x;y planes...204 Figure A4-8. Effect of disk design and liquid flow rate on the maximum
net-to-gross-displacement-ratio (NGDR) of different
diameter polystyrene balls in the x;y plane...205 Figure A4-9. Effect of disk design and liquid flow rate on the minimum
net-to-gross-displacement-ratio (NGDR) of different
diameter polystyrene balls in the x;z plane...206 Figure A4-10. Effect of disk design and liquid flow rate on the maximum
net-to-gross-displacement-ratio (NGDR) of different
LIST OF SYMBOLS
Abbreviation Units
a = number of cells in the initial population...-A = area or cross section area of the pipe or tube...m2 Ac = cross sectional area...m2 Ac = external surface area of can...m
2
Ap = external surface area of particle...m2 As = area of sphere...m
2
b = number of cells in the final population...-Bi = Biot
number...-c = specific heat...J/kg °K cp = specific heat of sphere @ T...J/kg °K cpb = specific heat of medium @ Tb...J/kg °K cpm = specific heat of medium @ Tm...J/kg °K C = confidence level of collecting the “fastest” particle
fraction...-Cpp = particle heat capacity...J/kg °K Cpt = fluid heat capacity...J/kg °K Cp = specific heat at constant pressure...J/kg °K C1 =
Dr = death rate of microorganism...min E(t) = critical particle residence time (fastest, largest)...s F0 = integrated lethality...min Fo = particulate center-point lethality...min g = gravitational acceleration factor...N Gr = Grashof
number...-h = heat transfer coefficient...W/m2 °K
h = heat transfer coefficient associated with flow over a sphere...W/m2 °K h c = convection heat transfer coefficient...W/m
2 °K hD = heat transfer coefficient associated with Dh...W/m2 °K hfp = fluid to particle heat transfer coefficient...W/m
2 °K k = thermal conductivity of the material (sphere) @ T...W/m °K kD = thermal conductivity associated with Dh...W/m °K k(T+10)°C or °K= reaction rate constant at (T+10)°C or
°K...-kb = thermal conductivity of medium @ Tb ...W/m °K km = thermal conductivity of medium @ Tm ...W/m °K kp = thermal conductivity of particle...W/m°K kT°C or °K = reaction rate constant at T°C or
constant...-˙
m = mass flow rate...kg/sec mf = fluid mass...kg mp = particle mass...kg n = constant...-n = natural number...-N = number of surviving organisms...-Nu = Nusselt
number...-NuD = Nusselt number associated with flow over a sphere...-Nub = Nusselt number @ Tb ...-NuD = Nusselt number calculated using Dh ...-P = confidence level for the “fastest” moving particle
fraction...-Pw = wetted perimeter...m Pr = Prandtl number...-Prb = Prandtl number @ Tb ...-PrD = Prandtl number calculated using Dh ...-Prm = Prandtl number @ Tm ...-q = heat conduction...-q”i = heat flux from internal tube to fluid...W/m
2
q”
o = heat flux from external tube to fluid...W/m 2
number...-ReB = Reynolds number @ TB ...-ReD = Reynolds number calculated using Dh ...-t = time...sec ta = time required to reach Ta(0,ta) ...sec
tm = mean residence time...sec tp = time of the process...min T = averaged temperature of sphere...°C or °K T = temperature...°C or °K
u = mean velocity of the liquid...m/sec U = average fluid velocity...m/sec U = overall heat transfer coefficient...W/m2°K Uf = carrier fluid velocity...m/sec Um = velocity of medium...m/sec Ul = liquid velocity...m/sec v = kinematic viscosity of medium @ T...m2/sec v = velocity...m/sec V = volume of sphere...m3 W = weight of product...kg/hr z = slope of the logarithmic thermal death time (TDT) curve...°C or °K
α = thermal diffusivity of a sphere...m2/sec
αp = particle thermal diffusivity...m 2/sec
ξ =
coefficient...-∆P = pressure
drop...-∆T = logarithmic mean temperature difference...°C or °K
∆Tb = temperature change in medium...°C or °K
∆Td = difference between a temperature at a given tube side
and the average at the other side...°C or °K
∆Ti = temperature difference between inlet and the coolant /
heater...°C or °K
∆To = temperature difference between outlet and the coolant
/ heater...°C or °K
∆Tb = temperature change in medium...°C or °K
∆Tp = temperature change in product...°C or °K
η = viscosity of a fluid...kgm/m 3
ηs = fluid viscosity at the tube surface temperature...Pa µ = coefficient of viscosity...Pa sec µap = apparent viscosity...Pa sec µb = viscosity of medium @ Tb...Pa sec µm = viscosity of medium @ Tm...Pa sec µT = viscosity of medium @ T...Pa sec µw = viscosity of medium @Tw...Pa sec
ρ = density of a sphere @ T...kg/m3
ρ = density of the carrier fluid medium...kg/m3
ρb = density of the liquid medium @ Tb...kg/m 3
average...-INTRODUCTION
One of the simplest ways to commercially sterilize a food particulate or liquid food containing particulates is to apply a single thermal process to the fully mixed product. Unfortunately, the use of conventional continuous pasteurization systems, which were designed primarily for liquids and semi-solids, do not currently satisfy either product quality specifications or safety requirements of U.S. regulatory agencies (Marcotte et al., 1994; Simunovic et al., 1995).
When processing particles in a dynamic system, a major challenge is to insure that the intact particles flow through the system in a homogeneous manner. This concern is best addressed using a scraped surface heat exchanger (SSHE) which consists of a double wall tubular heat exchanger in which product is pumped through an inner tube and steam in the outer tube. A mechanical arm located within the product tube continuously scrapes the heat transfer surface which maintains the particles in suspension. This type of heat exchanger may produce an unacceptable product due to the mashing, shearing and tearing of the particles. Moreover, a safety concern exists for products containing porous or hollow particles and viscous fluids since both the particles and fluid may trap air pockets. Because air has a relatively low heat conductivity, porous particles may not receive the necessary heating process to assure commercial sterility requirements.
point (i.e. the cold spot) is at the center of the largest particle with the lowest heat conductivity and minimum residence time (fastest moving particle). Since it is extremely difficult to assess the flow dynamics of the fluid-particulate mixture, the necessary heating that would ensure a safe product and satisfy government regulations may lead to over-heating of one ingredient while insufficiently heating others. In most cases this would result in an unacceptable product due to adverse changes in flavor, color, nutrient content and other physical or chemical properties (Burton, 1988; Ramaswamy et al., 1995).
soup was recently developed by Tetra Pak, the National Food Processors Association, the National Center for Food Safety and Technology, and the Center for Aseptic Processing and Packaging, filed with the FDA and approved on May 31, 1997 (Palaniappan and Sizer, 1997; Rice, 1997). As important as this development may appear, the protocol was only approved for a specific product with a specified particle size. The application of this protocol to other products and other particle sizes will not necessary gain FDA approval since a change in any of the above parameters will effect the residence time of the product.
LITERATURE REVIEW I. Definitions
1. Thermal Death Time
Thermal death time (TDT) is defined as the time required to achieve sterility of a suspension containing a known number of cells or spores at a predetermined temperature. At any specific temperature, the TDT depends on the heat resistance of the cells and the number of cells in suspension. Thermal death times are generally determined for suspensions of a particular organism at several temperatures. The TDT curve for an organism is represented by a straight line where the times necessary for killing are plotted on a logarithmic scale and the corresponding temperatures plotted on a linear scale. Each point on the plot is equivalent to the microorganism or is death efficiency (Banwart, 1981). An absolute reduction to zero organisms is not theoretically possible since destruction rates for most organisms are logarithmic.
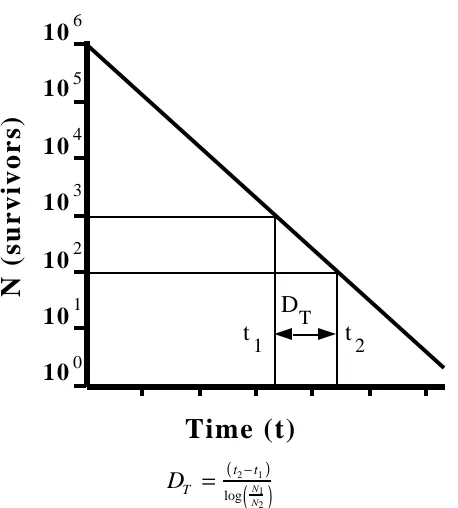
2. D value
Time (t)
N (survivors)
2
t t
1
D
T
100 101 102 103 104 105 106
DT = (t2−t1)
log N1
N2
( )
Figure 1. Derivation of the D value for a given temperature (T) from a graph of the number of surviving organisms (N) versus time (t).
3. z value
10
0 . 0 0 1 0 . 0 1
0 . 1
150 1
Temperature (°C)
0 100 100 50 Z0 . 1
D value (min)
1 . 0
t (min)
D2 T T1 t D1 t D 2 D 1 D2
z= (T2−T1)
log D1
D 2
( )
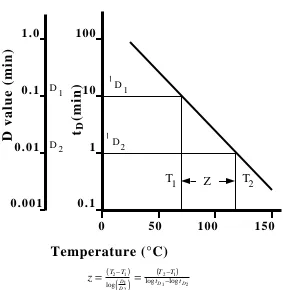
= log t(D 1T2−−Tlog t1) D2Figure 2. Derivation of z value from a plot of thermal death rate (tD) and D value versus temperature.
4. Q10
Q10 values describe a change in a reaction rate as temperature is increased by 10°C.
Q10 =
k[T+10°C] k[ ]T
5. F
The symbol F is used to designate the time (min) necessary for destroying a given number of microorganisms at a reference temperature, usually 121°C for spores or 60°C for vegetative cells (Banwart, 1981).
6. Fo
The F value is the equivalent time in minutes at a given reference temperature, of all heat considered in a process, to reduce the number of spores or vegetative cells of a given organism per unit container as defined by a given z value (Jay, 1992). Because a z value of 10°C is commonly observed or assumed for spores, F values calculated with a z of 10 have become standard and are designated as F0. The reference temperature is usually designated at 121°C. The criteria as to whether a given process has achieved sterilization is based on the thermal destruction of microorganisms and integrating the effects of time and temperature. The basic mathematical model which is widely used for defining F0. is:
F0 = 10
T−Tref ( )
z
0
tp
∫
dtThe F0 value should be determined at the slowest heating point of particles in static systems, and as the minimum residence time in fluid flowing systems. For low-acid foods, it is recommended that the process time and temperature should have F0 values in excess of 4 (Holdsworth and Richardson, 1989).
7. Commercial sterility
Commercial sterility is defined as the absence of viable microorganisms that have public health significance or that are capable of reproducing in the food under normal nonrefrigerated conditions of storage and distribution (Banwart, 1981). In most cases the terms sterility and commercial sterility are interchangeable.
II. Aseptic Processing and Packaging 1. Background
The concept of aseptic processing originated to solve problems associated with conventional ‘in-container’ sterilization of foods. The problems consisted of a low rate of heat penetration to the slowest heating point in the container, long processing times needed to deliver the required lethality, destruction of nutritional and sensory characteristics of the food, low productivity, and high energy costs (Smith et al., 1990).
respect to can size and the frequent blockages of the can-closing machine. Despite these problems, Ball is considered the pioneer of aseptic processing.
The Avoset process was another development in the field of aseptic processing credited to George Grindrod at the Avoset plant located in the San Joaquim Valley of California (Ball and Olson, 1957). A commercial cream product was introduced to the market under the Avoset label in 1942. This process was unique since the filling and closing area was treated to eliminate bacteria, while further protection was accomplished by ultra violet (UV) germicidal lamps (Mitchell, 1988). The area was also enclosed by a wall containing an opening for conveying the finished product. Sterilization was achieved by direct steam injection to a temperature of 260-280°F. The Avoset process is no longer in operation but nevertheless it was another milestone in the development of aseptic processing.
installed in the early 1950’s in California for the production of soups (i.e. split pea soup) and sauces (white, cheese and Hollandaise).
Another historic development occurred in the early 1960’s and was credited to Loelinger and Regez of Switzerland. They attempted to extend the shelf-life of fresh milk without refrigeration using low cost containers. Their successful process used hydrogen peroxide to sterilize flexible packaging materials used in the manufacture of the milk containers (Lopez, 1987). In the U.S., hydrogen peroxide was not approved by the FDA as a package sterilizer until February, 1981 (Cousin, 1993). This approval provided for the use of laminates for consumer-size packages (Ramaswamy et al., 1995).
For approximately 30 years, from it’s inception in the late 1940’s and early 1950’s, aseptic processing witnessed relatively little change. The use of plastic paperboard cartons in the 1960’s was a significant landmark and led to the gradual adoption of this package for UHT (Ultra High Temperature) milk. A shift in the relative prices of the can and thermoplastic-based packages, combined with greater sophistication and performance of the later, has led to the realization that thermoplastic-based packs offer not only a readily accepted package, but one having economic advantages. Largely because of economic considerations, but also perhaps due to customer boredom with older style packages, there has been a resurgence of interest in aseptic packaging composed of plastic and laminates, particularly for holding fruit juices and juice-based products (Rao, 1992).
microorganisms having public health significance. Following cooling, the product is aseptically packaged and hermetically sealed. Rapid heating and cooling of product streams make it possible to exceed temperatures used by conventional in-can or in-bottle sterilization processes. Rapid heating is possible since product is heated by such methods as direct mixing with steam, indirect heating in small diameter pipes, or in thin films between heat exchanger plates. (Swartzel and Jones, 1983).
Desirable changes that occur during APP are inactivation of biological materials such as enzymes, microorganisms and their spores. Undesirable changes are associated with loss of product quality (taste, color, nutrients, etc.). Thus, optimizing thermal processes to minimize product quality losses requires knowledge of reaction kinetics of all quality attributes and the microorganisms.
APP favors process optimization in that increased process temperatures combined with decreased holding times can yield the same lethal effect on microorganisms while at the same time reduce the thermal destruction of desirable food product components (e.g. denaturation of proteins).
Conventional thermal processes which consist of heating food after first sealing in a can or other container requires long heating times, which imply very high energy costs and greater product quality losses (nutrients, flavor, color). Consequently, more rapid and efficient thermal processing technologies such as
HTST aseptic processing have become popular. In 1989, the Institute of Food Technologists described aseptic processing and packaging technologies as the most significant innovation in 50 years.
Aseptic processing can be described as a high temperature short-time heat process for the continuous sterilization and packaging of foods. The process consists of four distinct operations carried out in a closed sterile environment:
1. sterilization and cooling of the product under appropriate heating, holding
and cooling conditions,
2. sterilization of the package,
3. aseptic filling of the cooled sterile product, and
4. aseptic sealing of the package.
The advantages of applying aseptic processing techniques are numerous and include:
1. marketing advantages,
a. continuous sterilization offers optimum heat treatment which results in
more nutritious and better tasting products,
b. continuous sterilization is one answer to the food industry’s constant
search for innovative products, and
c. more uniform product quality from the use of a larger heat transfer
2. economy advantages,
a. lower product costs because of savings in energy and packaging (i.e.
rising cost of conventional cans),
b. extended product shelf life,
c. heat transfer is more efficient, (very high temperatures can be reached
rapidly and maintained for a very short time which translates to a higher quality product. As process temperatures are increased, bacterial destruction rates also increase to a greater extent than product quality deterioration rates), and
d. higher process efficiency.
3. technology advantages,
a. possibility of using a wide variety of packaging materials, shapes and
sizes,
b. the package does not have to be designed to withstand high
temperatures and pressures used for product sterilization since it is sterilized independently by heating, chemically, or by other means. Thus, new packaging materials may be available, and
c. new packaging systems are being developed. When APP was initiated
shapes, from individual packages to bulk storage tanks, including the popular “bag-in-box”.
There are some limitations, associated with this technology. APP usually requires a substantial initial capital investment. Moreover, some systems are designed for a limited range of food products. Control instrumentation for delivering the processing heat treatment is also quite complex and sophisticated (Reuter, 1989; Marcotte et al., 1994).
2. Processing
Food preservation by thermal sterilization is accomplished in one of two ways. In the first method which is referred to as aseptic processing or UHT
processing, the food is first heated to achieve sterility and then placed in a pre-sterilized container and sealed. The second method is the conventional canning method in which the food is first packed and sealed in a non-sterile container and then heated. Sterility in both situations is described as a heat treatment that results in the inability of microorganisms and their spores to grow under conditions normally encountered in storage (Jelen, 1983).
A. Aseptic Processing of Fluids 1. Methods
a. Principles of HTST sterilization
The terms HTST (High Temperature Short Time) and UHT (Ultra High Temperature) describe the use of a process temperature higher than standard temperatures used in conventional thermal processing. In a HTST process, the product is held at 71.7°C for 15 sec or 62.8°C for 30 min, while in the UHT
process the product is exposed to temperatures ranging from 138°C to 149°C for even shorter periods. The sterilization of canned foods is normally carried out by heating the product in hermetically sealed containers for a sufficient time to ensure that all portions of the food receive a minimum heat treatment. Since the packaged food is heated from the outside, different locations within the can receive different heat treatments. To achieve an adequate F0 at the slowest heating point, other areas within the container are often overprocessed. For this reason there are several advantages for using a heat exchanger to uniformly sterilize the product. The use of a heat exchanger enables higher process temperatures to be used for the sterilization process. Furthermore, since there is a logarithmic relationship between microbial inactivation and time and temperature, significant reductions in processing times are possible. For example, the rate of heat inactivation of Bacillus stearothermophilus spores in milk increases 12.5 times for each 10°C rise in processing temperature (Burton, 1975).
The quality advantage which results from the use of the HTST or UHT
(TDT) for microorganisms to the slopes which describe the loss of desirable quality attributes of the food. While the z value for bacterial spores is approximately 10°C, those for thiamin destruction (Jackson et al., 1945; Feliciotti and Esselen, 1957; Mulley et al., 1975), degradation of chlorophyll (Schanderl et al., 1962; Gupte et al., 1964), oxidation of ascorbic acid (Evenden and Marsh, 1948), and the denaturation of serum proteins in milk (Lyster, 1970) average about 33°C. Theoretically, the higher the processing temperature for any sterilization process, the better the product quality. In practice this is limited by mechanical considerations and the possibility of enzyme survival.
b. Kinetic advantage of UHT processing
123 142
120 130 140 150
0 . 1 1 . 0 10 20
0 . 0 1
Quality Loss Level (1
D or 90%)
(50% Quality Loss)
(25% Quality Loss)
Temperature (°C)
Time (min)
Spore Destruction Level (6
D
)
Figure 3. Time temperature relationships for spore destruction and quality degradation levels.
Few methods exist for obtaining kinetic data at high temperatures (≥130°C) and short process times (≤4 sec). Some well established methods for collecting kinetic data include the use of thermal death time (TDT) tubes, TDT
continuous flow conditions. Small batch sizes limit the ability to make comparisons between objective and subjective evaluations. A more recent method utilizing a nonisothermal reactor was developed to eliminate these problems (Swartzel, 1983).
Public health must always be considered in the design of any thermal food process. Since thermal destruction follows a logarithmic pattern, total destruction of all microorganisms can not be theoretically accomplished. In citing several historical references, Lund (1975) discussed this point in relation to Clostridium botulinum. A minimum design criterion of F0 = 2.45 min was established as a 12D destruction ‘bot cook’. However, spoilage is generally due to the survival of spores more resistant than C. botulinum. To balance the destruction rates of these heat resistant spore-forming bacteria with the heat-induced physical and chemical changes in the product, a F0 of 5 min has been generally accepted for low acid, aseptically processed and packaged foods. Nonetheless, for all aseptic processes the proposed F0 value recommended by the different process authorities must first be approved by the FDA. Process authorities are organizations recognized as being able to determine if a process satisfies all applicable regulations and results in a safe product.
process temperatures are low, the overall impact of cooling on the required thermal treatment may need to be considered.
121 143
120 130 140 150
0 . 1 1 10
Temperature (°C)
F value (min)
110 100
135
0 . 0 1 100
Z = 10°C F = 5 min
0
F = 0.2 min (12 sec)
F = 0.03 min (1.8 sec)
Figure 4. F value versus a z temperature of 10°C.
2. Enzyme inactivation
A short come-up time is good for maintaining product quality provided enzyme survival is not a limiting factor. A concern with the application of HTST
However, with HTST processes the treatment may be insufficient for this purpose due to the differing rates of enzyme versus bacterial spore inactivation. The higher z value required for enzymes favors their survival in the HTST temperature range. The result of studies on the thermal destruction of peroxidase in vegetables have established z values from 28-44°C, while that for bacterial spores is in the area of 10°C (Esselen and Anderson, 1956).
B. Aseptic Processing of Particulates 1. Background
In the U.S., there are currently more than 500 commercial aseptic fillers systems devoted primarily to liquid foods (milk, fruit juices, etc.). However, the success and efficiency of aseptic processing makes it equally applicable for continuous sterilization of liquid foods containing large particles. Ramaswamy and co-workers (1995) suggested that there are considerable opportunities for the development of new aseptic shelf stable products containing particulates that were previously marketed as frozen or refrigerated. Until recently the FDA has withheld acceptance of aseptic processing of liquids containing particulates until reliable data is made available on several major aspects of the process: fluid / particle heat transfer coefficients, residence time distribution of particles in the holding tube, and demonstrated assurance that the slowest heating / fastest moving particles have achieved a sufficient thermal treatment to be safe for human consumption (Marcotte et al., 1994).
homogeneous manner. This challenge is best addressed using a scraped surface heat exchanger (SSHE) which consists of a double wall tubular heat exchanger in which product is conveyed through the inner tube while steam passes through the outer tube. A mechanical arm located within the product tube continuously scrapes the heat transfer surface which helps to maintain the particles in suspension. It is important to realize that in a continuous flow system that all particles do not remain in the heat exchanger for the same length of time. Particles residing near the wall (boundary layer), at the entrance and the exit of the heat exchanger, or in dead areas flow more slowly than those traveling in the center of the heat exchanger (Danckwerts, 1953). Therefore, the residence time of particles inside the system is not a fixed value but follows a distribution of times (Burton, 1988). This residence time distribution of food particles is influenced by the nature of the processed food including the characteristics of the carrier fluid and the food particles. The fluid characteristics include: composition, concentration, density, flow rate and rheological properties while the particle characteristics include composition, size, shape, density and particle to carrier fluid concentration ratio.
a. Residence time distribution (RTD) in aseptic processing of particulate foods
Aseptic processing techniques have been successfully applied to liquid foods and acid foods containing discrete and fine particulates. However, the extension of aseptic processing to heterogeneous low-acid liquid foods containing large discrete particulates has been difficult due to the lack of data on critical factors such as interfacial heat transfer coefficient between the liquid and the particle (hfp) and the residence time distribution of particles in the holding tube of the aseptic system. Conventional thermal processing calculations can not be employed for the validation of these processes because of the difficulties associated with gathering experimental time-temperature data at the particle center as it travels through the aseptic system. Both hfp and RTD depend on several factors which may also be interdependent: rheological properties, flow rate, temperature, and density of the carrier fluid; shape, density and concentration of the solid particles; and the holding tube diameter and length. The rheological properties of the carrier fluid have been shown to influence fluid velocity in the holding tube, and intuitively the food particle RTD in both heat exchangers and the holding tubes (Marcotte et al., 1994; Ramaswamy et al., 1995).
coefficient, and the residence time distribution in the heat exchanger and the holding tube (Digman et al., 1989; Heldman, 1989; Heldman 1992; Rao, 1992). i. Requirements for aseptic processing of particulate foods
There are stringent regulatory requirements in North America for the commercial application of aseptic processing to low acid liquid foods containing particulates. The major concern has been the difficulty of obtaining experimental time-temperature data required for predicting the sterilization value delivered by the thermal process. A graphical representation of the time-temperature profiles for liquids throughout the aseptic processing system is illustrated in Figure 5 (Datta, 1991).
Heating Cooling
Flow Through the Aseptic System
Temperature
IN OUT
Holding
Tracer concentration
Time Time
Time
T i m e
With particulates, the prediction of these profiles is extremely difficult although regulations require that the accumulated process lethality (Fo) be calculated:
F0 = E t
( )
0t
∫
×10(Tc−Tr)/ zdt (Datta, 1991)
The use of mathematical models allows maximum flexibility concerning process alternatives while minimizing the extent and cost of process testing. A mathematical model is generally used to estimate the minimum residence time required under the specific conditions necessary to produce the desired lethality. To accomplish this task information is required on the particle to fluid heat transfer coefficient (hfp), particle size, particle shape and thermo-physical properties of the food particle. Both heat transfer and residence time distribution are affected by the fluid flow rate, physical properties and dimensions of the holding tube, and the rheological properties of the carrier fluid (Heldman, 1989; Chandarana et al., 1990). The associated heat transfer coefficient is critical because it affects the time-temperature profile and hence the resulting lethality in the critical food particle.
ii. RTD of food particles in aseptic processing systems
Residence time distribution can be defined as the length of time that different elements spend in the system. Residence time of the fastest moving particle in the heating and holding sections of the aseptic system is very important from a public health standpoint. Of equal importance to product quality is the determination of the mean and maximum particle residence times (Singh and Lee, 1992).
Both heat transfer and residence time distribution factors are related, especially with reference to the rheological properties of the carrier fluids. The degree of turbulence in an aseptic system is estimated from the dimensionless Reynolds number which contains a viscosity term:
( ρ × Uf× D ) / µap
With non-Newtonian fluids, viscosity is a function of shear rate (flow velocity) and the prediction of residence time distribution is more challenging because distorted velocity parabolas are likely present (Richardson and Selman, 1991).
related and dependent factors associated with the food material and the processing system (Abdelrahim et al., 1993a,b).
For aseptic processes involving low-acid particulate foods, a critical factor that influences RTD is the relationship between particle size and the distribution of liquid velocities within the heat exchanger and the holding tube. The type of heat exchanger, its orientation, as well as the configuration of the holding tube are also critical factors that influence the flow characteristics and consequently describe residence time distribution (Lalande et al., 1991). Recently, several research groups have investigated the RTD of simulated and real food particles in
SSHE and holding tubes. These studies were conducted using only one part of the aseptic system (SSHE or holding tube) at below boiling temperatures under atmospheric pressure conditions (Yang and Swartzel, 1991; Yang and Swartzel, 1992; Ramaswamy et al., 1995).
iii. Theoretical background of RTD
Processing System Tracer Input
Signal (stimulus)
Tracer Output
Signal (response)
Random Input
Sinusoidal Input
Pulse Input Step Input
Output
Output Output Output
Residence Time Residence Time
Tracer Concentration
Figure 6. Typical tracer input patterns for determining RTD in continuous processing systems.
major disadvantage is that the necessary process information is packed into a small amount of output response. The E function gives the RTD of the fluid and particles or exit time distribution for any non-ideal flow. A typical E curve is shown in Figure 7.
Total area = 1
t1 Time (sec or min)
Fraction of exit stream
older than t1 E-type Curve for RTD
Population Density {E(t)}
Cumulative Density Function {F(t)}
0.5
0
F-type Curve for RTD
Time (sec or min)
Figure 7. Typical E and F curves for RTD studies in aseptic systems.
The F function is related to the E function by measuring the output response when a step change of tracer is introduced. Consequently, the F function represents the accumulation of the particles at the exit having a residence time of t seconds or less (Figure 7).
The theoretical determination of RTD is usually based on the ideal assumption of either plug flow or perfect mixing conditions. Plug flow is expressed as:
F(t) = 0 ; t < tm
whereas perfect mixing is expressed as:
F(t) = 1 - e-t/tm
The required condition for plug flow in tubular reactors is: over any cross-section normal to the fluid motion the mass flow rate and the fluid properties are uniform and there is only negligible diffusion relative to the bulk flow (Denbigh and Turner, 1984). Thus, the velocity profile is distinctively flat meaning that all fluid elements have the same residence time.
A perfect flow model usually prevails in continuous stirred tank reactors (CSTR) into which there is a continuous flow of reacting material that is thoroughly mixed to the extent that the exit stream has the same composition as the mass within the reactor (Ramaswamy et al., 1995).
iv. Supporting studies
Several studies have been reported to estimate the RTD in continuous sterilization and pasteurization systems of liquid foods. These studies were only applicable to liquid foods and did not consider two-phase flow. RTD for homogeneous liquids in these systems can be easily determined by introducing either radioactive tracers or dyes into the stream.
1. Homogeneous flow occurs when light weight and very fine particles are
encountered, or when the mean flow velocity is sufficient to keep a uniform suspension throughout the flow vessel.
2. Heterogeneous flow is characterized by a large density gradient in the flow to
the extent that the two phases behave like separate streams due to the presence of coarse-dense particles.
3. An intermediate flow regime results from the co-existence of both
homogeneous and heterogeneous flow conditions.
4. Saltation flow occurs when the particles form a bed at the bottom of the flow
vessel and proceed in discontinuous jumps.
5. In capsule flow, the solids are packed in cylindrical capsules of a diameter
slightly smaller than the internal pipe dimensions and are transported in series. None of these flows exactly describe the flow of a liquid/fluid particle mixture although some researchers argue that capsule flow is relevant to aseptic processing especially when particles of 20 mm and larger are considered. Very little is known about two-phase flow under bounded regions such as aseptic food processing systems where the carrier liquid medium is usually non-Newtonian and the particles are heterogeneous in composition and irregular in shape.
v. RTD determination of food particles
solid/liquid two-phase flow have been explored (Yang and Swartzel, 1991; Yang and Swartzel, 1992; Ramaswamy et al., 1995). These methods include visual observation, photography, laser beam, play-back videotaping, radioactive tracers and magnetic response. Each of these different techniques require specific experimental designs and the use of various types of particles and liquid media.
1. The visual observation method includes observing with the human eye with
the help of a stop-watch to calculate the residence time of simulated food particles through a transparent polystyrene tube as influenced by particle size, density and initial input location of the particle. Videotaping can also be used in calculating RTD of particles passing through transparent tubes.
2. In the photography method, a stroboscope slit and camera are used to
determine the instantaneous local velocity of the particles. The photography method is similar to videotaping though it operates in a discontinuous fashion.
3. In comparison, laser beams can be conveniently applied to precisely
determine the local velocity and concentration of particles. However, the optical emission instruments and laser beam signal processing systems are quite expensive.
4. Radioactive tracers alleviate some of the problems associated with visual
5. The magnetic response method employs a magnet tracer which changes an
electromagnetic field when passing through the detector (Figure 8). An example of a new generation of magnetic response detectors is the Hall effect sensor. These sensors produce outputs that vary linearly with the strength of the magnetic field (i.e., the closer the magnet/particle to the sensor, the greater the output voltage). This feature allows for the determination of particle position.
Carrier Fluid
Particle containing magnet
To sensor array input Holding Tube
Hall Effect Sensors
Figure 8. Typical design of the Hall Effect sensors around the holding tube.
of event takes place when the feed and exit ports of the reactor are close together. Dead space, however, occurs when some of the feed is retained in the reactor around corners, baffles, elbows, tube connections or other sites. These obstructions cause an overall reduction in flow. Dead space is also known as ‘hold-back’ and is common with ideal mixing reactors (Danckwerts, 1953). This flow may be viewed as opposite to the channeling type flow.
In the aseptic processing of particulates, ideal flow would be characterized as plug flow having adequate homogeneity. However, plug flow has slow heat transfer characteristics due to a lack of radial and axial mixing. Conversely, perfectly mixed flow is characterized by intensive agitation which promotes heat transfer but boardens the RTD (Lee and Singh, 1991).
b. Heat transfer
Particulate foods are heated and cooled by conduction through several types of heat exchangers. External heat is applied to the outside of each particle which moves inward from molecule to molecule until the center is reached. Heat transfer by conduction depends upon a temperature gradient from the outside to the center of the particles, with the conduction rate varying due to size, shape and composition of the particles. The smaller the particles, the faster the desired center temperature can be reached. When there is a wide range in particle sizes, small particles may be overheated before larger particles are adequately heated (Riez and Wilson, 1964).
while the heavier, cooler liquid sinks. Products are uniformly heated from below or cooled from above as a result of the convection currents that are created. Mechanical circulation is often used to supplement and accelerate heat transfer by convection. A third kind of heat transfer is radiation where heat is transferred from one body to another by means of radiant energy passing through the space (Riez and Wilson, 1964).
In most heat exchangers heat is generally transferred to a product by a combination of conduction and convection, whereas radiant transfer is secondary except where radiant and dielectric heaters are used. Heat always flows from a field of higher temperature to that of a lower temperature.
Heat exchanger calculations are typically carried out to determine the surface area of a heat exchanger required to heat or cool a product to a desired temperature. The quantity of material being processed, the properties of the materials, the process, the type of heat exchanger, and the heat exchanger medium all enter into determining the required amount of surface area. The heat exchanger surface area is the major consideration in the selection of the proper size of heat exchanger (Riez and Wilson, 1964). The heat transfer equation is defined as: A = Q / (U ×∆T) (Riez and Wilson, 1964). i. Heat transfer calculation
figuring heat transfer through condensers or double pipe heaters or coolers, where the inlet and outlet temperatures vary, a true temperature difference between the heating or cooling medium as the product temperature increases is expressed as the log of the mean temperature difference (Whitaker, 1985). The average temperature (Mtd) is given by the following formula:
Mtd= ∆T−∆T 2.3log∆T
∆T
where ∆T > ∆T
For conditions where ∆T < 2×∆T and the simple arithmetic value is within 4% of
the logarithmic value, the following formula can be used to obtain an accurate Mtd value:
Mtd= ∆T+∆T
2 (Whitaker, 1985).
ii. Conduction 1. General
Conduction is defined as the passage of heat from one end of a material to the other end. The conductivity of a substance (K) is based on the energy transmitted per time, per area, per thickness, or per degree difference in temperature on the two sides of the plane. This constant value (K) varies for different materials. Thermal conductivity does change slightly with temperature, but in many applications it can be regarded as a constant (Whitaker, 1985). The Fourier equation for heat conduction represents the heat transfer over time:
2. Conduction through a slab
The energy transmitted over time through a slab is described by the following equation:
q = (k × A ×∆Td ) / L
The overall conductivity of the heat transfer wall is greatly influenced by the conductivity of the surface film of the heating fluid and the material being heated, such that the conductivity of a metal wall is less important than the conductivity of the surface film (Earle, 1966). The conductivity of the system can be greatly increased if the two films move rapidly over the surfaces. Under such conditions, the surface film of the two products is kept at a minimum. It has been found that when a liquid or gas is in contact with a solid surface there is a relatively stationary film of liquid or gas on the surface wall. This film layer thins as its velocity across the surface increases and may break away from the solid wall at very high velocities. Heat is transmitted only by conduction through this film although as soon as the heat has penetrated through the film, the heat is absorbed and carried away by the main fluid body. Most liquids and gases are very poor conductors of heat which means that the liquid films, if moving slowly, offer a great deal of resistance to heat transfer. It is important to note that the factors causing elevated film resistance to heat transfer are: (i) low fluid velocity, (ii) high fluid viscosity, (iii) low fluid conductivity, and (iv) lack of turbulence in the film adjacent to the heat conducting surface (Earle, 1966).
Heat conduction in parallel can be represented using the following formula
while heat conduction in series can be expressed as
∑q = U × A ×∆T = (A ×∆Td )/ {(L1 / K1) + (L2 / K2) + ... + (Ln / Kn)}
Un = 1 / (Ln / Kn)
iii. Convection
With convection heating there are actual currents established in a liquid such that the movement of the liquid actually carries the heat from one location to another. Since warm water is lighter than cold water it will rise while cold water settles, thus forming a current which aides in mixing the product. It is necessary, however, to heat the product on or near the bottom for the circulation to take place.
1. Natural convection
Heat transfer by natural convection occurs when a fluid is in contact with a surface hotter or cooler than itself. As the fluid is heated or cooled its density changes. Buoyancy removes the fluid which has been heated or cooled and replaces it by fresh fluid to enable the heat transfer to continue. It has been found experimentally that convection heat transfer can be described in terms of factors grouped in dimensionless numbers:
The most general equation for natural convection is: (Nu) = K × (Pr)l× (Gr)m× (Lp / D)
n
(Earle, 1966). 2. Forced convection
Forced convection heat transfer occurs when fluid is forced past a solid body and heat is transferred between the fluid and the body. The higher the velocity of the fluid, the higher the rate of heat transfer. In heating or cooling inside a circular tube where there are moderate temperature differences and where tubes are reasonably long and where turbulence is fully developed (Re ≥ 2,100 and Pr > 0.5), the Nu number is calculated using the following equation:
(Nu) = 0.026 × (Re)0.8× (Pr)0.4
For more viscous liquids, the surface heat transfer will be affected depending on whether the fluid is heated or cooled. Under these conditions Re > 1,000, viscosity effects are accounted for by using the equation:
(Nu) = 0.027 × (η / ηs) 0.14×
(Re)0.8× (Pr)0.33
(Earle, 1966). iv. Heat load
Q = m × c ×∆Tp
Approximate specific heats above and below freezing are calculated for most fruits and vegetables based on the average percent water in each product. They are sufficiently accurate for approximate calculations. During a change of state, latent heat is absorbed or released in amounts which vary with the material, the temperature and the pressure.
Heat can also result from an input of mechanical power or friction heat from pumping or agitation which increases as the viscosity of the material and the total power input per unit of product increases. In estimating mechanical heat from friction, the shaft power (in kilowatts) is added to the product.
Food processing operations may, although uncommon, involve exothermic or endothermic chemical reactions which either release or absorb heat thus raising or lowering the temperature of the product or mixture. These factors must be considered when present (Riez and Wilson, 1964).
v. Overall heat transfer coefficient
When considering the transfer of heat through a metallic wall, the wall is considered to be only one of five barriers to the transmission of heat. Scale or fouling on both sides of a wall, the stagnant film of the heat exchange medium on one side, and the material processed on the other side constitute the other four barriers. Stagnant film and scale are the greatest barriers to efficient heat transfer while the wall material is ordinarily less important such that any suitable material (metal or glass) with a higher resistance to heat transfer is used for indirect heat exchanger walls.
Since U values vary for different materials and with different types of heat exchangers operating under many possible conditions, values for U are rarely published (Riez and Wilson, 1964).
1. Logarithmic mean temperature difference
The ∆T represents the driving force which causes heat to flow from the hot side to the cold side in indirect heat exchangers. The temperature difference is not a constant but varies as the product moves through a continuous indirect heat exchanger. When using the logarithmic mean temperature difference, it is assumed that the following conditions exist:
1. there is no change of state,
2. flow rates remain constant,
3. specific heat remains constant through the heat exchanger,
4. the overall heat transfer coefficient U remains constant throughout the heat
exchanger, and
When performing calculations to estimate the size of the heat transfer equipment needed, these five conditions are assumed to be constant. If wide variations exist they should be taken into consideration. Testing of the product in a pilot heater that duplicates actual conditions may give more reliable data for calculating the required heat transfer area (Riez and Wilson, 1964).
2. Overall particulate-liquid thermal energy balance
The overall thermal energy balance for a particulate-liquid food system can be used to calculate the associated convective heat transfer coefficients. The governing equation for heat transfer in such systems can be written as (Deniston et al., 1987):
U× Ac×
(
TR −Tf)
=mf ×Cpt × dTfdt +mp ×Cpp× d Tp
dt
The following factors are assumed for deriving the above equation: uniform initial temperature for the particles, uniform initial and transient temperatures for the liquid, constant heat transfer coefficients, physical and thermal properties for both fluid and particles, and no energy accumulation in the wall. The second term on the right side of the above equation is equal to the heat transferred to particles from the liquid across the particle surface:
mp×Cpp× d Tp
dt =hfp ×Ap ×
(
Tf −Tps)
The heat flow in a spherical particle immersed in fluid can be described by the following partial differential equation (Ozisik, 1985):
∂T
∂t = αp× ∂2T
∂r2 +
2
r + ∂T
∂r