Experimental Evaluation of the Bypass Flow in the VHTR Core
Su-Jong Yoon1), Yun-Je Cho1), Kwang-Yong Kim2), Min-Hwan Kim3), Won-Jae Lee3) and Goon-Cherl Park1) 1) Department of Nuclear Engineering, Seoul National University, Seoul, Korea
2) Department of Mechanical Engineering, Inha University, Incheon, Korea 3) Korea Atomic Energy Research Institute, Daejeon, Korea
ABSTRACT
In the core of Very High Temperature Gas-Cooled Reactor for the hydrogen production, there is the bypass flow that does not pass through coolant holes within the graphite blocks. The main bypass flow path is the gap channel between the core blocks. The amount of effective coolant and the temperature of the outlet coolant decrease as the bypass flow rate increases. Since the bypass flow affects the success of hydrogen production, it is important to evaluate the amount and the distribution of the bypass flow. In this study, the experimental facility to measure the amount of the bypass flow was designed and set up. The measuring experiments and CFD analysis to evaluate the bypass were carried out with several gap sizes and the combinations of the blocks. As the results, the bypass flow ratio increases as gap size, it is independent of the inlet mass flow rate but decreases as the number of fuel block in the unit cell increase.
INTRODUCTION
In past several years, the environmental and economic problems of fossil fuel energy have been on the rise. In order to resolve the problems of fossil fuel energy, the hydrogen energy has been promoted in many countries. Massive production of hydrogen using a nuclear energy is a practical way to feed fuel required for the hydrogen economy and the extensive studies have been carried out on the technological investigation for hydrogen production. By the way, the coolant temperature of Pressurized Water Reactor (PWR) is not high enough to produce the hydrogen. Therefore, Very High Temperature Reactor (VHTR) is being developed for the hydrogen production. VHTR is a gas cooled reactor which uses helium gas as the coolant. The heat from the high temperature helium coolant makes it possible to produce the hydrogen effectively. The prismatic modular reactor (PMR) is a type of VHTR. The reactor core of PMR mainly consists of an assembly of hexagonal graphite elements. Most of the coolant passes through the coolant channels within the fuel blocks of the core, but some fraction of the flow bypasses coolant channels. The core flow that does not pass through coolant channels within the fuel element is called the bypass flow [1]. The bypass flow increases with the bypass flow area due to the fast neutron-induced graphite element shrinkage and core barrel swell during the power operation. The bypass flow affects the temperature distribution, average temperature of the outlet coolant and properties of graphite element. The amount of effective core coolant flow and the temperature of the outlet coolant flow decrease as the bypass flow increases. Therefore, the amount of the bypass flow should be minimized to obtain high temperature of coolant flow enough to produce the hydrogen. In order to minimize the bypass flow, it is needed to evaluate the amount and distribution of the bypass flow exactly. In addition, although the bypass flow is expected to vary from 10 % to 25 % or more of the total core coolant flow [2] the experimental data supporting this expectation have not been reported to our knowledge. Thus, the object of this study is to evaluate the bypass flow by experimental measurement and CFD analysis.
EXPERIMENTS
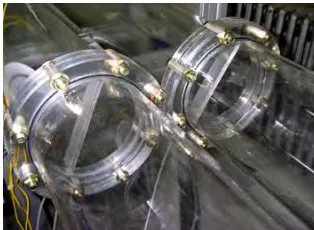
In order to measure bypass flow rate, the unit-cell concept is introduced. The unit-cell is the equilateral triangular section that is formed by connecting the center of three hexagonal blocks in the core as shown in Fig. 1. Experimental facility was designed as shown in Fig. 2. The experimental facility consists of the wind tunnel, test section and blower. The wind tunnel and the blower are installed to make a uniformly distributed flow at the inlet of the test section. The total length and the width of the experimental facility are 7.75 m and 1.4 m, respectively. The length of the test section is 793 mm and the cross-section of the test section is an equilateral triangle of 426.7 mm on a side. Three blocks are installed into the test section. The types of the block are standard fuel block and reflector block. In this study, control rod block and reserve shutdown channel block are not considered. The blocks used in the experiment are one sixth part of the actual core block. Hence cross-sectional area of the unit-cell is one half of single core block. At the inlet of the experimental facility, flow measuring channels are installed to measure the inlet flow rate. The additional channels to measure flow rate are installed at the end of each block to gather the flow passing through the coolant channels within the block. The inner diameter and length of the additional channel are 0.12 m and 1.8 m, respectively. Since the gravitational effect is small and the properties of the helium and air are similar [3] the working fluid is the atmospheric air instead of the helium gas and horizontal direction of the flow is selected. The Bi-Directional Flow Tube (BDFT) (Ref. 4) is used to measure the flow rate as shown in Fig. 3. This mass flow-meter measures the pressure differences between the front and back side of the probe, and converts it to mean velocity of the channel.
G3F1W3 0.3257 G3F2W1 0.1471 G3F2W2 0.3037 G3F2W3 0.4644
2 1
G3F3W1 0.1789 G3F3W2 0.3653 G3F3W3 0.5492
3 0 3
G5F1W1 0.1118 G5F1W2 0.2321 G5F1W3 0.3514
1 2
G5F2W1 0.1562 G5F2W2 0.3197 G5F2W3 0.4858
2 1
G5F3W1 0.1812 G5F3W2 0.3743 G5F3W3 0.5634
3 0 5
Fig. 1 The Concept of the Unit-Cell
Flow-meter (BDFT)
Test Section
Wind Tunnel
Blower
DAS
(Data Acquisition System)Fig. 3 Bi-Directional Flow Tube
CFD ANALYSIS
To evaluate the bypass flow in VHTR core, Computational Fluid Dynamics (CFD) simulations were also performed. In the simulation, a commercial CFD code, CFX-10.0 [5], was used. Figure 4 shows the simulation geometries by using ANSYS Design Modular [6].
(a) Case F3 (b) Case F2 (c) Case F1
Fig. 4 Simulation Geometries for Experimental Facility
Mesh Generation
In the present study, the gap and coolant channels are meshed with hexahedral finite volumes and the other parts are meshed with tetrahedral finite volumes for simulations. The volume meshes were created by the ANSYS ICEM-CFD 10.0 program which supports the creation of both hexahedral and tetrahedral meshes. The numbers of elements in the simulation case F3, F2 and F1 are 2.9, 2.07 and 1.33 millions, respectively. Also, numbers of the nodes are 2.06, 1.42 and 0.81 millions, respectively. Figure 5 shows the mesh used in each part.
(a) Upper Plenum (b) Coolant Hole Channels
(c) Gap Channel (d) Flow Measuring Channels
Fig. 5 Mesh Structures for the Simulation
Turbulence Modeling
Shear stress transport (SST) model with automatic wall treatment [7] based on the Reynolds Averaged Navier-Stokes (RANS) equations was selected as turbulence model. SST model combines the advantages of k-ε model and k-ω model with a blending function. This model accounts for the transport of the turbulent shear stress and gives highly accurate predictions of the onset and the amount of flow separation under adverse pressure compared to other eddy viscosity models [8].
G5F3W1 0.1562 G5F3W2 0.3197 G5F3W3 0.4858
8870.54
G5F3W1 0.1812 G5F3W2 0.3743 G5F3W3 0.5634
1836.409
13305.81
RESULTS AND DISCUSSION
Experimental Results
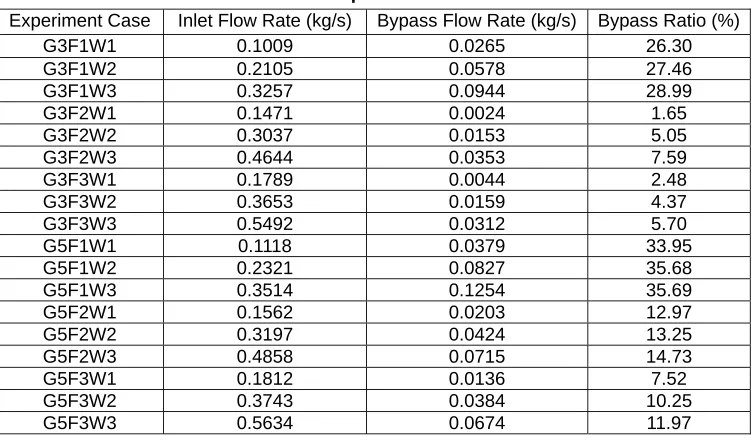
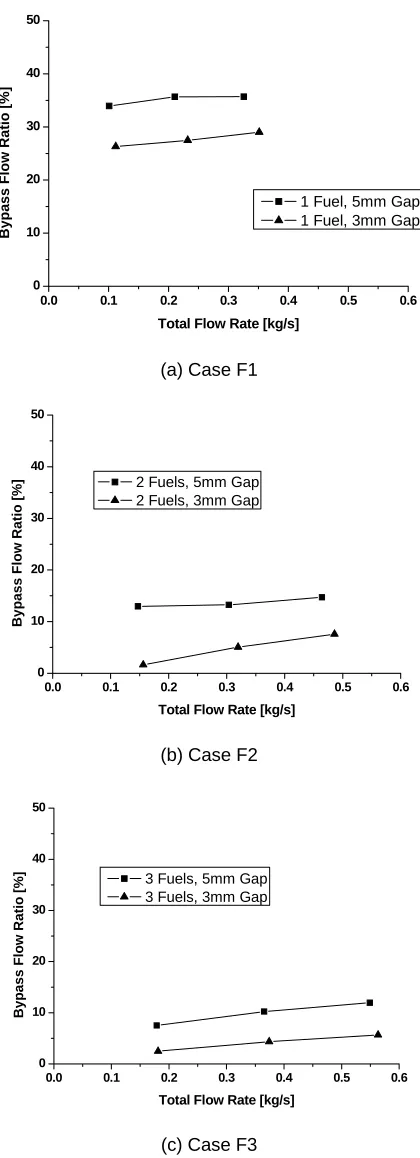
The experiments were carried out to measure the bypass flow rate. The bypass flow ratio measured with various inlet flow condition, the gap size and the number of fuel block. The experimental results are summarized in the Table 3. Figure 6 depicted the bypass flow ratio corresponding to the total flow rate for each gap size. In the case of F1, the ratio of the bypass flow rate to the total flow rate for the gap sizes of 3 mm and 5 mm are 27.6 % and 35.1 % respectively. In the case of F2, they are 4.8% and 13.65 % respectively and in the case of F3, they are 4.2% and 9.91 % respectively. The ratio of the bypass flow rate to the total flow rate has different ranges for the block combination. As the number of fuel block increases, the bypass flow ratio decreases. Since the bypass flow area ratio to the coolant channel flow area was relatively large, the bypass flow ratios of the case of F1 were higher than the other cases. The experimental results show that the bypass flow ratio is dependent on the bypass flow area and the block combination. The bypass flow ratio in the case of F2 and F3 was similar as shown in Fig. 7. The influence of the bypass flow area decreases as the coolant channel area increases.
Table 3. The Experimental Results
Experiment Case Inlet Flow Rate (kg/s) Bypass Flow Rate (kg/s) Bypass Ratio (%)
G3F1W1 0.1009 0.0265 26.30
G3F1W2 0.2105 0.0578 27.46
G3F1W3 0.3257 0.0944 28.99
G3F2W1 0.1471 0.0024 1.65
G3F2W2 0.3037 0.0153 5.05
G3F2W3 0.4644 0.0353 7.59
G3F3W1 0.1789 0.0044 2.48
G3F3W2 0.3653 0.0159 4.37
G3F3W3 0.5492 0.0312 5.70
G5F1W1 0.1118 0.0379 33.95
G5F1W2 0.2321 0.0827 35.68
G5F1W3 0.3514 0.1254 35.69
G5F2W1 0.1562 0.0203 12.97
G5F2W2 0.3197 0.0424 13.25
G5F2W3 0.4858 0.0715 14.73
G5F3W1 0.1812 0.0136 7.52
G5F3W2 0.3743 0.0384 10.25
0.0 0.1 0.2 0.3 0.4 0.5 0.6 0
10 20 30 40 50
By
pa
ss
F
low
R
a
ti
o
[%
]
Total Flow Rate [kg/s]
1 Fuel, 5mm Gap 1 Fuel, 3mm Gap
(a) Case F1
0.0 0.1 0.2 0.3 0.4 0.5 0.6
0 10 20 30 40 50
By
pa
ss
F
low Ra
ti
o [%]
Total Flow Rate [kg/s] 2 Fuels, 5mm Gap 2 Fuels, 3mm Gap
(b) Case F2
0.0 0.1 0.2 0.3 0.4 0.5 0.6
0 10 20 30 40 50
Byp
ass Fl
o
w
Rati
o
[%]
Total Flow Rate [kg/s] 3 Fuels, 5mm Gap 3 Fuels, 3mm Gap
(c) Case F3
0.05 0.10 0.15 0.20 0.25 0.30 0.35 0
Ratio of Gap Area to Total Flow Area
0.05 0.10 0.15 0.20 0.25 0.30 0.35
Ratio of Gap Area to Total Flow Area
(a) Case of Gap Size 3 mm (b) Case of Gap Size 5 mm
Fig. 7 Bypass Flow Ratio corresponding to the Ratio of Bypass Area to the Total Flow Area
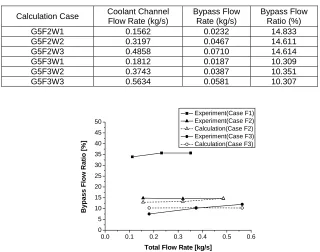
CFD Calculation Results
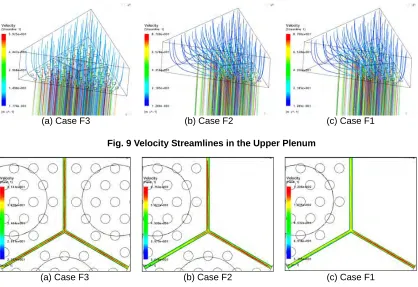
For the gap size of 5 mm and the cases of the three block combinations, the bypass flow rates are calculated. The coolant channel areas in the cases of F2 and F3 are 8870.54 mm2 and 13305.81 mm2, respectively. The simulation results are summarized in Table 4. For each inlet mass flow rate, the mass flow rates through the coolant channels and the gap channel were calculated. The simulation results show that the bypass flow ratio is independent of the inlet mass flow rate. For the case of F3 and F2, the bypass flow ratios to the inlet flow rate are about 10.3 % and 14.6 % respectively. In the calculation results, the bypass flow ratio is independent of the inlet flow rate (total flow rate), but varies with the number of fuel block. These results correspond with the experimental results. The calculation results are compared with the experimental results as shown in Fig. 8. As shown in Fig. 8, the CFD calculation results show good agreements with the experimental results. Figure 9 shows the flow distribution in upper plenum, in which the inlet flow is distributed to the coolant channels and gap channel. In the case of F3, the flow was distributed uniformly. However, in the other cases, the flows in the upper plenum were bended due to the reflector block. Since the flow crossing to the inlet flow occurred in front of the inlet of coolant channels and gap channel, the flow distribution in gap and coolant channels was not uniform as shown in Fig. 9. The non-uniform velocity distributions in the gap channel due to this cross-directional flow were observed as shown in Fig. 10.
Table 4. CFD Calculation Results
Calculation Case Coolant Channel Flow Rate (kg/s)
Bypass Flow Rate (kg/s)
Bypass Flow Ratio (%)
G5F2W1 0.1562 0.0232 14.833
G5F2W2 0.3197 0.0467 14.611
G5F2W3 0.4858 0.0710 14.614
G5F3W1 0.1812 0.0187 10.309
G5F3W2 0.3743 0.0387 10.351
G5F3W3 0.5634 0.0581 10.307
0.0 0.1 0.2 0.3 0.4 0.5 0.6
0 5 10 15 20 25 30 35 40 45 50
By
pa
ss
F
low
Ra
tio
[
%
]
Total Flow Rate [kg/s]
(a) Case F3 (b) Case F2 (c) Case F1
Fig. 9 Velocity Streamlines in the Upper Plenum
(a) Case F3 (b) Case F2 (c) Case F1
Fig. 10 Velocity Distributions in the Gap Channel
SUMMARY AND CONCLUSION
In this study, the ratio of the bypass flow rate to the total flow rate was evaluated locally by introducing the concept of the unit-cell. The research consists of two parts, the experiment and CFD analysis. The experiments were conducted with two gap sizes and three combinations of the blocks. The experimental results show that the ratio of the bypass flow rate to the total flow rate increases with the gap size but decreases with the numbers of fuel block and it is independent of the inlet flow rate. In CFD calculation, calculation results for the cases of gap size of 5 mm are compared with the experimental results. As the results, the calculation results correspond to the experimental results. The CFD code shows the good capability for predicting the bypass flow ratio of the experimental facility. It is observed that the cross-directional flow in the inlet of the gap channel has an influence on the flow rate through the gap channel. This flow could be applied to reduce the bypass flow. Further research for the effect of the cross-directional flow occurred at the inlet of coolant channels needs to be carried out.
REFERENCES
1. Melese, G., Katz, R., Thermal and Flow Design of Helium-Cooled Reactors, American Nuclear Society, La Grange Park, Illinois, 1984.
2. INEEL, Next Generation Nuclear Plant Research and Development Program Plan, INEEL/EXT-05-02581, 2005. 3. Lee, W.J. et al., “Development of MAR-GCR for Gas-Cooled Reactor Analysis-Incorporation of Gas Properties,”
The 10th International Topical Meeting on Nuclear Reactor Thermal Hydraulics, Seoul, Korea, October 2003. 4. KAERI, Development of an Advanced Flow Meter using the Averaging Bi-directional Flow Tube, KAERI/RR-2621,
2005.
5. CFX-10.0, ANSYS CFX-Solver Release 10.0: Theory, ANSYS Canada Inc, Ontario, Canada, 2005.
6. ANSYS Workbench Documentation, ANSYS Workbench Products Release 10.0, ANSYS Canada Inc, Ontario, Canada, 2005.
7. Menter, F. and Esch, T., “Elements of Industrial Heat Transfer Predictions,” 16th Brazilian Congress of Mechanical Engineering (COBEM), Uberlandia, Brazil, Nov 2001.
8. Bardina, J.E., Huang, P.G. and Coakley, T., “Turbulence Modeling Validation,” AIAA Paper 97-2121, 1997.