Vol. 4, Issue 7, July 2016
Segmentation of Remote Sensing images Based
On Representative Features and DSRM using
Fuzzy Logic
Nisy Thankam Varghese, Minu Lalitha Madhavu
M.Tech Scholar, Dept. of Computer Science., Sree Buddha College of Engg., Kerala University, Kerala, India
Assistant Professor, Dept. of Computer Science, Sree Buddha College of Engg., Kerala University, Kerala, India
ABSTRACT: Image classification, which can be defined as identification of objects in a scene captured by a vision
system, is one of the important tasks for remote sensing images. For complex SAR images existing segmentation techniques fails to produce accurate results .This paper proposes an image segmentation method based on similarity of representative features, dynamic statistical region merging (DSRM) and fuzzy logic. Segmentation based on representative features produces oversegmented results. The segmented results are refined based on a dynamic statistical region growing method and uses fuzzy logic for calculating membership grades of pixels to classify pixels into appropriate segments Segmentation results on natural images demonstrate that the presented algorithm produces more robust results than existing techniques.
KEYWORDS: spectral, texture
I. INTRODUCTION
In general an image segmentation is defined as a process of partitioning an image into similar groups such that each region is similar but the union of two adjacent regions is different. For different applications image segmentation has been interpreted differently. For example, it is viewed as a bridge between low level and high level vision subsystems in machine vision applications and as a tool to delineate anatomical structure in medical imaging. Segmentation is depends on different criteria. One of the criterion is the scale parameter, which is an abstract value to determine the maximum change of difference caused by combining different objects. It is dependent on the size of the object. Small scale number results in small objects and large scale number results in large objects, which points into multi resolution image segmentation. The colour is the second criteria which is includes smoothness, which describes the similarity between image object borders and compactness and a perfect square, which describes the closeness of pixels clustered in an object by comparing it to a circle .Neighbourhood function is the last criterion, which compares image object grown with adjacent pixels. Actually the pixel value.
II. RELATED WORK
priori knowledge. Texture is very difficult to characterize .A multiscaletexture analysis procedure for improved forest standclassification [4] utilized two different approaches: local variance and second order statistics. Local image variance is a measure of deviation from the mean withinthe processing neighborhood. This procedure results in a dataset which contains the variance values for all spectral bands. The maximum size of the processing window was set using range values. The next approach isthe second order statistics. This method uses three second order texture measures: angular second moment, entropy and contrast. Angular second moment measureshomogeneity. Entropy is a measure of the amount of the order and repeatability and contrast is the measure of thedegree of spread of the values in the matrix. Watershed method is one of the traditional segmentation method. Itis a mathematical approach. A novel texture preceded segmentation algorithm for high resolution imagery [5]uses a texture preceded algorithm for segmentation. Fastnode merging can be achieved by region adjacency graph depending on a global optimum. The similarity between nodes in the graph is established by a combined distance, composed of texture, spectral and shapefeatures. Then the final segmentation can be obtainediteratively by fast merging. This algorithm can also detect the real object boundaries.The cues of contour and texture differences are exploited simultaneously because natural images contain both textured and untextured regions. Contour and textureanalysis for image segmentation [6] uses algorithmwhich partitions grayscale images into disjoint regions ofcoherent brightness and texture. Contours are treated inthe intervening contour framework, while texture isanalyzed during textons.[7] Used local spectralhistogram representation, which consists of histogramsof filter responses in a local window. This representationprovides an
effective feature to capture both spectral andtexture information. The performance of existing methodcan degrade when choosing a large segment number todeal with a complex scene. The reason is that with morerepresentative features, the least squares solution is moresensitive to noise, and the estimated. Combinationweights might not correspond to actual coveragefractions.
III.PROPOSEDALGORITHM
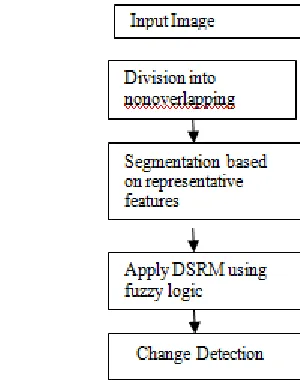
I. THE ARCHITECTURE OF THE PROPOSED SYSTEM IS AS FOLLOWS
Fig 1: Architecture of the proposed segmentation method
A. Proposed Algorithm
Step 1: Select input image
Step 2: Segmentation Based On Similarity of Representative Features i. Divide image into non overlapping blocks.
ii. Apply bank of filters iii. Perform SVD analysis iv. Perform K means clustering
Vol. 4, Issue 7, July 2016
B. Segmentation Based On Similarity of Representative Features
This segmentation method utilizes the spectral and texture representative features for segmentation. Here, we use local spectral histograms to generate combined spectral-texture features.Given an input image window W and a bank of
filters{ , = 1,2, … }, we can compute a sub band image ( ) for each filter ( ) through convolution. For ( ),
we have the corresponding histogram, which is denoted by ( ) .For each filter response here there are used 11 equal
width bins .Concatenation of the histograms of different filter responses is called as a spectral histogram, i.e.,
=| |( , , … … … )(1)
Where |. |denotes cardinality.
The spectral histogram is a normalized feature statistic, which can compare image windows of different sizes. For each pixel location, the local spectral histogram is computed over the window centered at the pixel. The size of the window is called integration scale. When the filters are selected properly, the spectral histogram is sufficient to capture texture appearance
Because spectral histograms can characterize image appearance, we assume that spectral histograms within a homogeneous region are approximately constant.
For each homogeneous region in an image, we define a representative feature, which should be equal to the constant spectral histogram of the region. The feature of each pixel can be regarded as the linear combination of all the representative features weighted by the corresponding area coverage.
Given an image with N pixels, M-dimensional features at each pixel, and L representative features, we use a multivariate linear regression model to associate each feature to the representative features, which is expressed as
Y=Zβ+ε (2)
Where Y is an M × N matrix with each column representing a feature at a pixel location, Z is an M × L matrix containing L representative features, β is an L × N matrix containing combination weights for N pixels, and ε is an M × N matrix representing noise.
Representative features can be computed by manually selecting seeds within each region. Given the feature matrix Y and the representative feature set Z. The connection between the feature matrix and the representative features can be
estimated by computing β. This can be easily solved by the least squares estimation, i.e. β= ( ) (3)
The segmentation result is immediately given by β, where the largest value in each column shows the segment
ownership of the corresponding pixel. It is worth noting that in the solution, all the dimensions of the features are involved to estimate the weights, i.e., to produce segmentation all bands are taken to account. If the representative features are not given, to ensure a unique solution in (3), Z needs to have the full column rank so that ( ) is not singular. Hence, representative features have to be linearly independent.
Since each feature is a linear combination of representative features, the rank of feature matrix Y and the rank of Z should the same, i.e., the number of representative features. However, Y tends to be of full rank because of image noise. Due to the Eckart–Young theorem, we can estimate the underlying feature matrix with the expected rank. Singular value decomposition (SVD) is the basis of low rank approximation.
To the features in the subspace, we can apply K-means clustering where cluster centers corresponds to representative features. By projecting the cluster centers back to the original space, easily obtain the representative feature. When performing k-means clustering a problem can occur. The features near boundaries can form small clusters, which results in clustering very sensitive to initialization. To tackle this problem, measure edgeness for each pixel and neglect the features of pixels with high edgeness before clustering. For the pixel location (x,y), we compute the feature distance between pixel locations (x+d,y) and (x-d,y) and that between (x,y+d)and (x,y−d), where d is half of the side length of
W. Edgeness is the sum of these two distances.
C. Apply Dynamic Statistical Region Merging (DSRM) using Fuzzy Logic
In fuzzy clustering, the centroid of each sub class are estimated adaptively inorder to minimize the cost function.One of the popular fuzzy clustering algorithm, fuzzy C means is been used here.Fuzzy C means utilizes a membership function to estimate the degree of membership of mth object to the nth cluster.
The Fuzzy C Means (FCM) algorithm assigns pixels to each segment by using fuzzy memberships. Let X=(x1, x2,., xN) denotes an image with N pixels to be partitioned into c clusters, where xi represents multispectral (features) data. The algorithm is an iterative optimization that minimizes the cost function defined as follows
J =∑ ∑ uij m || xj - zj ||
ith cluster, zi is the ith cluster center, || || is a norm metric, and m is a constant. The parameter m controls the fuzziness
of the resulting partition. The cost function is minimized when pixels close to the centroid of their clusters are assigned high membership values, and low membership values are assigned to pixels with data far away from centroid.The membership function represents the probability that a pixel belongs to a specific cluster. In the FCM algorithm, the probability is dependent solely on the distance between the pixel and each individual cluster center in the feature domain. The membership functions and cluster centers are updated by the following:
The proposed method uses dynamic statistical region merging algorithm by using fuzzy logic in order to automatically select scale value. The above method results in an oversegmented image which if further refined by using the DSRM combined with fuzzy logic. The algorithm for DSRM using fuzzy logic is as follows,
Start
Step 1:Compute the image gradient Step 2:Sort the image pixels.
Step 3:Build the pixels pairs C1 and C2.
Step 4:Compute the merging predicate: The proposed predicate is based on measuring the dissimilarity between pixels along the boundary of two regions. We obtain the dissimilarity between two neighboring regions R1, R2 ⊆ V as the minimum weight edge connecting them. Since the merging predicate will decide whether there is an evidence of merging between the pair of regions .It involves two aspects: a dissimilarity measure which is used to determine the candidate region for merging, and the consistency property which checks if the regions are homogeneous. We define the following region merging predicate P:
P(R1,R2)=
( ) ( , ) ∈ ( , )
∈ ( , );
( )
WhereΩ1 and Ω2 are the neighborhood sets of R1 and R2, respectively.
Step 5: Update the membership function of the pixels using the fuzzy logic.
End
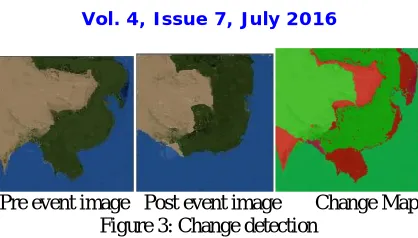
D. Change Detection
One of the most important application of SAR images is to perform change detection. Change detection refers to the process of determining whether any change has been occurred to the study site using the pre event and post event images of the site. In this paper the segmented output of both pre and post event images are used to perform correlation based change detection.
Vol. 4, Issue 7, July 2016
V. RESULTS AND DISCUSSION
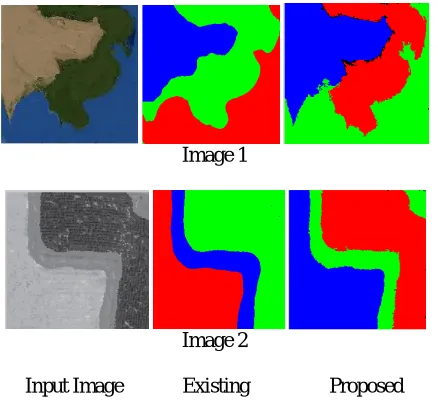
The proposed method was applied to some of the study sites and the results obtained were very accurate when compared to the existing method. Figure 2 shows the results of applying the existing and proposed segmentation techniques on two sites.
Image 1
Image 2
Input Image Existing Proposed
Figure 2. Segmentation using existing and proposed methods
The accuracy of the proposed segmentation method is analyzed using the four parameters such as dice coefficient, RMS error, PSNR and Hausdorff distance.
TABLE I: PERFORMANCE ANALYSIS Image Parameters Exist
ing System
Propo sed System
Image 1
Dice coefficient 0.01 0.05 RMS Error 0.06 0.01 PSNR 49.7 65.4 Hausdorff
distance 11.4 4.5
Image 2
Dice coefficient 0.08 0.09 RMS Error 0.06 0.01 PSNR 50.4 75.4 Hausdorff
distance 10.4 .8
It is evident from the table that the efficiency of the proposed segmentation method is better than the existing method.
Pre event image Post event image Change Map Figure 3: Change detection
Accuracy of change detection is obtained by plotting the confusion matrix and it is found that this change detection method produced 85% accuracy.
.
V. CONCLUSIONS
We have presented a new method for segmenting remote sensing images based on similarity of representative features followed by DSRM using fuzzy logic. DSRM lets the most similar regions to be tested first. Initially, it redefines the dissimilarity based on regions. Then, it dynamically updates the dissimilarity and adjusts the test order during the procedure of merging, followed by updating the membership function using fuzzy logic. Experiments demonstrate that the accuracy of the proposed method is higher than the existing techniques.
REFERENCES
[1] M. Kim, M. Madden, and B. Xu, “GEOBIA vegetation mapping in Great Smoky Mountains National Park with spectral and non-spectral ancillary information,” Photogramm. Eng. Remote Sens., vol. 76, no. 2, pp. 137–149, 2010.
[2] S. Ryherd and C. Woodcock, “Combining spectral and texture data in the segmentation of remotely sensed images,” Photogramm. Eng. Remote Sens., vol. 62, no. 2, pp. 181–194, Feb. 1996.
[3] X. Hu, C. V. Tao, and B. Prenzel, “Automatic segmentation of high-resolution satellite imagery by integrating texture, intensity and color features,” Photogramm. Eng. Remote Sens., vol. 71, no. 12, pp. 1399–1406, 2005.
[4] C. Coburn and A. C. B. Roberts, “A multiscale texture analysis procedure for improved forest stand classification,” Int. J. Remote Sens., vol. 25, no. 20, pp. 4287–4308, 2004.
[5] N. Li, H. Huo, and T. Fang, “A novel texture-preceded segmentation algorithm for high-resolution imagery,” IEEE Trans. Geosci. Remote Sens., vol. 48, no. 7, pp. 2818–2828, Jul. 2010.
[6] J. Malik, S. Belongie, T. Leung, and J. Shi, “Contour and texture analysis for image segmentation,” Int. J. Comput. Vis., vol. 43, no. 1, pp. 7–27, Jun. 2001.
[7] X. Liu and D. L. Wang, “A spectral histogram model for texton modeling and texture discrimination,” Vis. Res., vol. 42, no. 23, pp. 2617–2637, Oct. 2002.
[8] J. Yuan, D. L. Wang, and R. Li, “Image segmentation using local spectral histograms and linear regression,” Pattern Recognit. Lett., vol. 33, no. 5, pp. 615–622, Apr. 2012.
[9]D. J .Marceauand G.J .Hay, “Remote sensing contribution to scale issue,” Can. J. Remote Sens., vol. 25, no. 4, pp. 357–366, 1999.
[10] Jiangye Yuan, DeLiang Wang, Fellow, IEEE, and Rongxing Li, “Remote Sensing Image Segmentation by Combining Spectral and Texture Features”