Achievement Outcomes for Students with Disabilities Under No Child Left Behind. (Under the direction of Dr. Ann Schulte.)
One of No Child Left Behind’s main goals is to increase focus on the accountability of all students, including students with disabilities, by mandating the disaggregation of student scores by student subgroup. However, the disaggregation policy poses problems for schools when applied to the students with disabilities subgroup due to a number of unique
characteristics of this subgroup, such as small sample size and low initial achievement levels. As a result, policymakers have implemented a number of policy variants aimed at
counteracting the negative effects of the disaggregation policy on this subgroup. Although currently implemented, research has yet to evaluate the impact of these policy variants, either in terms of changes in school results for the students with disabilities subgroup or in terms of the validity of the results obtained. This study evaluated school-level outcomes for the students with disabilities subgroup under three policy variants: (a) including students in the disability subgroup for two years after they exit special education, (b) applying different minimum required subgroup sizes and confidence intervals when determining the percent of students reaching proficiency, and (c) substituting a performance index for percent proficient in Adequate Yearly Progress determinations. Multiple analyses were used to evaluate the effect of each policy on schools’ outcomes for the students with disabilities subgroup.
by
Natalie Simona Murr
A thesis submitted to the Graduate Faculty of North Carolina State University
in partial fulfillment of the requirements for the degree of
Master of Science
Psychology
Raleigh, North Carolina 2014
APPROVED BY:
_______________________________ ______________________________
Ann Schulte, Ph.D. Scott Stage, Ph.D.
Chair of Advisory Committee
Biography
Natalie Simona Murr was born on May 31, 1981 in Marbach, Germany. She graduated from H.H. Arnold High School (Wiesbaden, Germany) in 1999 and went on to pursue her Bachelor’s degree in Psychology at the University of Tennessee, Knoxville and her Master’s degree in Comparative Social Policy at the University of Oxford in Oxford, England.
Table of Contents
List of Tables ... v
List of Figures ... vi
Literature Review ... 4
An Overview of Education Legislation ... 4
Special Education Law ... 4
The No Child Left Behind Act (NCLB) of 2001 ... 7
The Problems Posed by Disaggregation ... 8
The Effect of Reclassification ... 9
The Impact of Small Subgroup Sizes ... 17
The Problem of Initially Lower Achievement for the Students with ... Disabilities Subgroup ... 28
Statement of the Problem and Hypotheses ... 36
Hypotheses ... 37
Method ... 40
Data Source ... 40
Participants ... 40
Students ... 40
Schools ... 41
Measures ... 44
EOG-R ... 45
EOG-M... 47
Test Administration and Participation ... 49
School Growth ... 50
Performance Index... 51
Results ... 52
Analyses of Specific Hypotheses ... 52
Hypothesis 1 ... 52
Hypothesis 2 ... 54
Hypothesis 3 ... 56
Hypothesis 4 ... 62
Discussion ... 68
Summary and Discussion of Findings ... 69
Comparisons of Minimum Subgroup Size and Confidence Intervals
Classifications on the Accuracy of AYP Results (Hypothesis 3). ... 70
The Use of Index Scoring in AYP Calculations ... 72
Implications for Policy and Practice ... 73
The Two-Year Post Exit Inclusion Policy ... 73
Increasing the Required Size of the Special Education Subgroup ... 76
The Use of Confidence Intervals in Calculations of AYP ... 79
The Use of Performance Indices for AYP Purposes ... 80
Limitations ... 81
Directions for Future Research ... 84
References ... 87
List of Tables
List of Figures
Figure 1 Example of receiver operating characteristic (ROC) curve for four tests. Adapted from “Understanding Errors in Clinical Medicine” by Jeckel et al., 2007 ... 25 Figure 2 A school’s ability to meet AYP may best be illustrated by the interplay between gains in student achievement (growth) and the school’s ability to meet absolute proficiency targets, or AMOs (performance) ... 33 Figure 3 Weights assigned to each proficiency level compared across two different
The No Child Left Behind Act of 2001 (NCLB) has been described as one of the most important pieces of federal legislation of recent decades (Nagle, Yunker, & Malmgren, 2006; R. Simpson, LaCava, & Graner, 2004). The law is built upon a foundation that emphasizes increased school accountability and educational equality, with the overall goals of improving student achievement, eliminating gaps in achievement between groups of students, and ensuring that 100% of students are proficient by 2014. To accomplish these goals, NCLB required that schools establish grade level proficiency standards (applicable to all but the most severely cognitively impaired students), and then report, at the school, district, and state level, the extent to which students are meeting these grade level standards. In addition, the law holds schools accountable for the attainment of annual performance targets, referred to as adequate yearly progress, or AYP. Increasingly harsh sanctions are imposed on schools that consistently fail to meet proficiency targets.
The emphasis on accountability and assessment underlying NCLB is not new; indeed, both have been essential components of educational reform since the 1950s (Linn, 2000). However, NCLB (2001) is distinguishable from previous legislation by its clear emphasis on school-level accountability for student outcomes. The increased focus on accountability is perhaps best illustrated by the NCLB mandate that schools disaggregate and report
standards. Requiring schools to separately assess and report on the achievement of individual student groups allows policymakers to refocus schools’ attention on learning and academic outcomes for some of the most vulnerable populations, presumably increasing the quality of education, improving achievement outcomes for these students, and reducing the
achievement gap between groups.
Despite laudable intentions, the disaggregation policy has proven to be particularly problematic for schools when applied to the students with disabilities subgroup. Research consistently indicates that a smaller percentage of students with disabilities meet AYP proficiency targets than general education students (Cole, 2006; Mintrop & Sunderman, 2009; M. Simpson, Gong, & Marion, 2005; Ysseldyke & Bielinski, 2002), often for reasons outside of the school’s direct control. NCLB (2001) states that the failure of any one
subgroup to meet annual yearly progress (AYP) will result in an entire school failing; therefore, under current policy, the relatively low performance of the special education subgroup may cause an entire school to fail, even when AYP targets for other subgroups and the general education population have been met (Eckes & Swando, 2009). Thus, concerns about the fairness of the disaggregation policy- especially for schools with significant populations of students with disabilities- have intensified as increasingly large numbers of schools have failed to meet AYP, due to the relatively low performance of the students with disabilities subgroup.
with disabilities subgroup (Allbritten, Mainzer, & Ziegler, 2004; Koretz & Barton, 2003; M. Simpson et al., 2005; Thurlow, 2000; Ysseldyke & Bielinski, 2002), including (a) the impact of reclassification on the composition of the special education subgroup, (b) the effect of small subgroup size, and (c) the effect of lower average test scores for students with disabilities. Each of these issues has proven particularly problematic for the students with disabilities subgroup, as each has the potential to distort student outcomes and jeopardize a school’s ability to meet AYP for this population of students (Kane & Staiger, 2002; Linn, 2000).
Since implementation of NCLB, the United States Department of Education (USDE) has recognized many of the issues inherent in the law’s disaggregation policies and subsequently passed new regulations that grant states increased flexibility in determining annual yearly progress for the students with disabilities subgroup (Keele, 2004; Stephenson, 2006). For example, states are now allowed to determine their own minimum subgroup size and use confidence intervals in their calculations of AYP. Some states have been allowed to also use index scores when calculating AYP for the students with disabilities subgroup. More
recently, the USDE approved a plan submitted by the state of North Carolina to permit more flexible identification of the students with disabilities subgroup by including students who have exited special education services in the disability subgroup.
government for providing opportunities for states to evade NCLB’s accountability policies (Stephenson, 2006) and have questioned whether these policies may result in the unintended consequence of enabling schools to once again exclude students with disabilities from their accountability systems, at least in terms of disaggregated reporting and consequences for failing to meet AYP for this subgroup (M. Simpson et al., 2005). Until now, however, these conclusions remain largely conjecture, as only a few researchers have investigated the effect of these policies on achievement outcomes for the students with disabilities subgroup (Eckes & Swando, 2009; M. Simpson et al., 2005). Thus, the purpose of the proposed study is to evaluate the extent to which these revisions in policy alter disaggregated special education outcomes at the school level in the state of North Carolina.
This manuscript begins with a review of the literature, including a summary of special education legislation and an overview of NCLB’s key accountability and assessment requirements. The next section outlines key challenges to the disaggregation policy as it relates to the special education subgroup, as well as some of the proposed policy responses. Next, a summary of the purpose of the study and its hypotheses are presented. Finally, this manuscript concludes with the method and data analytic plan used to evaluate the study’s key research questions.
Literature Review An Overview of Education Legislation
education, responsibility for the provision of educational services fell exclusively to
individual states (Huefner, 2006; Jacob, Decker, & Hartshorne, 2011). In addition, the lack of mention of education within the US Constitution also meant that citizens were not afforded a right to educational services. Thus, states could- and often did- opt to only provide
educational services to the most able and educable students, thereby excluding more vulnerable groups of children, including students with disabilities (Jacob et al., 2011). It was not until the Civil Rights era of the 1950s and 1960s that individuals began to question the legitimacy of states’ exclusionary educational practices. Building on the national movement for increased equality and integration, special education advocates pushed for integration and equal access to education for all students, including students with disabilities. What followed was a significant shift, both in legislation and practice, to ensure that students with disabilities were provided equal access to the same free and appropriate education as their non-disabled peers (Huefner, 2006; Jacob et al., 2011). The 1954 Supreme Court ruling Brown v. Board of Education provided legal support to the claim that equality of educational opportunity was a right afforded to all citizens by the U.S. Constitution, and required that states provide equal access to educational services to all students. The passing of key
legislation, such as the Education of the Handicapped Act (EHA) of 1970, ensured a focus on the appropriate education of students with disabilities, including their right to an
and 1997, continued to promote the inclusion of students with disabilities in standards-based reform efforts, including state and district-level assessments (Huefner, 2006).
Although seminal to ensuring equality of access to educational services for students with disabilities, legislation during this time did not require that schools be held responsible for the educational outcomes of these students (McLaughlin & Thurlow, 2003). With the passage of the 2004 reauthorization of the Individuals with Education Act (IDEIA), Congress
accountability under NCLB is now closely linked to ambitious content and performance standards, the achievement of similarly high educational outcomes, and ensuring that schools meet AYP targets (McLaughlin & Thurlow, 2003).
The No Child Left Behind Act (NCLB) of 2001. The No Child Left Behind Act was officially signed into law in 2002 by former President George Bush, initiating a series of landmark educational reforms aimed at improving the quality of schools and increasing student achievement. Four key principles served as the basis for this legislation, including (a) stronger accountability for student outcomes, (b) greater flexibility in the use of federal funds for states and school districts, (c) more choice for parents in the selection of high-performing schools, and (d) increased emphasis on scientifically based educational programs and
practices (“Four Pillars,” 2012; USDE, 2002). Of these, NCLB’s accountability policies have produced the most significant demands on schools and school districts, requiring that they modify or redevelop accountability plans and practices to align with the law’s new mandates (“Four Pillars,” 2012; USDE, 2002).
In its goal of increasing student achievement, NCLB required that all states develop and implement strict accountability systems that enable the yearly monitoring of student
in each subject and develop annual performance targets to ensure that all students are
proficient by 2014. These annual performance targets are referred to as AYP (NCLB, 2001). Unlike previous legislation, NCLB’s mandates extend beyond simply determining how a school should be held accountable for student achievement to also identifying who should be encompassed within these requirements. The law requires that schools not only report
outcomes for their student population as a whole, but also to disaggregate proficiency data by subgroups of students that are historically at risk for low achievement, such as students with disabilities, or who are ethnic minorities or economically disadvantaged. Schools must also show that they have met AYP by evidencing (amongst other things) that at least 95% of all students in general education, as well as 95% of each subgroup of students, have participated in assessments. In addition, schools must meet the proficiency targets (referred to as annual measurable objectives, or AMOs) set by the state in each subject. By the time both academic and participation targets have been applied to each student group and for each academic area (i.e., for reading and math), schools may face up to 41 possible targets that they must meet in any given year to pass AYP (AYP in Pennsylvania, 2006). Schools that fail to meet AYP will be identified for improvement or face a number of other federal sanctions.
The Problems Posed by Disaggregation
the performance of vulnerable groups, including students with disabilities (Hardman & Dawson, 2008; McLaughlin & Thurlow, 2003; Mintrop & Sunderman, 2009; Thurlow, 2000). However, the disaggregation policy presents unique challenges when applied to the students with disabilities subgroup. Three of these challenges, including the effect of
reclassification, the impact of small subgroup size, and the effect of lower average test scores for students with disabilities entering elementary school, will be addressed in the following sections.
The effect of reclassification. One of the main purposes of NCLB’s disaggregation policy is to enable educators and policymakers to monitor the performance of vulnerable students, including students with disabilities. By disaggregating student scores by subgroup, schools may determine whether these students are benefiting from educational practices and policies and achieving required levels of proficiency as mandated by NCLB (Linn, Baker, & Betebenner, 2002). To evaluate the performance of student subgroups, the disaggregation policy requires the use of a single group case study design, in which each subgroup’s
performance in a given year is compared against the state’s AYP targets (Stevens, 2005). The results of these analyses are then used to determine which subgroups have met AYP
expectations during that school year. In addition, these results are also compared across years as an indicator of trends in performance across time and subgroup.
application of the disaggregation policy to the students with disabilities subgroup has proven particularly problematic when viewed from a statistical perspective. As Ysseldyke and Bielinski (2002) noted, comparing the performance of a group of students against a predetermined standard, such as AYP, requires that the comparison group be both clearly defined and consistent. Any variation in the composition of the comparison group may distort results, especially if such results are used to analyze changes in average test scores or trends in student performance from year to year (Kane & Staiger, 2002; Linn, 2000; Linn et al., 2002; Stevens, 2005). However, this requirement is not often met by the special education subgroup, as student reclassification often results in frequent transitions into and out of special education, thereby jeopardizing the stability of the subgroup. In their investigation into the magnitude of the effects of reclassification, Ysseldyke and Bielinski (2002) found that up to 20% of the special education population exited or entered special education in any given year, resulting in significant fluctuations in the composition of the subgroup.
effects of reclassification, Ysseldyke and Bielinski (2002) analyzed the mean reading
performance of over 200,000 students on the Texas Assessment of Academic Skills (TAAS) reading test. Average reading performance was calculated and compared in four groups of students over a period of four years: (a) students remaining in general education, (b) students moving from general education to special education, (c) students moving from special education to general education, and (d) students remaining in special education. Results of this analysis indicated that the average reading performance of the special education students (group D) was consistently lower than the average reading score for students leaving special education (group C) across the four years. Thus, students who left special education and returned to general education had higher average reading scores than those who remained in special education. Furthermore, the average reading performance of students entering special education (group B) was lower than the average reading performance of both students in special education (group D) and those transitioning back into general education (group C), indicating that low academic performance was consistently associated with student
transitions into special education. In fact, the mean difference between the average reading scores of students leaving special education and those entering was, in some instances, as great as .75 standard deviation units.
exited from special education. As a result, these students’ higher performance levels are unlikely to be included in subsequent analyses of subgroup performance results. In fact, only the results of students currently in special education, and those who have recently entered, are included in these calculations and are, as Ysseldyke and Bielinski (2002) evidenced, likely to be relatively low. This characteristic of the group of students served in special education is particularly problematic in an accountability system that links school success and sanctions with expected student gains towards proficiency.
Together, the instability of the special education subgroup and the concentration of lower performing students in this group pose significant challenges to a school’s ability to meet AYP expectations. By failing to account for student transitions into and out of special education, special education group proficiency results are unable to capture individual
services during this first year were defined as special education students, regardless of whether they continued to receive services in subsequent years of the study. As the name suggests, this approach to defining group membership allowed special education status to be held constant, regardless of any actual transitions into or out of special education programs. The cohort-dynamic approach, on the other hand, redefined group membership each year according to whether each student received special education services in that year or not. Unlike the cohort-static approach, transitions into and out of special education were not held constant within the cohort-dynamic approach, as each student’s membership was redefined each time he or she is entered or exited special education services.
special education students), and then dividing this by the standard deviation of the test scores for the reference group. In reading, effect sizes increased from -.48 in 4th grade to -.93 in 8th grade, a difference of almost .50 standard deviation units. A similar drop was observed for mean student performance in math, and effect sizes increased from -.64 in 4th grade to -1.16 by 8th grade. Thus, the achievement gap between general and special education students when defined using the cohort-dynamic approach increased substantially across grades. When special education membership was defined using the cohort-static method, however, a more positive trend was observed. For the cohort-static group, mean student performance in both reading and math actually increased slightly from 4th to 8th grade. During this time, effect sizes for the reading test decreased from -.48 to -.42; in math, a similar increase in effect size between 4th and 8th grade was observed.
when reclassification was not accounted for and special education status was redefined each year (the cohort-dynamic approach), the size of the achievement gap increased steadily across time points.
special education students grew smaller over time. This pattern was not observed in
Ysseldyke and Bielinski’s original study, and suggests that a narrowing of the achievement gap between these subgroups of children is possible when the transitory nature of special education is accounted for.
In summary, researchers have clearly recognized the challenges posed by the instability of the special education subgroup, as well as the implications that frequent student transitions into and out of special education may have on a school’s ability to meet AYP for the students with disabilities subgroup. In addition, researchers have identified the use of alternate
approaches to the definition of special education group membership that account for the inherent instability of the subgroup, thereby providing a more accurate representation of performance for students with disabilities. In recognition of the problem of reclassification, the state of North Carolina recently revised its accountability plan to allow for the more flexible identification of the disaggregated special education subgroup. Specifically, the revised North Carolina Accountability Plan now states that:
Starting with the 2008-2009 school year, students previously identified as students with disabilities (SWD), who have exited SWD identification during the last two years, were included in the calculations for determining the status of the SWD subgroup for AYP only if that subgroup already met the minimum number of 40 students required for a subgroup (Education, 2010).
disabilities subgroup, thereby replicating the cohort-static approach to defining special education group membership.
However, although research supports the notion that redefining special education group membership can substantially affect the size of the achievement gap between general and special education students, no empirical evidence exists to indicate that these definitional approaches have any effect on school-level achievement outcomes. Although the cohort-static approach may enable schools to account for the increased performance of students who recently exited special education, overall achievement for this subgroup may continue to fall short of the school’s AYP target. Thus, the purpose of the proposed study is to empirically evaluate the extent to which North Carolina’s two-year post exit inclusion policy (described above) affects school-level outcomes for the students with disabilities subgroup. In addition, this study will determine whether the implementation of this policy significantly alters the percent of schools in North Carolina meeting AYP proficiency targets for the students with disabilities subgroup.
The impact of small subgroup sizes. Reclassification and the transitory nature of the special education subgroup have the potential to jeopardize the validity of performance measures for the students with disabilities subgroup. In addition, other sources of volatility on school-level measures of performance, including sampling error and non-persistent effects on student learning (e.g., a particularly disruptive child in the classroom), all have the
potential to distort not only the validity, but also the reliability, of measures of school
The issue of small subgroup size is particularly problematic for the students with disabilities subgroup, as the most commonly used subgroup size across states is approximately ten students (Eckes & Swando, 2009). When sample sizes are this small, even the low achievement of a few students can significantly distort overall group performance results (Eckes & Swando, 2009; Kane & Staiger, 2002).
As noted by Schulte and Villwock (2004), the problem of small subgroup size poses significant problems in an accountability system which emphasizes school-level
disaggregation and reporting of student outcomes. First, the standard error of measurement for many large scale assessments only becomes small enough to allow reliable detection of changes across time when results are cumulated across sample sizes of approximately 25-30 students; however, the maximum number of students within special education classrooms (or within the special education subgroup in a school) is often below this threshold. Furthermore, calculations of special education outcomes may be influenced by a myriad of school-level factors unrelated to students’ actual performance, including a particular school’s special education classification process, frequent transitions into and out of special education, and differences in special education cohorts from one year to the next (e.g., student ability level). The negative effect of these factors is only confounded by small sample size, and is therefore more detrimental to the students with disabilities subgroup than other student populations within a school (Schulte & Villwock, 2004).
different measures of school performance: (1) the percent of students meeting grade-level proficiency targets, (2) the percent of students achieving high growth expectations, and (3) longitudinal examination of each student’s proficiency across his or her elementary-school years. The first method (percent of students meeting grade-level proficiency targets in a given year) mirrors the approach currently required by NCLB in determining whether each school- and each subgroup within each school- has met AYP targets. Results of this study clearly illustrated considerable variability in the percent of students with disabilities
achieving grade level proficiency across schools when the current NCLB method was used to calculate student outcomes. In the first year of the study, the percent of students with
disabilities meeting proficiency standards in reading across schools ranged from
approximately 37 to 80%, a difference of 43 percentage points. In comparison, the percent of general education students meeting proficiency standards in the first year of the study ranged from approximately 85 to 93%, a difference of only eight percentage points. Similar patterns were observed in years two and three of the study. Thus, greater variability in student
outcomes was found between schools’ special education groups than between their general education populations. The greater variability exhibited by special education subgroups may be due to the relatively small size of these samples, and the fact that smaller samples are more susceptible to the influence of sampling error than larger, more homogenous groups (Stevens, 2005).
of those subgroups that met this minimum size. Schools with too few students to constitute a subgroup would not be required to report disaggregated student results, but would instead automatically be counted as having met AYP expectations for that subgroup (NCLB, 2001). In response to growing concerns about the reliability of performance results based on small subgroup sizes, however, the USDE recently passed more flexible regulations allowing states to increase the minimum number of students required to form a subgroup (Erpenbach, Forte-Fast, & Potts, 2003; Forte-Fast & Erpenbach, 2004). In addition, the USDE has also
approved the use of confidence intervals in AYP calculations (Forte-Fast & Erpenbach, 2004).
The recent changes in the government’s regulations concerning subgroup size and confidence intervals prompted researchers to more fully investigate the effect of these
policies on schools’ ability to meet AYP. As an example, M. Simpson et al. (2005) evaluated schools’ ability to meet AYP for the special education subgroup at various minimum
special education group was automatically passed because they did not have enough students to meet the minimum sample size required for accountability purposes. Finally, school passing rates were calculated at varying minimum subgroup sizes (between 10 and 100) and confidence intervals (70%-99%) to evaluate whether passing rates were affected by
fluctuations in minimum cell size and interval level.
Results of the M. Simpson et al. (2005) study clearly indicated that, in each of the five states evaluated, an increase in minimum cell size was strongly associated with a school’s ability to meet AYP. In one state’s analysis, the percent of schools meeting the state AMO using the largest observed cell size (100) was almost 60 percentage points larger than the percent of schools in that same state meeting AMO when the minimum cell size was set to 10. On average, states showed a 32% increase in schools meeting AMO targets when passing rates were calculated using a minimum-n of 100 versus a minimum-n of 10. A similar
Although the results of M. Simpson et al.’s (2005) study appeared to provide support for the use of increased subgroup size and confidence intervals, the authors warned that the increase in the percentage of schools using these methods had negative implications for the inclusion of students with disabilities in state accountability systems. In their analysis, the authors noted that only 20% of the schools meeting the special education subgroup AMO did so while still assessing the performance of this subgroup; the other 80% were only able to meet the subgroup AMO by raising the minimum subgroup size to a level which no longer required schools to account for the performance of the students with disabilities subgroup. In other words, the vast majority of schools were only able to meet state AMOs by exempting themselves from NCLB’s accountability provisions (M. Simpson et al., 2005).
school passes AYP due only to an inability to meet required subgroup sizes, this information is not accurate.
Thus, one of the drawbacks to the policy of increasing required minimum subgroup sizes is that it may create a dichotomy between a school’s official AYP status and the ‘truth’ regarding student performance. In addition, this dichotomy limits the policy’s ability to accurately differentiate between successful and failing schools, and increases the potential for invalid inferences to be made regarding school and student performance. In order for the required minimum subgroup size policy to be useful, therefore, it is essential that
policymakers be able to judge the policy’s accuracy and precision.
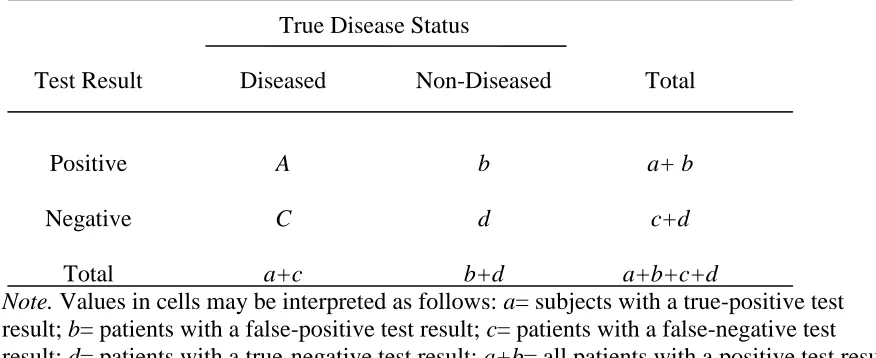
false-positive error rate. This type of error relates to the rate at which a test incorrectly labels non-diseased individuals as having the disease. A test’s specificity and false-positive error rate always add up to 1.0 (100%); thus, they, too, are inverses of one another.
Table 1
Comparison of Patients’ True Disease Status and Screening Test Results
True Disease Status
Test Result Diseased Non-Diseased Total
Positive A b a+ b
Negative C d c+d
Total a+c b+d a+b+c+d
Note. Values in cells may be interpreted as follows: a= subjects with a true-positive test result; b= patients with a false-positive test result; c= patients with a false-negative test result; d= patients with a true-negative test result; a+b= all patients with a positive test result; c+d= all patients with a negative test result; a+c= all patients with the disease; b+d= all patients without the disease.
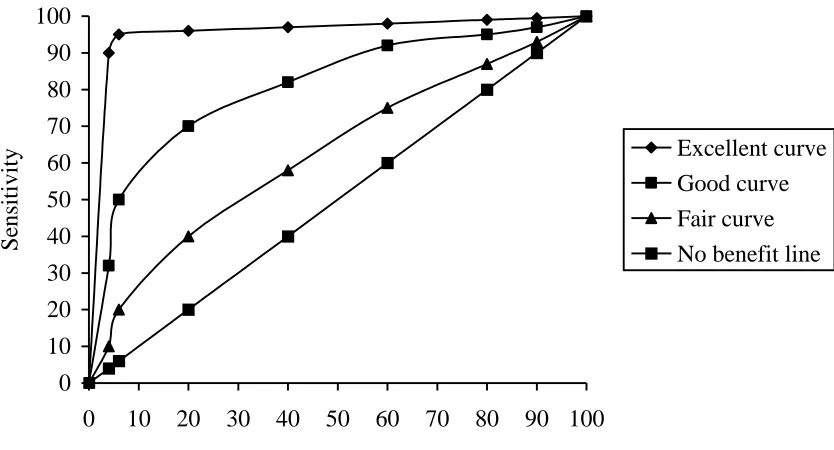
provides an example of such a ROC. As illustrated, a screening tool is considered most useful if it has a high rate of sensitivity and low false-positive error rate.
0 10 20 30 40 50 60 70 80 90 100
0 10 20 30 40 50 60 70 80 90 100
False-positive error rate (percentage)
S
ensit
ivi
ty Excellent curve
Good curve Fair curve No benefit line
Figure 1. Example of receiver operating characteristic (ROC) curve for four tests. Adapted from “Understanding Errors in Clinical Medicine” by Jeckel et al., 2007.
Table 2
Comparison of Schools’ True AYP Status and Minimum Required Subgroup Policy Results
True AYP Status
Policy Result Failed Passed Total
Failed a b a+ b
Passed c d c+d
Total a+c b+d a+b+c+d
Note. Values in cells may be interpreted as follows: a= schools with a true-positive test result; b= schools with a false-positive test result; c= schools with a false-negative test result; d= schools with a true-negative test result; a+b= all schools with a positive test result; c+d= all schools with a negative test result; a+c= all schools that did not truly meet AYP; b+d= all schools that did truly meet AYP.
Unfortunately, M. Simpson et al.’s (2005) study suggests that the required minimum subgroup size policy may fail such accuracy tests, as the false-negative error rate actually increases as the minimum required subgroup size gets larger. It is due to this unintended consequence of the government’s regulations concerning minimum sample size and
due to genuine concerns regarding the reliability of school performance measures, and those who seek a way of eluding NCLB’s accountability requirements, Stephenson (2006) warned that the new regulations may provide schools with a mechanism for manipulating AYP results to their benefit. Thus, although these regulations were originally developed to address concerns about the reliability of subgroup performance measures, the resulting exclusion of students with disabilities from large-scale assessments creates new concerns about the validity of AYP determinations (Stephenson, 2006). As summarized by M. Simpson et al., If the implicit theory of action guiding NCLB accountability requirements is to improve instruction and thus outcomes for all students, schools and districts must be accountable for all subgroups in order to ensure that these students are appropriately served. Therefore, tinkering with the minimum-n to exclude substantial portions of
special education students must be considered a threat to the validity of the Accountability system (2005, p.23).
confidence intervals on schools’ ability to meet (or be exempted) from AYP thresholds for their disability subgroup. In addition, this study empirically evaluated the extent to which the use of different minimum sample size thresholds results in the exclusion of the students with disabilities subgroup from North Carolina’s accountability system.
The problem of initially lower achievement for the students with disabilities subgroup. As noted previously, NCLB’s accountability mandates require each state to identify annual measurable objectives (AMO) that outline the specific percentage of students in each subgroup and the general education population who must meet designated
percentage was larger than the percentage identified in option a above. Separate starting points were calculated for both reading/language arts and math (USDE, 2011).
As such, initial starting points, as well as the difference between these starting points and the 100% proficiency target, differ substantially from state to state, creating great variability across states in the amount of gains in student performance expected. In addition to the variability between states, there is also substantial variation in individual school’s starting performance within a state, and the difference between these starting points and percent proficiency targets. Schools with lower starting points will have further to go in ensuring that all students meet expected proficiency targets relative to those schools with higher initial percentages of proficient students. As Linn et al. (2002) noted, NCLB’s required method for calculating starting points creates a situation in which states start off on an unlevel playing field, and this same concern extends to individual schools.
Thus, absolute proficiency targets may be more or less attainable, depending on the beginning level of proficiency of the school or population of students trying to reach them. For the students with disabilities subgroup, meeting state AMOs might prove particularly difficult, as these students are repeatedly shown to have lower average performance levels than their general education peers (Eckes & Swando, 2009; M. J. McLaughlin, 2006, USDE, 2011). Ysseldyke and Bielinski (2002) provided evidence for the gap in performance
education students in three states. Results of this study confirmed that not only was the proficiency level of the students with disabilities subgroup lower than the general education group at baseline, the size of this achievement gap remains stable across grades. In regards to meeting state AMOs, students with disabilities therefore need to demonstrate larger gains in proficiency than general education students in order for the school to meet AYP targets. Given the potential consequences that a low-achieving group may have on a school’s ability to meet AYP, it is important to identify those factors that might contribute to a subgroup’s lower proficiency. In the case of the special education subgroup, students with disabilities differ from students in the other subgroups in that many possess limitations in their ability to learn (Eckes & Swando, 2009). Furthermore, the very definition of disability posits the condition as something internal to the child, and outside of the control of the school. Although research has shown that access to a high-quality curriculum can result in increases in student learning and improved educational outcomes for students with
As noted previously, a school’s AYP determination is based on the ability to demonstrate that each subgroup of students meets an absolute level of proficiency on large-scale
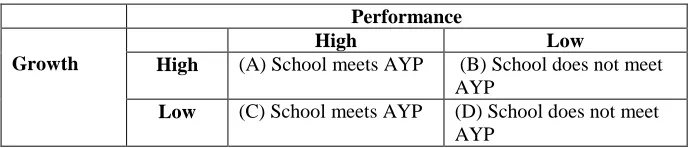
deemed proficient on large-scale assessments) and high performance (the school or subgroup meets the state AMO). These schools will, appropriately, meet AYP targets. Conversely, a school evidencing low growth and low performance (group D) will fail to meet AYP targets. In some instances, however, AYP determinations may lead to invalid inferences
regarding school quality and performance. For example, a particular subset of schools (group B in Figure 2 below) may succeed in substantially increasing the percentage of students meeting proficiency targets on large-scale assessments (high growth), but still fail to meet AYP (low performance). In this scenario, schools evidencing significant gains in student achievement are not credited for their success. This is particularly problematic for schools with significant populations of students with lower average performance, including students with disabilities. In both these instances, the lower starting performance of students means that a school must demonstrate unrealistically large gains in student proficiency in order to bridge the gap between its starting point and expected levels of achievement, or risk failing AYP. Additionally, the fourth group of schools represented in Figure 2 (group C) may fail to evidence significant student gains in achievement (low growth), but still meet NCLB’s absolute proficiency targets (high performance). Schools within this latter category typically begin with higher starting points, and therefore do not need to evidence large gains in
Performance
Growth
High Low
High (A) School meets AYP (B) School does not meet AYP
Low (C) School meets AYP (D) School does not meet AYP
Figure 2. A school’s ability to meet AYP targets may best be illustrated by the interplay between gains in student achievement (growth) and the school’s ability to meet absolute proficiency targets, or AMOs (performance).
Accountability Model Status/Percent
Proficient
Performance Index
Proficiency Level
Advanced 1.0 1.0
Proficient 1.0 1.0
High Basic 0 0.8
Low Basic 0 0.6
High Below Basic 0 0.4
Low Below Basic 0 0.2
Not Assessed 0 0
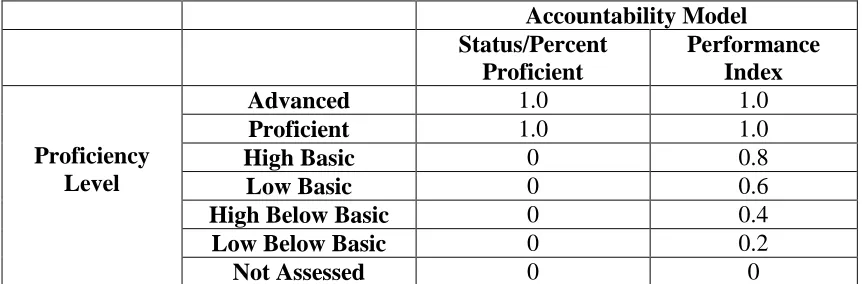
Figure 3. Weights assigned to each proficiency level compared across two different accountability models.
As illustrated in Figure 3, the Performance Index awards partial credit to schools for students who fall below the Proficient level. Thus, schools that succeed in moving students from the Low Basic to the High Basic level, for example, will be rewarded by receiving a score of 0.8 points for each of these students. In contrast, the status model only recognizes student improvement if it results in moving students from below proficiency to the
proficiency cut-off or above, regardless of how much improvement may have been observed in students below this cut score. The goal of both models remains the same: to obtain an average score of 1.0 (equivalent to 100% proficiency) for all students, including each student subgroup, by 2014. The difference, however, is that a performance index allows the inclusion of all students’ achievement, regardless of where on the proficiency spectrum these
improvements occur, thereby providing a more valid and representative indication of how well students within a school are performing, on average, in any given year.
state’s accountability plan since NCLB was signed into law in 2001. As of 2007, the USDE had approved the use of index scores in calculations of AYP in 12 states (Erpenbach, 2009). Since then, limited and mixed evidence has been published regarding the impact of
performance indices on states’ AYP determinations. In one evaluation of the impact of Pennsylvania’s Performance Index (PPI), Erpenbach (2009) noted that the percentage of schools meeting AYP was less when calculated using only the PPI (30.8%) than when AYP was determined using the Status model (45.3%). However, when PPI was used in
combination with the status/percent proficient and the Safe Harbor (a policy that enables schools to meet AYP if they are able to evidence a ten percentage point decrease in the number of students not proficient in any particular area) models, the total number of schools meeting AYP increased to 74.4%. The situation appears only slightly more positive in New Hampshire. Here, Erpenbach (2009) reported that more than half of schools met proficiency index targets in both reading and math (61.3 and 55.8%, respectively); however, no
comparison data were provided as to the number of schools meeting AYP under the status model.
Despite initial mixed results, few studies have attempted to empirically evaluate the effects of performance indexing on school-level student outcomes. Thus, this study proposes to evaluate the relationship between two AYP models (percent proficient and a proficiency index) and school growth. One of the advantages of using a performance index is its ability to credit schools for all increases in student performance, regardless of whether these
use of a proficiency index is a better predictor of growth in schools than is the current percent proficient model. If this holds true, the application of performance indices might yield more valid indications of a school’s performance and ability to raise student achievement than is currently feasible within a percent proficient model.
Statement of the Problem and Hypotheses
The No Child Left Behind Act (2001) has placed significant pressure on schools to increase student performance, with the overall expectation that 100% of students will be proficient by 2014. In addition, NCLB’s disaggregation policy holds schools accountable for the achievement of individual student subgroups, including the students with disabilities subgroup. By holding schools accountable for the achievement of all children, and not just those in general education, policymakers hope to reduce achievement gaps between groups of students and ensure that all children have the opportunity to benefit from a high-quality education.
achievement status of SWDs and the performance of schools that serve them: (a) the impact of reclassification on the composition of the special education subgroup, (b) the effect of small subgroup size, and (c) the effect of lower test scores, on average, for students with disabilities. Each of these issues has the potential to distort achievement outcomes for the special education subgroup, thereby jeopardizing the accuracy of inferences made about student and school performance.
The purpose of the proposed study is to empirically evaluate the effects of different variants of school-level disaggregated reporting policies on the students with disabilities subgroup. More specifically, this study proposes to assess school performance under three different policy variants: (a) the two-year post exit inclusion policy, which allows schools to include the achievement results of students who exited special education up to two years prior in calculations of AYP; (b) increased minimum subgroup sizes and the use of confidence intervals; and (c) the use of index scoring in AYP determinations. Hypotheses
1. Schools will demonstrate an absolute change in the percent of students with
disabilities reaching proficiency on large-scale assessments when the two-year post exit inclusion policy is applied.
a. Schools will demonstrate an increase in the percent of students with disabilities reaching proficiency on assessments of reading.
The first hypothesis will evaluate whether the implementation of the two-year post exit inclusion policy results in an absolute increase in the number of schools with students in the disability subgroup meeting proficiency. It is also important to assess whether this absolute change results in a subsequent increase in the number of schools meeting AYP for the special education subgroup. In other words, is the absolute increase observed enough to affect school AYP outcomes for the disability subgroup? To evaluate this question, two different sets of AMO targets will be used to assess whether changes in the percent of students with disabilities who are proficient results in changes in AYP outcomes for this group. The first set of targets corresponds to the AMOs set by the state of North Carolina for the 2009/10 school year in both reading (43.2%) and math (77.2%). These are referred to as “medium” level targets throughout the remainder of this
document. During the 2010/11 school year, however, these targets increased sharply to 71.6% proficient in reading, and 88.6% proficient in math (hereafter referred to as “high’ targets”). This increase corresponds to NCLB’s mandate that all schools increase their proficiency targets until the 100% proficiency goal in both reading and math is attained in 2014. Thus, this study proposes to evaluate schools’ ability to meet not only their actual 2009/10 medium level targets, but also the high targets that were implemented shortly thereafter.
applied to calculations of AYP, as compared to when the percent proficient or status model is used.
a. An increase in the number of schools meeting the medium AYP target of 43.2% proficient in the area of reading/language arts will be observed. b. An increase in the number of schools meeting the medium AYP target of
77.2% proficient in the area of math will be observed.
c. An increase in the number of schools meeting the high AYP target of 71.6% proficient in the area of reading/language arts will be observed.
d. An increase in the number of schools meeting the high AYP target of 88.6% proficient in the area of math will be observed.
3. Compared to the policy of increasing minimum subgroup sizes, the use of confidence intervals in calculations of AYP will result in a net decrease in the number of schools meeting AYP for the students with disabilities subgroup when, in fact, they haven’t (i.e., there will be a decrease in false-negative reporting of AYP proficiency for the disabilities subgroup).
4. The type of AYP model used will have an impact on the relationship of school-level AYP outcomes and student achievement growth at the school.
Method Data Source
The present study made use of extant data supplied by the North Carolina Department of Public Instruction (DPI) and housed by the North Carolina Education Research Data Center (NCERDC) at Duke University in Durham, North Carolina. NCERDC houses multiple datasets that can be accessed by researchers with common identifiers across datasets for schools and students. Two of these datasets were used in the present study: (a) individual -level accountability data files (AYP_ABC_PUB2010), including annual test scores for over a million students attending public schools in North Carolina between the mid-1990s and 2011, and (b) the NC school data contained in the Common Core of Data Public School Universe Survey (CCDPSU) database, a national statistical database of all public elementary and secondary schools and school districts. This study drew primarily on student- and school-level data from the 2007/08, 2008/09, and 2009/10 school years.
Participants
Students. This study used extant data from a sub-sample of children in grades 3-5 attending public elementary schools in North Carolina. Students’ test results were included if they (a) had taken the general assessment in either reading or mathematics or both in
appropriate grade levels. Approximately 123,000 students met these criteria, and were included as participants in the current study. Furthermore, participants for Hypotheses 1 and 2 also included an additional 21,369 students who had been identified as a student with a disability according to the eligibility criteria outlined by IDEA in either the 2007/08 or 2008/09 school year, but were no longer identified as a student with a disability.
In order for a child to be identified as a student with a disability under IDEA, he or she must (a) meet eligibility criteria for one of a number of specified disabilities, (b) have experienced adverse educational performance as a direct result of this disability, and (c) require special education or related services. In North Carolina, the Department of Public Instruction has outlined thirteen categories of disability: (a) autism, (b) deaf-blindness, (c) emotional disturbance, (d) hearing impairment, (e) mental retardation, (f) multiple
disabilities, (g) orthopedic impairment, (h) other health impairment, (i) specific learning disability, (j) speech or language impairment, (k) traumatic brain injury, (l) visual
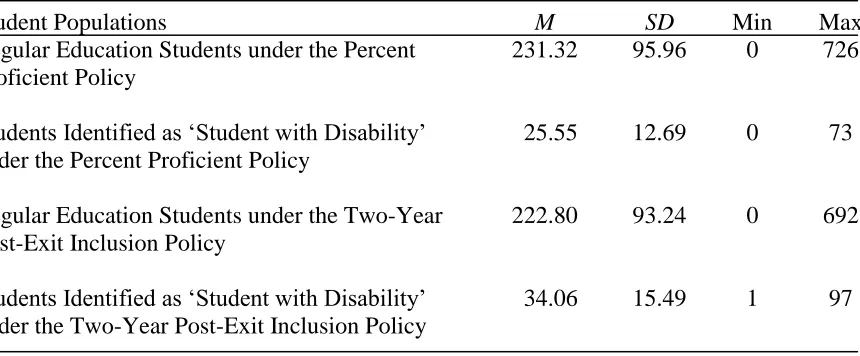
Tables 3 and 4 provide additional descriptive information about the population of students across schools in the current study. These tables provide information about how students were distributed within schools in the sample, under two different policies. Under the percent proficient policy, the average school had approximately 232 students in grades 3 to 5 in regular education, and 26 students in special education who had participated in the general education assessments in reading and mathematics. However, when the two-year post-exit inclusion policy was applied, students who had exited special education up to two years prior were counted as ‘special education’ students, instead of ‘regular education’ students. Under this policy, then, the average school had approximately 223 students in grades 3 to 5 in regular education, and 34 students in special education.
Table 3
Mean Number of Students in Different Student Groups across All Schools (n= 1111)
Student Populations M SD Min Max
Regular Education Students under the Percent Proficient Policy
231.32 95.96 0 726
Students Identified as ‘Student with Disability’ under the Percent Proficient Policy
25.55 12.69 0 73
Regular Education Students under the Two-Year Post-Exit Inclusion Policy
222.80 93.24 0 692
Students Identified as ‘Student with Disability’ under the Two-Year Post-Exit Inclusion Policy
Table 4
Mean Percent of Students in Different Student Groups across All Schools (n= 1111)
Student Populations M% SD Min Max
Regular Education Students under the Percent Proficient Policy
89.60 4.92 0 100
Students Identified as ‘Student with Disability’ under the Percent Proficient Policy
10.76 5.06 0 100
Regular Education Students under the Two-Year Post-Exit Inclusion Policy
86.19 5.32 0 98.94
Students Identified as ‘Student with Disability’ under the Two-Year Post-Exit Inclusion Policy
13.81 5.32 1.1 100
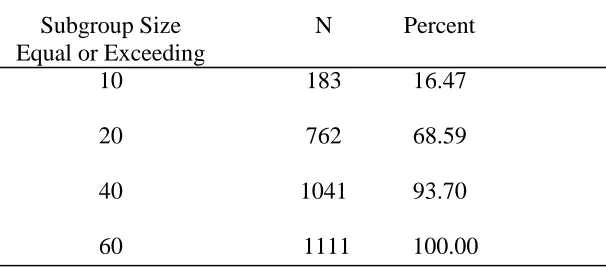
Overall, 1,111 public elementary schools were included in the final sample. To test Hypothesis 3, all schools in the sample were divided in to four categories, depending on the number of students in the students with disabilities subgroup. Table 5 summarizes the cumulative number of schools in each of the four subgroup sizes.
Table 5
Cumulative Frequency of Schools in Each of Four Minimum Subgroup Size Categories
(n=1111)
Subgroup Size Equal or Exceeding
N Percent
10 183 16.47
20 762 68.59
40 1041 93.70
The schools in the sample were drawn from 85 counties and 100 Local Educational Agencies (LEA) in the state of North Carolina. In addition, schools in the sample represented a range of locales, with approximately 29% of schools located in cities (i.e., located inside an urbanized area and principal city), 14.5% of schools located in suburbs (i.e., territory outside of a principal city but inside an urbanized area), and 21% of schools located in towns (i.e., territory inside an urban cluster but outside of an urbanized area). A further 46% of schools were located in urban areas (i.e., census-defined rural territory that is outside of an urban area and/or cluster).
Of the 1,111 schools in the sample, the majority of them (75.6%) were Title 1 School-wide Programs, defined as a school in which all of the pupils in the school are designated under appropriate state and federal regulations as being eligible for participation in programs authorized by Title 1 of the Improving America’s Schools Act (Public Law 103-382). On average, 47% of students in each school were considered eligible to participate in the Free Lunch Program under the National School Lunch Act; furthermore, 9% of students (on average) met eligibility criteria for the Reduced-Price Lunch Program.
Measures
growth was calculated and used as an outcome variable; in addition, a performance index was also developed and used as an independent variable. The following sections provide further information about these measures.
EOG-R. At the elementary school level, the EOG-R is designed to assess student knowledge and skills in the specific competency areas outlined in the North Carolina English Language Arts Standard Course of Study. In particular, the EOG-R aims to assess a child’s ability to read and interpret text and apply strategies to comprehend and evaluate what has been read. The EOG-R requires students to read passages and answer multiple-choice questions about each passage. A total of ten passages are presented. Selected passages represent a range of different content areas to reflect the variety of reading content required of students, including literature passages, informational selections in particular content areas (e.g., science and social studies), and consumer and practical selections (e.g., brochures). The multiple choice questions are intended to tap four key constructs that are conceptualized as part of reading comprehension including (a) cognition, (b) interpretation, (c) critical stance, and (d) connections (PSNC, 2004, 2007).
“consistently demonstrate mastery of the grade level subject matter and skills and are well prepared for the next grade” (PSNC, 2004, p. 12).
Internal consistency reliability estimates for the EOG-R are presented as coefficient alphas, and range from .88 (tenth grade) to .94 (sixth grade). The standard error of
measurement is two to six points for grades 3-8 (PSNC, 2004).
In the test manual, multiple sources of evidence are used to make the case that the EOG-R is a valid measure of students’ reading comprehension skills and the states’ language curriculum. Evidence of content relevance is demonstrated by matching each of the items to the strand or construct it is meant to assess (cognition, interpretation, critical stance, or connections). The distribution of items across each of these constructs is provided for each grade level. The percent of questions intended to assess cognition ranges from 25.9% in seventh grade to 39.3% in fourth grade. Similarly, the percent of questions assessing interpretation ranges from 36.7% in third grade to 42% in seventh grade. A smaller percentage of items are included to assess critical stance (18% in fourth grade to 26.8% in seventh grade) and connections (4% in fourth grade to 6.7% in third grade) (PSNC, 2004).
Evidence of criterion-related validity used for the EOG-R is determined by examining the relationship between student scores on the EOG-R and other measures of student
between scaled scores on the EOG-R and associated measures of student achievement (PSNC, 2004).
EOG-M. North Carolina’s End-of-Grade assessment in mathematics is intended to evaluate students’ performance in seven key areas included in the North Carolina
Mathematics Standard Course of Study: numeration, geometry, patterns, pre-algebra, measurement, problem-solving, data analysis, statistics, and computation. The EOG-M consists of two parts administered separately. The mathematics computation section consists of 12 questions in grade 3-6 and eight questions for grades 7 and 8. The mathematics
applications section of the EOG-M is comprised of 68 questions for grades 3-6, and 72 questions for grades 7 and 8. Students are allowed to use calculators during the mathematics applications section, but not during the mathematics calculations section of the EOG-M (PSNC, 2006, 2007).
As with the EOG-R, student results on the EOG-M can be reported as percentiles or scaled scores. In addition, scaled scores are used to determine a student’s proficiency level using the achievement level classification system defined by the North Carolina Testing Program. Grade-level proficiency in math is evidenced by achieving either a Level III or IV on the assessment (PSNC, 2006).
Evidence of content validity is provided for the EOG-M, and is demonstrated through teacher ratings. More specifically, content-area teachers were asked to evaluate the
appropriateness of items on the EOG-M according to the following criteria: (a) test content reflects the goals and objectives of the grade level curriculum; (b) test content reflects the goals and objectives of the grade level curriculum as it is taught in the teacher’s school or school system; (c) items are clearly and concisely written, and the vocabulary is appropriate to the target age level; (d) the content is balanced in relation to ethnicity, race, sex,
socioeconomic status, and geographic districts of the state; and (e) each of the items has one and only one answer that is best; however, the distracters appear plausible to someone for someone who has not achieved mastery of the represented objective. Responses were reported on a 5-point scale, with the “5” representing “to a superior degree”, and “1”
corresponding to “not at all.” On average, teacher responses to these questions indicated that the EOG-M met the criteria outlined to a “superior” or “high” degree (PSNC, 2006).
Evidence of criterion-related validity for the EOG-M was determined by examining the relationship between student scores on the EOG-R and other measures of student achievement, including expected grades, and assigned achievement levels. Pearson
students scoring “basic” or “proficient” on the NAEP and students who scored at Level III or IV on the EOG-M were observed across 4th and 8th grade students (PSNC, 2006).
Test administration and participation. Both the EOG-R and the EOG-M are administered in May of each year to students in grades 3-8 as part of North Carolina’s
statewide assessment system. Training on the proper administration of the End-of Grade tests is provided to school test coordinators according to the training specifications outlined in the NCDPI Testing Policy. School test coordinators are responsible for monitoring test
School growth. North Carolina uses a variant of a residual gain score as a measure of individual student growth, and the mean of student growth scores at a school as a measure of school growth. Student scores in reading and mathematics are converted to c-scores, which are z-scores based on the grade-level mean and standard deviation obtained by students in the standard setting year. Within this system, academic change is expressed as the difference between a student’s c-scale score in the current year and the average of the student’s previous two assessments, in c-scale units, with a correction for regression to the mean (PSNC,
2006a). The formula for determining academic change is as follows: AC = CSc-scale - (0.92 X ATPAc-scale), where
AC = academic change CS= current score
ATPA= average of the two previous assessment scores
When only one previous score is available for a student, that c-scale score is multiplied by .82 and subtracted from the current score.
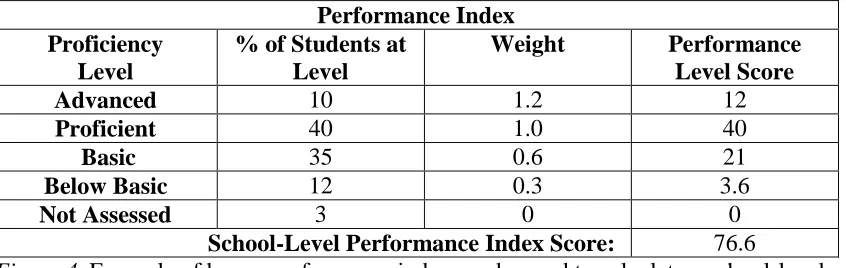
Performance index. For the purposes of the current study, a performance index was developed to allow for the assignment of partial credit to students at varying levels of proficiency. As illustrated in Figure 4, this performance index consists of four proficiency levels, each with a corresponding weight. To calculate a school’s overall performance index score (PI), the percentage of students at each level is multiplied by the corresponding weight, resulting in a score for each performance level. These scores are then summed to get the school’s overall PI score. Figure 4 provides an example of how school-level PIs were calculated in this study. Under this policy, the maximum score that a school can receive is 120 (100% of students reaching the advanced level), and the minimum possible score is 0 (all students not assessed). As North Carolina does not currently use a performance index when determining AYP calculations, the index developed for the purposes of this study was
modeled after the performance index currently used in the state of Ohio (Ohio Department of Education, 2006).
Performance Index Proficiency
Level
% of Students at Level
Weight Performance
Level Score
Advanced 10 1.2 12
Proficient 40 1.0 40
Basic 35 0.6 21
Below Basic 12 0.3 3.6
Not Assessed 3 0 0
School-Level Performance Index Score: 76.6
Results Analyses Specific to Hypotheses
Hypothesis 1. As described in the previous section, Hypothesis 1 asserted that the implementation of the two-year post exit inclusion policy would result in an absolute increase in the percent of students with disabilities at a school meeting grade-level
proficiency standards compared to the proficient/status model. To test this hypothesis, the percent of students with disabilities meeting proficiency on the EOG-R and EOG-M (defined as Achievement Standard Level III or above) was calculated for each school in the sample, first, only for students who were in special education during the 2009/10 school year, and then again including students who had exited special education during the 2007/08 and 2008/09 school years.
A binomial test (sign test) was used to evaluate whether the change in who was included in the students with disabilities subgroup increased the percent proficient for this subgroup at the school level. The binomial test analyzed the proportion of schools falling within one of two conditions: (a) an increase in the percent of students with disabilities reaching
show an increase in the percent proficient and half to show a decrease when the two-year post exit inclusion policy was applied.
For the EOG-R, 952 (85.7%) of the 1,111 schools saw an increase in the percent of students with disabilities meeting grade-level proficiency standards when the two-year post exit inclusion policy was applied. Similarly, 961 (86.5%) of the 1,111 schools saw an
increase in the number of students with disabilities meeting grade-level proficiency standards on the EOG-M under this same policy. In both cases, the number of schools showing
increases in the percent proficient was greater than would be expected by chance (p < .001), confirming Hypothesis 1.
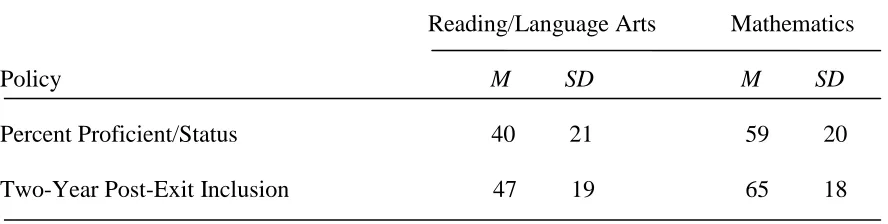
To determine the extent to which the average school increased its proportion of students with disabilities reaching grade-level proficiency standards when the two-year post-exit inclusion policy was applied, the average percent proficient for the students with
Table 6
School Mean Percent of Students with Disabilities who Reached Proficiency in Mathematics and Reading Under Two Policies (n = 1111)
Reading/Language Arts Mathematics
Policy M SD M SD
Percent Proficient/Status
40 21
59 20 Two-Year Post-Exit Inclusion
47 19
65 18
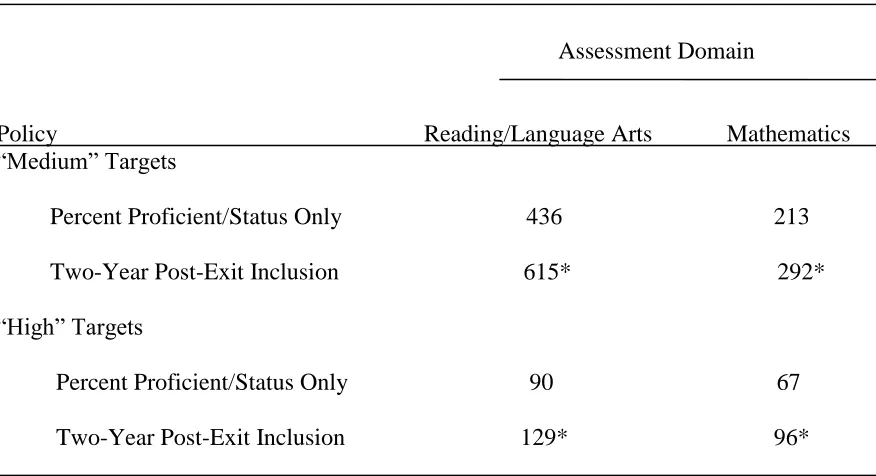
Hypothesis 2. The results from Hypothesis 1 indicated an overall significant increase in the percent of students with disabilities meeting proficiency on assessments of math and reading when the two-year post-exit inclusion policy was applied. However, for the purposes of AYP, it is perhaps most important to determine whether this change resulted in an increase in the number of schools meeting annual measurable objective (AMO) targets in both reading and math. Binomial sign tests were again used to test Hypothesis 2, this time examining whether the proportion of schools meeting two sets of AMO targets (‘medium’ and ‘high’) increased under the two-year post-exit inclusion policy. With both the 2009/10 ‘medium’ AMOs (i.e., 43.2% proficient in reading/language arts and 77.2% proficient in mathematics) and ‘high’ 2010/11AMOs (i.e., 71.6% proficient in reading/language arts and 88.6%
.001) when the two-year post exit inclusion policy was applied (see Table 7), thereby confirming Hypothesis 2.
Table 7
Number of Schools Meeting Medium and High AMO Targets for the Students with Disabilities Subgroup in Reading/ Language Arts and Mathematics (n = 1111)
Assessment Domain
Policy Reading/Language Arts Mathematics
“Medium” Targets
Percent Proficient/Status Only 436 213 Two-Year Post-Exit Inclusion 615* 292* “High” Targets
Percent Proficient/Status Only 90 67
Two-Year Post-Exit Inclusion 129* 96*
* Increase in number of schools p< .001
Note. “Medium Targets” refer to the 2009/10 North Carolina AMOs (43.2% proficient in reading/language arts and 77.2% proficient in mathematics); “High Targets” refer to the 2010/11 North Carolina AMOs (71.6% proficient in reading/language arts and 88.6% proficient in mathematics).
Hypothesis 3. Hypothesis 3 asserted that, compared to the minimum required subgroup