A Tool for Twitter Data Analysis using NLP
Yogini Sagade, Prof. Y. B. Gurav
ME Student, Department of Computer Engineering P.V.P.I.T Bavdhan, Pune, Maharashtra, India
Assistant Professor, Department of Computer Engineering P.V.P.I.T Bavdhan, Pune, Maharashtra, India
ABSTRACT: With increasing data on Social Media Networks, analytical tools are also getting evolved to analyse the data present on different media to derive useful information. The tool described in this study helps in analysing Twitter data regarding a specific brand. Twitter data is streamed for a specific brand and analyzed to generate user sentiments for that brand. The classification techniques used is stanford NLP Classification.
KEYWORDS: Dimensions, Reach; Engagement; ROI.
I. INTRODUCTION
Mobile AS we all know it takes a lifetime to build a brand but takes only a few minutes to destroy it. But with social media playing an important role in peoples life, it can be just a post which can harm the reputation of a brand. It therefore becomes very important to continuously monitor the brand reputation in social circles for a product and it also is able to market the new features and offer with social media networking sites like Twitter and Facebook etc. [1]. The project focuses on Twitter because of its 140 character limitation and only textual data. The advent of Internet is long past thing now and the new term that is coined is minute Internet where we are focusing on events happening per minute in Internet space. Internet generates a lot of data (normally in gigabytes) per day from different social channels. The openly available data on Internet can be used to work on analytics that provide user sentiments pertaining to a brand at a specific time. The need is to acquire a brands reputation and can use this information to build the same for new features or releases that will be offered for the product. The data thus generated is unstructured and needs to be analyzed real time as data even older than 2-3 days might not be helpful for gauging sentiment. Thus the challenge is to analyze a huge amount of data real time and derive conclusions from this data. Nowadays products are being marketed on social media as well and feedback for these products is also available on Social Networks. These feed backs are analyzed to get the brand reputation for a product on a particular time space and the tweets thus obtained can be categorized according to geographical locations or specific user groups and similar categorizations. A lot of research is going on the field of Sentiment Analysis nowadays which can be used for following [2] -
1) Brand monitoring and campaigning. 2) Stock markets.
3) News and current events.
4) Movie Reviews and Box office collection. 5) Election Campaign and predictions. 6) Weather Forecasts.
II. RELATED WORK
Sentiment Analysis is gauging the current sentiments that are prevailing on the social media sites for a particular brand at a particular time- frame. The data though filtered for a specific time will always be huge and thus the term Big data analytics is used for analyzing this huge dataset. Apart from size the other complexities of analyzing this data is its form which is mostly unstructured in nature. The major player in market for Big data analytics are Google Analytics, IBM Cognos suite, Hotsuite and SalesForce etc. Different Sentiment Analysis methods can be used for analyzing social data that gives different results. A good comparison of all these methods for carrying out sentiment analysis is given in [5]. The research was focused on comparing eight popular sentiment analysis methods namely LIWC, Happiness Index, SentiWordNet, SASA, PANAS-t, Emoticons, SenticNet and SentiStrength. Even with presence of many players the analysis of tweets does not target on new measures such as retweet count or leader of the tweets. If the analysis process can identify the tweets that are influencing the user sentiment in a time space, the reason for that sentiment flow can also be deduced. Thus companies can come up with offers that can target a specific location or a specific set of users and these users can be approached through Social Media which in our case is Twitter. The customer then can share the feedback on same social channel which will help us get the sentiment for the offer provided. This will also help us in deduce the ROI for the new feature. The previous work was majorly focused in trying various sentiment analysis techniques like SVM, Maximum Entropy and other more accurate algorithms. The stanford university has come up with new NLP algorithms that can be used for analysis. Therefore the need of the hour is to enhance the same algorithm and achieve better performance. The major task of the Sentiment Analysis layer can attain a better performance if the pre processing of data is also done properly. The noise level reduction and analyzing the emoticons and POS tagging are thus required to prepare a good quality database for running the sentiment analysis algorithm. The paper thus focuses mainly on introducing new techniques for pre processing data.
III. PROPOSED SYSTEM
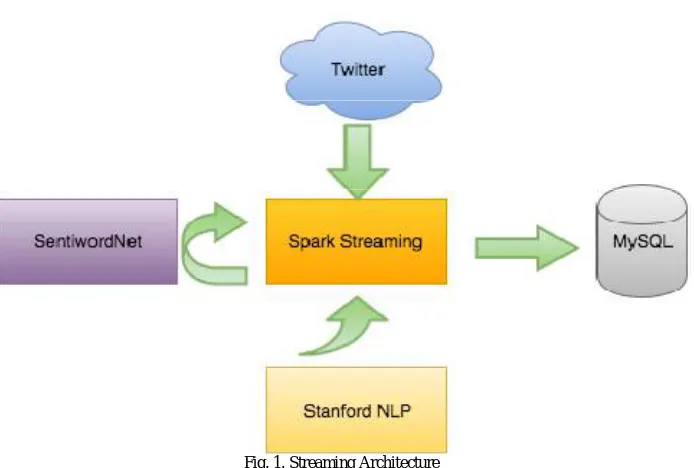
The architecture of the proposed system is 3 tier wherethe tiers are namely Database tier, Analysis tier and Result display. All the three tiers can be distributed and can sit ondifferent nodes in an implementation. The Results display is a web interface which can be extended to mobile devices as well. Therefore the Results page can be deployed on a clientmachine which can be accessed on many terminals from asame server location as well.
A. Database
Fig. 1. Streaming Architecture
B. Sentiment Analysis Layer
Sentiment Analysis can be carried out in two ways namely supervised and unsupervised [3]. The supervised learning requires a training dataset and assumes a finite number of categories for an item to fall into. Some supervised learning algorithms are Naive Bayes, SVM or KNN etc. Unsupervised learning is based on getting Semantic Orientation (SO) of the document. The algorithm used in the tool uses standard NLP algorithm which has desired accuracy. A sentiment analysis dictionary is also used for comparing bag of words. The analysis targets and works such that any document can be classified in a finite set of categories which in this case is 4 (positive, negative and neutral) by calculating features in the document. The feature count is taken as the frequency of occurrence of words in the document i.e. more the occurrence of a particular word, more will be its probability . The tweets collected in database will be analyzed with and will be classified in one of the 3 categories as positive, negative and neutral. The tweet can contain both positive and negative sentiments and thus the category neutral is for such tweets which can be categorized from existing sentiments. The Sentiment analysis is performed after pre possessing the data for removal of stop words, noise and interpreting emoticons.
IV. ALGORITHM
The algorithm used in Sentiment Analysis layer for classifying sentiments in positive, negative or neutral tweets in POS tagging. The sentiment analysis is performed through Maximum Entropy technique in which we categorize a sentiment by identifying nearest similarity with either positive or negative sentiment. The distribution is conditional which gives the document class. The dictionary used to train the tool is SentiWordNet. The Maximum Entropy algorithm can be defined as follows
where feature fi(d; c) is being searched for parameter λi and Z(d) provides stability to equation.
1) Stop word removal - All words that are not particularly useful in accessing sentiment will be removed from the text. Examples are at, and or, are etc.
2) POS tagging - Part of speech tagging enables us to identify the literal meaning of the text with the context in which it is used where ambiguity can appear.
3) Negation Handling - As the tweets might contain negative words twice we will count to negative words as a positive. 4) Emoticons - The emoticons will be interpreted and this will help in gaining the sentiment weight appropriately. For example, instead of using a smiley to show happiness we add the word happy for the smiley.
5) Laplacian Smoothing The algorithm assumes that all the words are present in training data set. Laplacian smoothing handles the case when this might not be true.
The POS tagging is a document analysis technique where we have Subjectivity and Polarity classification. This is an enhanced way of sentiment analysis as a sentiment of word can be different from a sentiment of sentence. Thus a sentence taken from Twitter i.e. text data of Twitter is tagged as Nouns, Adjectives and Verbs. These forms a pair of 2 tags and 3 tags. Thus the polarity is identified according to tags rather than on words.
IV.IMPLEMENTATION
V.
The project implementation is done in scala where tweets are streamed real time by establishing connection through Twitter4J APIs. Sentiment Analysis is executed in Map Reduce framework so that all the performance of analysis is good. The no of clusters used for executing query parallely can be user configured.
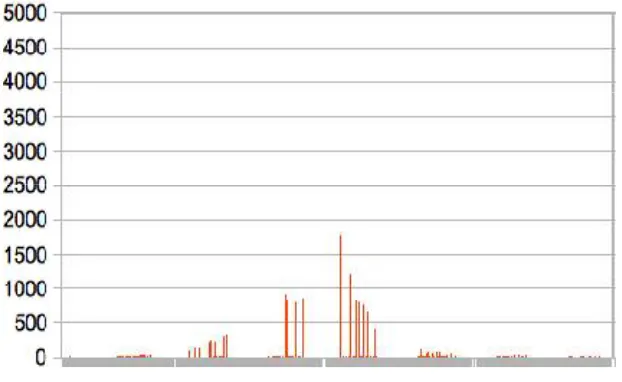
Fig. 2. Accuracy with increasing tweets.
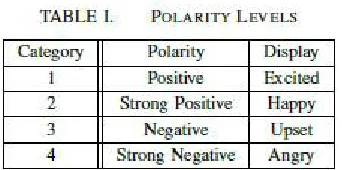
The data thus acquired is unstructured and is in json format. The spark languages provides a resilient database set RDDS which can be used to extract query results in desired format. This data is then filtered and removed of all stop words and undergoes a POS tagging. The sentiment analysis layer then classifies the data in 4 categories namely ”Excited”, ”Happy”, ”Upset” and ”Angry” which describes positive and negative sentiments. Maximun Entropy used for sentiment analysis requires a large training set. As the data is being classified on the fly, the accuracy can be achieved by using large data streams. But as this is time consuming and also memory requirements increases with increasing in streaming, the accuracy generated for this experimental set up was low. For enhancing this accuracy, a combination of algorithms can be used and also historical search can be enabled.
VI.RESULTS
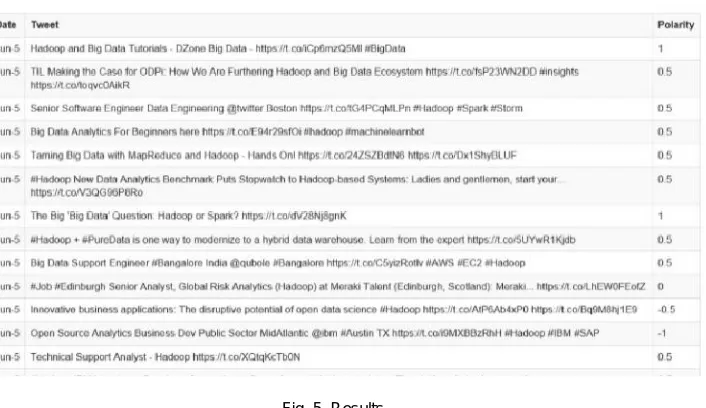
sentiment analysis some of the data analysed is inaccurate. The accuracy increases as we increase the number of tweets considered but the analysis procedure takes more time and also heap size required by the application increases. The figures 3,4 and 5 shows different screens for Search, Analyze and Result display. The search screen takes a search keyword and on event of Submit button clicks sends the data for analysis to Sentiment Analysis layer. This layer will perform the analysis and display the result in graphical format.
The data is also shown in tabular format for the tweets accumulated for the search along with polarity as shown in Results page.
Fig. 3. Search
Fig. 5. Results
The Sentiment Analysis done by SentiWordNet claims in between 12-70 percent depending upon the quality of text used and training data set.The expected outcome of the sentiment analysis done in the technique used here aims to achieve 70-80 percent precision.
VII. CONCLUSION AND FUTURE WORK
The paper thus describes a simple method for analyzing Twitter tweets filtered from some specific keywords that describe a brand and gives us an insight of the sentiments for a brand. Thus the implementation of Maximum Entropy algorithm can be used for analyzing tweets and using this information for building brand reputation on Twitter media.
The tool focuses on Twitter data analysis as the Twitter limits the data size to 140 characters which give us an advantage of size limited dataset. Also another advantage of Twitter is it has only text data. The tool but can be extended to Facebook or other such social media tool which have an added complexities of video data, images and sound files as well. Also the Sentiment Analysis layer can be extend to use multiple algorithm like a combination of many other algorithms as well such as Naive Bayes and SVM instead of using a single algorithm which can increase the accuracy of the proposed model.
REFERENCES
1. A. Tedeschi, B. Noble and F. Benedetto,A cloud-based tool for brand monitoring in social network, University of Roma TRE., Rome: IEEE International Conference on Future Internet of Things and Cloud, 2014.
2. N. Bekmamedova and G. Shanks ,Social Media Analytics and Business Value : A Theoretical Framework and Case Study, 47th Hawaii International Conference on System Science., 2014.
3. R. Feldman, Techniques and applications for Sentiment Analysis, Communications of the ACM:Vol 56, pp 4, 2013.
4. K. Nigam, J. Lafferty and A. McCallum,Using Maximum Entropy for Text Classification, Carnegie Mellon University, Pitsburg.
5. P. Goncalves, F. Benevenuto, M. Araujo and M. Cha, Comparing and combining Sentiment Analysis methods, UFMG, Brazil, COSN, 2013. 6. J. Natkins, How to analyse Twitter data with Apache Hadoop.
BIOGRAPHY