Computer Aided Detection of Polyp in CT
Colonograpghy Using Logic Regression
Neeta B.Bankhele1, Prof. Rahul M. Mulajkar2
PG Student, Dept. of E &TC, JCOE Kuran, Pune Maharshtra, India1 Assistant Professor, Dept. of E & TC, JCOE Kuran, Pune Maharshtra, India2
ABSTRACT:-We present a computer aided detection (CAD) systemfor computed tomography Colonography that orders the polyps according to clinical relevance. The CAD system consists of two steps: candidate detection and supervised classification. The characteristics of the detection step lead to specific choices for the classification system. The candidates are ordered by a linear logistic classifier (logistic regression) based on only three features: the protrusion of the colon wall, the mean internal intensity and a feature to discard detections on the rectal enema tube. This classifier can cope with a small number of polyps available for training, a large imbalance between polyps and non-polyp candidates, a truncated feature space, unbalanced and unknown misclassification costs, and an exponential distribution with respect to candidate size in feature space. Our CAD system was evaluated with data sets from four different medical centers. For polyps larger than or equal to 6 mm we achieved sensitivities of respectively 95%, 85%, 85%,and 100% with 5, 4, 5, and 6 false positives per scan over 86, 48, 141, and 32 patients. A cross-center evaluation in which the system is trained and tested with data from different sources showed that the trained CAD system generalizes to data from different medical centers and with different patient preparations. This is essential to application in large-scale screening for colorectal polyps.
KEYWORDS: Biomedical image processing; Polyp detection; colorectal cancer capsule endoscopy .
I.INTRODUCTION
Cancer is the second leading cause of mortality due to cancer in the western world Paradoxically, perhaps, is that it is preventable for a large part or at least curable if detected early. Adenomatous colorectal polyps are considered important precursors to colon cancer. It has been shown that screening for such polyps can significantly reduce the incidence of colon cancer .Computed tomography (CT) colonography (CTC) is a rapidly evolving technique for screening, but the interpretation of the data sets is still time-consuming. Computer aided detection (CAD) of polyps may enhance the efficiency and also increase the sensitivity. This is specifically important for large-scale screening. Recent studies show that the sensitivity of CAD systems is already comparable to the sensitivity of optical colonoscopy and radiologist using. The best indicator of the risk that a polyp is malignant or turns malignant over time is size [90]. The consensus is that patients with a polyp of at least 10 mm must be referred to optical colonoscopy for polypectomy and it is adviced that diminutive polyps (≤ 5 mm) should not even be reported. There is still debate over the need for polyp for 6–9 mm polyps. Surveillance for growth with CT colonography has also been suggested. protrusions. Possible beneficial information from other isophotes, with higher or lower intensities, was ignored. The scheme proposed in this paper diverges primarily by acting on an implicit representation of the colon surface. That is, it uses information from additional isophotes as well. Accordingly, there is no need for optimizing the intensity level of the iso surface. Another benefit of this method is that topological difficulties and complex mesh processing tasks, such as mesh generation and mesh flattening, are avoided. We will compare both methods and demonstrate that the two techniques are to some extent complementary. Moreover, exploiting the balancing aspects will be shown to lead to improved sensitivity
II.RELATED WORK
CAD algorithms for polyp detection in CT colonography usually consist of candidate detection followed by supervised classification. Candidate detection aims at 100% sensitivity for polyps larger than 6 mm which goes at the expense of hundreds of false positives (FPs) per scan. The task of supervised classification is to reduce the number of detections to about a handful without sacrificing the sensitivity too much. For the detection of polyp candidates, Summers et al. proposed to use methods from differential geometry in which the principal curvatures were computed by fitting a fourth order B-spline to local neighborhoods with a 5 mm radius. Candidates were generated by selecting regions of elliptic curvature with a positive mean curvature .Yoshida et al.used the shape index and curvedness to find candidate objects on the colon wall. The shape index and curvedness are functions of the principal curvatures of the surface, which were computed in a Gaussian-shaped window (aperture). Alternatively, Kiss et al. [ generated candidates by searching for convex regions on the colon wall. Their method fitted a sphere to the surface normal field. The type of material in which the center of the fitted sphere was found (in tissue or in air) determined the classification of the surface as either convex or concave. As a result, roughly 90% of the colon wall was labeled as concave, that is ’normal’. Subsequently, a generalized Hough transformation using a spherical model was applied to the convex surface regions. Candidate objects were generated by searching for local maxima in the parameter space of the Hough transformation. Kiss et al. characterized the shape of the candidate by comparing the spherical harmonics with those of the polypoid models in a database Apart from the different candidate detection algorithms, there is a wide variety in the design of the pattern recognition system, ranging from low-complex systems like linear discriminant classifiers to classification systems using multiple neural networks. Yoshida and Näppi used linear and quadratic discriminant classifiers as well as Jerebko et al. Wang et al. uses a two-level classifier with a further unspecified linear discriminant classifier in the second level. The first level of this classifier consisted of a normalization procedure, which was specially designed and had four parameters. Sundaram et al. classified the candidates based on a single heuristically designed score using curvature information of the candidate patches. Göktürketnal employed a support vector machine for classification, in which it was assumed that after a transformation by the kernel function, the data were linearly separable. This implicitly required minimal mixing between polyps and false detections. JerebkoetalandZheng et al. used a committee of support vector machines. Neural networks were also used by Jerebko et al. [50] and Näppi et al. [65,78] for classification, and by Suzuki et a for the reduction of false detections on the rectal enema tube.To conclude, many different proposals for a classification system for computer aided detection of polyps have been presented. However, the motivation for a specific design of the classification system is often unclear. Moreover, proper comparison between classification systems is difficult due to the different candidate detection systems and feature extraction methods. One may reason that the optimization of complex classification systems (with large number of parameters or features) may be complicated by the limited availability of training examples. This could lead to overtraining to a specific patient population or patient preparation.
III.PROPOSED ALGORITHM
In proposed method ANFIS classifier is used to deduct the polyp or not. During diagnose the polyp get differentiated as whether it is malignant or benign tumor
A. Data Discription And Feature Design:
A CAD system for CTC starts with the acquisition of CT colonography data. In these data, candidate objects are detected and segmented. The segmented candidates are typically characterized by features describing, for instance, the candidate’s shape and its internal intensity distribution. Such data serve as input for the classification system. All pre-processing steps will be addressed in this section.
I.CT Colonography Data:
truth).for data sets ’A’, ’B’ and ’C’ was optical colonoscopy. An expert radiologist served as the reference for data set ’D’. Radiologists retrospectively indicated the location ofpolyps by annotating a point in the 3D data set based on the reference standard. Thecandidate segmentations (see below) were labelled by comparison to these annotations.Data sets ’A’, ’B’ and ’C’ consisted of scans in both prone and supine positions. Apolyp was counted as a true positive CAD detection if it was found in at least one ofthe two scanned positions. Only dataset ’A’ has been used during development of the system.
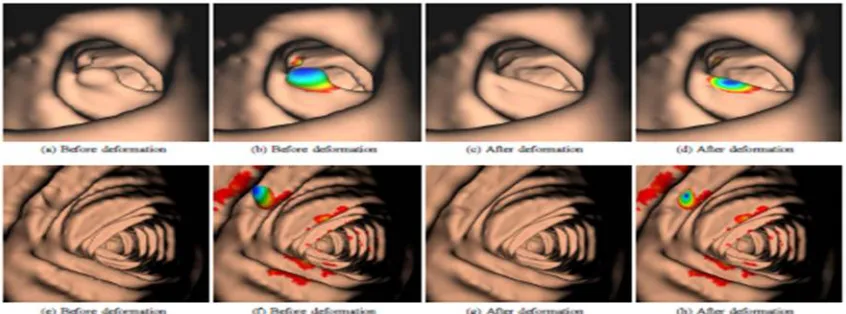
Figure 1: The candidate detection method applies a non-linear ’flattening’ operationto the colon wall. The protrusion field is defined as the difference in positionof the colon wall before (a–b,e–f) and after (c–d, g–h) application of the operation. The coloring (b,d,f,h) indicates the protrusion of the mesh verticesof detected candidates (blue denotes a large protrusion and red denotesa protrusion of 0.2 mm, i.e. the low hysteresis threshold). Notice that thenfolds are hardly affected by the operation
II.Candidate Detection
III.Feature:
Radiologists that evaluate CTC data primarily use two properties of a candidate forclassification: the shape and the voxel intensities inside the candidate. There is stilldebate about the optimal way to analyze CTC data. Radiologists using the 3D renderingof the colon (virtual colonoscopy) detect polyps based on shape, but they will oftenfall back to the 2D representation (grey values) before a final decision is made. Usinthe 2D representation, both the internal intensities and the shape are assessed, although shape is often hard to extract from the grey-value images. The features used in thepresented CAD system are based on the same two properties that are primarily used byradiologists.Shape was previously described by the shape index and curvedness, mean curvature,average principal curvatures and sphericity ratio and spherical harmonicsAn alternative method to measure shape, which is based on the protrusion field, will be introduced The internal intensity of the candidates has been found before to be a discriminativefeature to discard a large number of false detections It may be expectedthat due to the partial volume effect false detections arise that have low internal intensity.False detections that are stool often have air inside, which also lowers the intensity.Such information about the candidates will be included through statistics on the voxelintensities inside the object At last, it was experimentally found that many false positives turned out to be detectionson the rectal enema tube (RET) (previously also reported in Therefore,a third feature will be proposed to discard such false detections Shape
A.Shape Feature From Protrusion Field
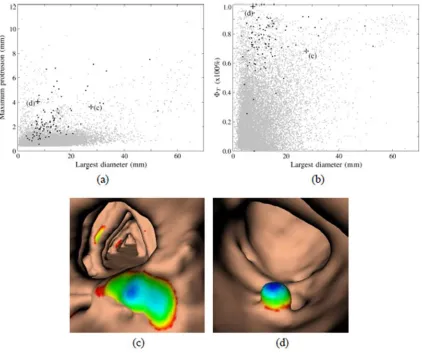
Polyps are conventionally characterized by the single largest diameter, excluding the stalk However, Fig. 7.2(a) shows that this measure does not distinguish polyps from false detections well. It appears that especially among the less protruding candidates (≤ 2 mm), the candidates with the larger diameters are predominantly false detections. Alternatively, it might be natural to select the maximum protrusion of a candidate as a feature, but it appears that a lot of polyps have only modest protrusion. As an illustration, Figs. 7.2(c) and (d) show two candidates that have approximately the same maximum protrusion but a completely different appearance. The first candidate (candidate ’c’) has a large diameter, but does not resemble a polyp at all, whereas the second candidate (candidate ’d’) with a small diameter does so. To conclude, a large diameter relative tothe maximumprotrusion indicates a non-polypoidal shape (candidate ’c’) anda small diameter or a relative low protrusion points to a small clinically irrelevant candidate.A feature that is derived from the thresholded protrusion field should thereforeinclude the size of a candidate as well as the ratio between the largest diameter and themaximum protrusion. Moreover, the feature should characterize the whole segmentedarea instead of the extrema (like the largest diameter or the maximum protrusion).We
Figure 2: (a)–(b) Scatter plots of features calculated for data set ’A’. Grey dots denote false detections and black dots indicate polyps ≥ 6 mm. Note that each polyp may appear as two separate dots in the scatter plot, since each patient is scanned twice. (a) The maximum protrusion versus the single largest diameter of a candidate. The threshold of the candidate detection can be seen at a maximum protrusion of 0.4 mm. (b) FT (T=0.6mm) versus the largest diameter. (c–d) Two candidates with the same maximum protrusion that are ordered differently according toFT.
IV.CONCLUSION
REFERENCES
1. B.ACAR,C.F.BEAULIEU,S.B.GÖKTÜRK,C.TOMASI,D.S.PAIK,R.B.JEFFREY,J.YEE, AND S.NAPEL.EDGE DISPLACEMENT FIELD
-BASED CLASSIFICATION FOR IMPROVED DETECTION OF POLYPS IN CT COLONOGRAPHY.IEEETRANS.MED.IMAG.,21:1461–1467,DEC
2002.
2. B.ACER,S.NAPEL,D.PAIK,B.GOKTURK,C.TOMASI, AND C.F.BEAULIEU.USING OPTICAL FLOW FIELDS FOR POLYP DETECTION IN
VIRTUAL COLONOSCOPY. IN PROCEEDINGS OFTHE MEDICAL IMAGE COMPUTING AND COMPUTER-ASSISTED INTERVENTION CONFERENCE(MICCAI), OKTOBER 2001.
3. COLORECTAL CANCER FACTS & FIGURES.TECHNICAL REPORT NO.8617.00,AMERICAN CANCER SOCIETY,ATLANTA,2005. 4. W.F.AMES.NONLINEAR PARTIAL DIFFERENTIAL EQUATIONS IN ENGINEERING, VOLUME 1.NEW YORK:ACADEMIC PRESS,1972.
5. R.B.ARNESEN,E. VON BENZON,S.ADAMSEN,L.B.SVENDSEN,H.O.RAASCHOU, AND O.H.HANSEN.DIAGNOSTIC PERFORMANCE OF COMPUTED TOMOGRAPHY COLONOGRAPHYAND COLONOSCOPY: A PROSPECTIVE AND VALIDATED ANALYSIS OF 231 PAIRED EXAMINATIONS.ACTARADIOLOGICA,48:831–837,OCT 2007.
6. M.E.BAKER,L.BOGONI,N.A.OBUCHOWSKI,C.DASS,R.M.KENDZIERSKI,E.M.REMER,D.M.EINSTEIN,P.CATHIER,A.JEREBKO,S. LAKARE, A.BLUM, D. F. CAROLINE,AND M. MACARI.COMPUTER-AIDED DETECTION OF COLORECTAL POLYPS: CAN ITIMPROVE
SENSITIVITY OF LESS-EXPERIENCED READERS?PRELIMINARY FINDINGS.RADIOLOGY,245(1):140–149,2007.
7. A.BARBU, L.BOGONI, AND D.COMANICIU.HIERARCHICAL PART-BASED DETECTION OF 3DFLEXIBLE TUBES: APPLICATION TO CT
COLONOSCOPY.IN MED IMAGE COMPUTCOMPUTASSIST INTERVINTCONF MED IMAGE COMPUTCOMPUT ASSIST INTERV, VOLUME 9,
PAGES462–470,2006.
8. M.A. BARISH, J.A.SOTO, AND J.T. FERRUCCI. CONSENSUS ON CURRENT CLINICAL PRACTICEOF VIRTUAL COLONOSCOPY.AM. J. ROENTGENOL.,184(3):786–792,2005.
9. J.BERNSEN.DYNAMIC THRESHOLDING OF GREY LEVEL IMAGES.IN ICPRA’86:PROC.INT.CONF. ON PATTERN RECOGNITION, PAGES
1251–1255,1986
10. L. Bogoni, P. Cathier,M. Dundar, A. Jerebko, S. Lakare, J. Liang, S. Periaswamy,ME Baker, and M. Macari. Computer-aided detection
(CAD) for CT colonography:a tool to address a growing need. British Journal of Radiology, 78(SpecialIssue 1):S57, 2005.
11. J.H. Bond. Clinical evidence for the adenoma-carcinoma sequence, and the management of patients with colorectal adenomas. Seminars
in Gastrointestinal Disease,(4):176–184, 2000.
12. J.H. Bond. Colon polyps and cancer. Endoscopy, 33:46–54, 2003.
13. K.A. Brakke. The Motion of a Surface by Its Mean Curvature. PhD thesis,Princeton University, 1978.
14. D. Burling, S. Halligan, M.E. Roddie, J. McQuillan, L. Honeyfield, H. Amin,J. Dehmeshki, S.A. Taylor, and E.G. McFarland. Computed
TomographyColonography: Automated Diameter and Volume Measurement of ColonicPolyps Compared With a Manual Technique-In Vitro Study. Journal of ComputerAssisted Tomography, 29(3):387, 2005.
15. D. Burling, S. Halligan, S. Taylor, D.J. Brennand, D.G. Altman, P. Bassett, W. Atkin, and C.I. Bartram. Polyp Measurement Using CT
Colonography:Agreement with Colonoscopy and Effect of Viewing Conditions on Interobserverand IntraobserverAgreement. Am. J.
Roentgenol., 186(6):1597–1604, 2006.
16. D. Burling, S. Halligan, SA Taylor, L. Honeyfield, and ME Roddie. CT colonography:automatic measurement of polyp diameter