A Study on the V- Shaped Interference in
MST Radar Spectral Data
Shaik Khajamasthan
M. Tech. Student, Dept. of ECE, SVU College of Engineering, Tirupati, Andhra Pradesh, India
ABSTRACT: In this work, a study on the interference pattern in stacked power spectral density (PSD) plot of MST Radar is performed. The MST radar extracts atmospheric wind profile up to 20 km in Doppler Beam Swinging Technique, by obtaining atmospheric echoes from zenith, and off zenith beams in two orthogonal directions. The horizontal and vertical wind vector is obtained at each range gate by the mean Doppler shift in the radar echo from corresponding range bin. In addition to the peak corresponding to mean Doppler shift, additional interference peaks are observed in spectra of each range gate, resembling V-shape pattern in stacked PSD plot. A study is performed to find if the interference is due to the reception of strong atmospheric echo through the side lobes of radar antenna. In this attempt, we prove that V-shape interference pattern is not related to the echoes from the antenna Side lobes.
KEYWORDS:Atmospheric wind profile, Antenna array, radiation pattern, interference.
I. INTRODUCTION
The word “RADAR” is an acronym for Radio Detection And Ranging. It is a means of gathering information about distant targets by sending electromagnetic (EM) waves to them and analysing the echo signals. The characteristics of the signal received by the radar determine the location and velocity of the target object. The radars used in atmospheric science research emit pulse modulated electromagnetic energy waveforms using antenna array in to a specific volume of space based on the antenna radiation pattern. The propagating electromagnetic wave encounters changes in refractive index in the medium, hence the electromagnetic energy gets scattered in all directions, due to the change in electric property of the target region. The scattered energy that is being received back at the radar is called back scatter and this gives information about the target region. The basic information of the target that radar derives includes range and velocity parameters of target region. The range is the distance of the target atmosphere from radar and velocity is due to back ground wind movement. The shift in the carrier frequency of the reflected wave (Doppler Effect) is a measure of target’s relative (radial) velocity and is used to measure the velocity of the moving target region.
National Atmospheric Research Laboratory (NARL) at Gadanki (13.47° N, 79.18° E) near Tirupati, India has been operating 53MHz atmospheric radar called Mesosphere-Stratosphere-Troposphere (MST) radar for studying structure and dynamics of lower, middle and upper atmosphere. MST Radar provides estimates of atmospheric winds on a continuous basis with high temporal and spatial resolutions which is important in the study of the various dynamical processes of the atmosphere. MST Radar uses the echoes obtained over the height range of 1-1000km to study winds, waves, turbulence and atmospheric stability. Echoes below 50km arise primarily due toneutral turbulence, whereas echoes from above 50km echoes are due to irregularities in the electron density. In the height range of 22-60km, density of the atmosphere as well as electron density is very low resulting in very weak echoes resulting in gap region.
ISSN(Online): 2320-9801
ISSN (Print): 2320-9798
I
nternational
J
ournal of
I
nnovative
R
esearch in
C
omputer
and
C
ommunication
E
ngineering
(An ISO 3297: 2007 Certified Organization)
Website:www.ijircce.com
Vol. 5, Issue 1, January 2017
II.CONFIGURATIONOFMSTRADAR
MST radar is a high power, highly sensitive, pulse-coded, coherent Doppler radar to estimate the atmospheric wind vector using the Doppler shift in echoes. MST radar operating at 53 MHz consists of efficient antenna system that transmits high power pulsed RF signals into the atmosphere and receives the backscattered echoes. MST radar obtains wind vector in troposphere and stratosphere up to the height range of 20 km from the antenna far-field boundary of about 4km. The primary echoing mechanism involves coherent back scatter from turbulent irregularities having size equal to one-half of the radar wavelength. The block diagram of MST radar is presented in figure 1, where Antenna array and feeder network, Exciter, Transmitter, Receiver, Radar controller and Signal processing sections are shown in different colors.
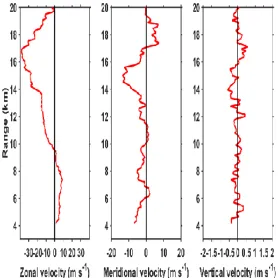
Figure 2 presents the components of typical wind vector up to the height of 20 km, Zonal wind velocity (U) is obtained from in East-West direction antenna beams, the Meridional velocity (V) is obtained from the antenna beams steered in North-South direction. The horizontal wind velocity is considerably high compared to the vertical wind (W) obtained from zenith pointed antenna beam. The figure presents the result of the radar data obtained on 07th June 2016 data set. The east west winds at the height of around 17km are about 40 ms-1, that equal to about 145 km per hour.
I.
Fig 2: Wind Vector - U, V and W components (wind components in Zonal, Meridional and Vertical direction) obtained from the MST Radar data of 07th June 2016.
III. PROPOSEDALGORITHM
ISSN(Online): 2320-9801
ISSN (Print): 2320-9798
I
nternational
J
ournal of
I
nnovative
R
esearch in
C
omputer
and
C
ommunication
E
ngineering
(An ISO 3297: 2007 Certified Organization)
Website:www.ijircce.com
Vol. 5, Issue 1, January 2017
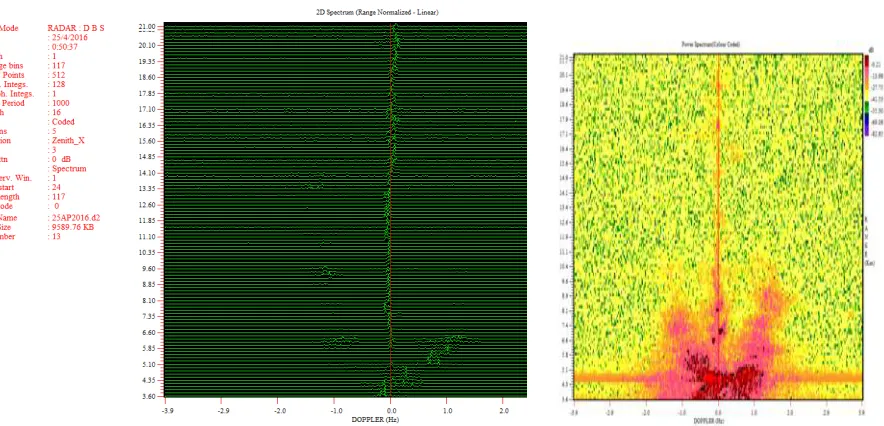
Figure 3 (a). 2D PSD plot of the MST Radar data for Zenith beam. (b). The color coded plot of similar data set as in fig 3(a), where the data is contaminated with V-shape interference appearing in red color, where strong signal is observed.
IV. ANTENNA ARRAY PATTERN AND ITS RELATION TO DOPPLER BEAM SWINGING TECHNIQUE OF WIND ESTIMATION
The MST radar antenna array consists of 1024 array elements that are identical 3 element Yagi-Uda Antennas. The total field of an array is a vector superposition of the fields radiated by the individual elements. To provide very directive pattern, the partial fields (generated by the individual elements) interfere constructively in the desired direction and interfere destructively in the remaining space. The geometrical configuration of the overall array is rectangular planar array (32 X 32 element), the relative placement of the elements is uniform distribution (0.7 λ), the
two dimensional Taylor Distribution excitation of amplitude of the antenna elements generate a side lobe level of -20 dB, the beam steering is achieved by the control of excitation phase of each element. The antenna array pattern in one dimension is shown in figure 4, where mail lobe and side lobes are observed. The first side lobes are observed at about
4.5° apart because of the spacing of the antenna elements 0.7 λ (Total array is about 23 λ in both the X and Y
Fig 4: Antenna array pattern of 1024 element rectangular array.
The radial velocity, vr, measured with off-zenith beam positions, can be described by vr = vhxcos θ+ w sin θ, where vhx is the horizontal wind component, w is the vertical wind component, θ is the elevation angle of the radar antenna beam. Hence the angle of the antenna beam orientation is a critical one in resolving the winds. If the signal is contaminated by winds obtained by side lobes, it will create error in wind estimation. Since the mail lobe and side lobes are distinctly separated, the contribution from side lobes cannot be separated in real time data set. In this activity the estimation of the wind pattern is obtained by main beam and first side lobe is performed. The plot in figure 5 is showing the corresponding pattern of the estimated Doppler shift of the main beam (red) and first side lobes (blue) in both the sides.
ISSN(Online): 2320-9801
ISSN (Print): 2320-9798
I
nternational
J
ournal of
I
nnovative
R
esearch in
C
omputer
and
C
ommunication
E
ngineering
(An ISO 3297: 2007 Certified Organization)
Website:www.ijircce.com
Vol. 5, Issue 1, January 2017
Fig 5(b): Doppler shift observed in east, west, north and south direction beams data obtained by the MST radar on 09 Sep 2016 data, derived similar to the figure 5(a).
The experiments are performed two days on 7th and 9th June 2016 and the results of the estimated Doppler shift by main beam and the simulated Doppler shift with side lobes are presented in figures 5(a), 5(b). The results show clear distinction of the interference pattern and estimated Doppler shift with the side lobe of antenna array, and the previously shown interference bands in the spectral plots in the figure 3.
V.RESULTS AND CONCLUSION
In this work v-shape interference of MST RADAR spectral plots is shown not actually due to the side lobes of RADAR antenna. The data in all the oblique beams in east, west, north and south directions are observed. It is proved the V-shape interference is not related to Side lobes of MST RADAR. MATLAB code has been implemented successfully for the estimation of Doppler shift due to side lobes. No agreement is seen between the original MST RADAR interference spectrum and Doppler shift estimation from the side lobes of MST RADAR from the comparison plots shown in fig 3, 4 and 5.
REFERENCES