ABSTRACT
KIM, SANG-HWAN. Examining and Explaining the Effects of Non-Iconic Conformal Features in Advanced Head-up Displays on Pilot Performance. (Under the direction of Dr. David B. Kaber.)
The primary objective of this study was to assess the impact of Synthetic Vision System (SVS) and Enhanced Vision System (EVS) depictions of terrain features on pilot performance when displayed in an advanced head-up display (HUD) during various phases of a landing approach under instrument meteorological conditions (IMCs). SVS is a display system that presents terrain features using a wireframe grid rendered polygons by integrating terrain databases with a global positioning system. EVS displays present an actual out-of-cockpit view using a forward looking infrared camera.
path. The experiment involved observing pilot performance in four segments during the approach and landing. Dependent variables included flight path control performance, pilot SA, workload, and subjective preferences. Flight path control performance was determined based on pilot errors in tracking a flight path marker in the pre-recorded videos with a super-imposed cursor using test pilots yoke controls. Pilot situation awareness (SA) was measured using SAGAT (the Situation Awareness Global Assessment Technique) in order to evaluate pilot perception, comprehension, and projection for three types of pilot SA (spatial, system, and task awareness). Workload measures were recorded using the NASA-TLX (Task Load Index) and heart-rate. In order to develop explanations of pilot behavior under the various HUD conditions, a video record of the additional test trial was reviewed by each subject using a verbal protocol analysis and probing technique.
of pilot SA were affected by segment. Because the main task in the study was the tracking task, results did not reveal differences of conditions in terms of workload measures. Interestingly, patterns of pilot preference for displays did not match with the results of objective performance and SA measures. Pilots gave higher ratings of SA support and safety for the SVS and EVS displays with the lowest ratings for the combination. Ratings on annoyance increased with increases in display visual content.
The verbal protocol analysis yielded sequential and non-sequential lists of pilot tasks and behaviors and critical pilot comments. The analysis also identified the required information and alternative methods of performance for specific flight tasks in the scenario. This analysis was used to explain the experimental results and describe pilot behaviors with the SVS and EVS displays in the flight scenario.
Examining and Explaining the Effects of Non-Iconic Conformal Features in Advanced Head-Up Displays on Pilot Performance
by
Sang-Hwan Kim
A dissertation submitted to the Graduate Faculty of North Carolina State University
in partial fulfillment of the requirements for the degree of
Doctor of Philosophy
Industrial Engineering
Raleigh, North Carolina 2009
APPROVED BY:
Nancy J. Currie Member
Brad Mehlenbacher Member
Eric N. Wiebe Member
Robert A. St. Amant Minor Representative
DEDICATION
To my dear wife and familyfor their unconditional love and support.
BIOGRAPHY
Sang-Hwan Kim was born and raised in Seoul, Korea. He completed his high school education in Kwacheon in 1993. He then joined the SoongSil University studying for B.S. degree in Industrial Engineering. Following military service in the Korean Army during 1995-1997, he resumed his studies and graduated in 2000. He received his M.S. degree from Korea University in Industrial Engineering in 2002, where his research focused on human factors, usability, and Human-Computer Interaction (HCI) under the advisement of Dr. Rohae Myung. During the next three and half years he worked for Samsung Electronics in Korea as an HCI and usability researcher and a user interface/interaction designer.
ACKNOWLEDGEMENTS
I would like to express my deepest appreciation to Professor Dr. David Kaber for his continuing encouragement and advice through the course of this work. Dr. Kaber has helped me in every aspect of my education. He has been a true mentor and friend. I am greatly honored to have had the opportunity to work under his tutelage. I would also like to thank the members of my committee, Dr. St. Amant, Dr. Wiebe, Dr. Mehlenbacher, and Dr. Currie for their trust during my work and providing a source of confidence. I also thank Dr. Prinzel and Dr. Bailey of NASA for allowing me to use the flight simulator at the NASA Langley research center for video recordings.
I offer this dissertation as the second payment on a debt I owe to the students and my colleagues in the Industrial and System Engineering department and Ergonomics Lab. Specifically, I thank the student colleagues past and present, who helped me to go on through their scholarly example and personal concern in Cognitive Ergonomics Lab. Especially, I wish to express my special appreciation to Karl Kaufmann (referred to as the “expert pilot” in this manuscript), a colleague in the lab, for his assistance during the experiment and writings, including flight scenario development, pilot testing, cognitive task analysis, etc.
doubted and devoted their whole efforts to me and to my parents-in-law for excusing me from many of my family duties and letting me concentrate on my research.
TABLE OF CONTENTS
LIST OF TABLES ... ix
LIST OF FIGURES ...x
LIST OF ABBREVATIONS ... xii
1. INTRODUCTION ...1
1.1. Challenges in Avionic Display Design / Development ... 1
1.1.1. Flight accidents under low visibility conditions... 1
1.1.2. Synthetic / Enhanced Vision Systems (SVS/EVS) ... 3
1.1.3. Head-up display (HUD) ... 8
1.2. Previous Studies of Advanced Flight Displays ... 12
1.2.1. Use of SVS, path guidance and tunnel features ... 13
1.2.2. Integration of SVS and EVS displays ... 17
1.2.3. Applying SVS/EVS features in HUDs ... 23
1.2.4. Summary of previous studies on advanced display concepts ... 26
1.3. Human Factors Issues ... 28
1.3.1. Pilot situation awareness ... 28
1.3.2. Cognitive Task Analysis (CTA)... 41
2. PROBLEM STATEMENT ...48
2.1. Limitations of Previous Research ... 48
2.2. Research Objectives ... 50
3. METHODS ...52
3.1. Part I: Experimental Study ... 52
3.1.1. Equipment and Experiment Environment ... 53
3.1.2. HUD features investigated in study ... 57
3.1.3. Flight scenario ... 63
3.1.4. Video stimuli preparation ... 71
3.1.5. Experiment application. ... 75
3.1.6. Participants ... 78
3.1.7. Experiment design ... 79
3.1.9. Dependant variables (DVs) and measures... 91
3.1.10. Procedure... 94
3.1.11. Specific hypotheses ... 96
3.1.12. Data analyses ... 99
3.2. Part II: Cognitive Task Analysis ... 102
3.2.1. Procedure... 103
3.2.2. Outcomes of the CTA ... 104
4. RESULTS ...106
4.1. Part I: Results of Experiment ... 106
4.1.1. Analysis of tracking difficulty ... 106
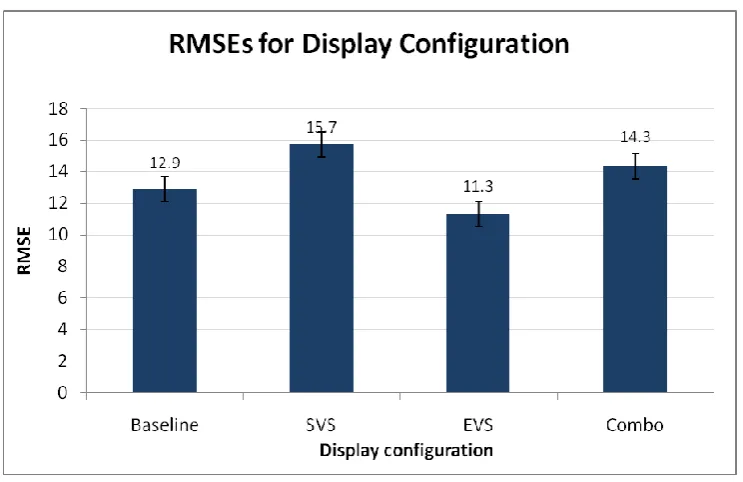
4.1.2. Flight path control performance ... 107
4.1.3. Pilot SA ... 111
4.1.4. Pilot workload ... 120
4.1.5. Subjective preference ratings ... 121
4.2. Part II: Results of CTA ... 124
4.2.1. Sequential events and tasks ... 125
4.2.2. Non-sequential tasks ... 130
4.2.3. Critical comments from pilots ... 137
4.2.4. Patterns of pilot attention shifting ... 143
5. DISCUSSION ...146
5.1. Flight path control ... 146
5.2. Pilot SA ... 148
5.3. Pilot workload ... 151
5.4. Pilot subjective preferences for displays ... 152
5.5. CTA results ... 152
6. CONCLUSION ...154
6.1. Outcomes related to objectives ... 154
6.1.1. The effects of an advanced HUD features on pilot performance ... 154
6.1.2. The use of an elaborate SAGAT methodology for assessing pilot SA ... 155
6.1.3. The use of CTA for aviation applications ... 156
6.4. Caveats ... 157
6.5. Future research directions ... 160
APPENDICES ...177
APPENDIX A: Task Flight Scenario ... 178
APPENDIX B: Situation Awareness Global Assessment Questions ... 182
APPENDIX C: Informed Consent Form ... 185
APPENDIX D: Demographic Questionnaire ... 187
APPENDIX E: NASA-TLX Forms ... 188
LIST OF TABLES
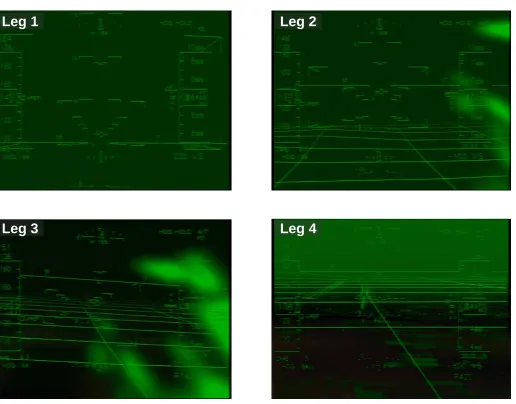
Table 3.1. Characteristics of each leg of flight. ...69
Table 3.2. Pilot flight time data . ...79
Table 3.3. Sample questions for verbal protocol analysis. ...104
Table 4.1. ANOVA results on RMSE data. ...108
Table 4.2. Summary of F-test results on SAGAT scores. ... 112
Table 4.3. Results of post-hoc analyses for display effect on three types of pilot SA. .... 116
Table 4.4. Results of post-hoc analyses for leg effect on three types of pilot SA. ... 118
Table 4.5. Summary of F-test results on five subjective preference questions. ...122
Table 4.6. Mean ratings on five subjective preference questions. ...124
Table 4.7. Sequential events and tasks for Leg 1. ...126
Table 4.8. Sequential events and tasks for Leg 2. ...128
Table 4.9. Sequential events and tasks for Leg 3. ...129
Table 4.10. Sequential events and tasks for Leg 4. ...130
Table 4.11. Non-sequential tasks. ...132
LIST OF FIGURES
Figure 1.1. Synthetic vision system concept ...4
Figure 1.2. Enhanced vision image obtained by FLIR on approach to a runway under actual instrument meteorological (flight) conditions . ...6
Figure 1.3. Head-up display (HUD) and Head-down display (HDD) in aircraft cockpit. ...9
Figure 1.4. Typical HUD symbology overlaid on out-of-cockpit view. ...10
Figure 1.5. HUD with SVS terrain and EVS imagery ...12
Figure 3.1. Integration Flight Deck (IFD) Simulation Facility at NASA Langly. ...55
Figure 3.2. Simulator setup for experiment. ...56
Figure 3.3. Baseline HUD symbologies ...59
Figure 3.4. Flight path marker group. ...60
Figure 3.5. HUD with runway outline and glideslope reference line. ...60
Figure 3.6. HUD with SVS terrain features. ...61
Figure 3.7. HUD with EVS features. ...62
Figure 3.8. HUD with combination of SVS and EVS features. ...63
Figure 3.9. Concept of the approach scenario. ...67
Figure 3.10. ILS approach plate for 16R at KRNO. ...68
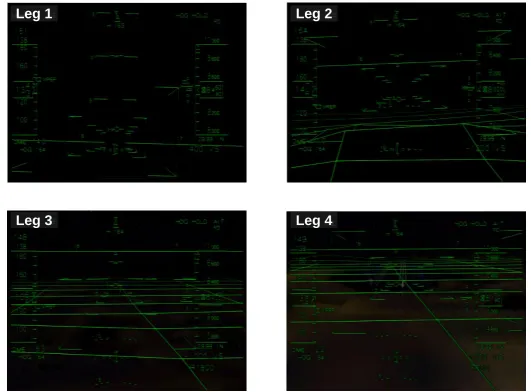
Figure 3.11. Example of imagery synthesized for the IMC-day condition. ...73
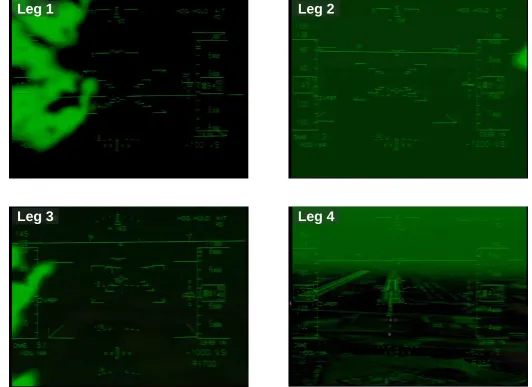
Figure 3.12. Example of imagery synthesized for the IMC-night condition. ...74
Figure 3.13. A screenshot of the Java application playing a video of the HUD. ...77
Figure 3.14. Overlaid cursor for tracking FPM ...77
Figure 3.15. Baseline HUD for IMC-day condition. ...83
Figure 3.16. SVS HUD for IMC-day condition. ...84
Figure 3.17. EVS HUD for IMC-day condition. ...85
Figure 3.18. Combo HUD for IMC-day condition. ...86
Figure 3.19. Baseline HUD for IMC-night condition. ...87
Figure 3.21. EVS HUD for IMC-night condition. ...89
Figure 3.22. Combo HUD for IMC-night condition. ...90
Figure 4.1. RMSEs for each display configuration. ...108
Figure 4.2. RMSEs for IMC conditions. ...109
Figure 4.3. RMSEs for display configuration by IMC condition. ... 110
Figure 4.4. RMSEs for leg by display configuration. ... 111
Figure 4.5. Overall SA scores for each display configuration. ... 113
Figure 4.6. Overall SA scores for each leg. ... 114
Figure 4.7. Level 3 SA scores for IMC condition by leg. ... 115
Figure 4.8. SA scores for types of pilot SA by display configuration. ... 117
Figure 4.9. SA scores for types of pilot SA by IMC condition. ... 117
Figure 4.10. SA scores for types of pilot SA by leg. ... 118
Figure 4.11. SA scores for system awareness for display configuration by leg of flight. ... 119
Figure 4.12. SA scores for system awareness for IMC condition by leg of flight. ...120
Figure 4.13. Subjective ratings on “Annoyance level” for display configuration. ...122
Figure 4.14. Pattern of typical pilot attention shifting. ...144
LIST OF ABBREVATIONS
ACTA Applied (Advanced) Cognitive Task Analysis AFFTC Air Force Flight Technical Center
AFL Above Field Level
AGL Above Ground Level
ATIS Automatic Terminal Information System CFIT Controlled Flight Into Terrain
CTA Cognitive Task Analysis
DH Decision Height
DIME Database Integrity Monitoring Equipment DME Distance Measuring Equipment
EADI Electronic Attitude Direction Indicator EFIS Electronic Flight Instruments
EPIC Executive-Process/Interactive Control EVS Enhanced Vision Systems
FAA Federal Aviation Administration
FAF Final Approach Fix
FAR Federal Aviation Regulations FCP Flight Control Panel
FLIR Forward-Looking Infrared FMS Flight Management System
FO First Officer
FOV Field Of View
FPM Flight Path Marker
FSF Flight Safety Foundation FTE Flight Technical Errors GDTA Goal-Directed Task Analysis
GOMS Goal, Operator, Method, Selection of rules GPS Global Positioning System
G/S Glideslope
GSRL Glideslope Reference Line
GPWS Ground Proximity Warning System HDD Head-Down Displays
HITS Highway-In-The-Sky
HMD Head (Helmet)-Mounted Displays
HR Heart Rate
IFD Integration Flight Deck ILS Instrument landing Systems
IMC Instrument Meteorological Conditions INS Inertial Navigation System
KRNO Reno/Tahoe International Airport LAAS Local Area Augmentation System
LOC Localizer
LWIR Long-Wave Infrared MCP Mode Control Panel MDA Minimum Descent Altitude MDS Multidimensional Scaling MMWR Millimeter Wave Radar MS Military Standard
MSL Mean Sea Level
NASA-LaRC NASA Langley Research Center NASA-TLX NASA-Task Load Index
ND Navigation Displays OTW Out-of-the-Window PFD Primary Flight Display RMSE Root Mean Square Error
RNAV Area Navigation
RWY Runway
SA Situation Awareness
SAGAT Situation Awareness Global Assessment Technique SART Situation Awareness Rating Technique
SA-SWORD Situation Awareness-Subjective Workload Dominance Technique SpA Spatial awareness
STSS Short-Term Sensory Store SVS Synthetic Vision Systems
TAWS Terrain Awareness Warning Systems TCAS Traffic Collision Avoidance System VMC Visual Meteorological Conditions
V/S Vertical Speed
1. INTRODUCTION
1.1. Challenges in Avionic Display Design / Development
1.1.1. Flight accidents under low visibility conditions
In order to reduce the accident rate and enhance aviation safety, various systems (e.g. altitude indicators, radio navigation, instrument landing systems (ILS), ground proximity warning systems) have been developed and introduced to overcome the issues associated with limited outside visibility for the pilot. Recent advanced devices include moving map displays, incorporating Global Positioning System (GPS) capability for improved navigational accuracy, terrain awareness warning systems (TAWS) and enhanced ground proximity warning systems. However, all of aircraft information display concepts require pilots to perform various mental transformations of display data (decoding) to support flight control in a real-time environment when outside visibility is restricted (Prinzel et. al, 2002). In addition, although the TAWS technology may help to mitigate some factors causing CFIT, its use generally follows the information processing model of “warn-act” and, therefore, requires the flight crew to be reactive rather than proactive in dealing with terrain hazards. Theoretically, TAWS provides a warning when the flight crew has already lost SA, and may not be optimal given the reaction time required to adequately recognize and assess the situation and initiate an escape maneuver (Moroze & Snow, 1999).
of) a potential collision with terrain is needed (Prinzel et. al., 2004a)
1.1.2. Synthetic / Enhanced Vision Systems (SVS/EVS)
NASA and its industry partners have designed and prototyped novel crew-vehicle interface technologies that strive to proactively overcome aircraft safety issues due to low-visibility conditions by providing the operational benefits of clear day flight through cockpit displays, regardless of the actual outside visibility conditions (Bailey et al., 2002). These technologies include the use of non-iconic features, such as synthetic vision systems (SVS) and enhanced vision systems (EVS).
Synthetic Vision is a computer-generated display image of the out-of-cockpit scene topography based on aircraft attitude, high-precision navigation instrumentation, and data on the surrounding terrain, obstacles, cultural features, etc. SVS databases have been developed to support this display technology with real-time integrity in order to ensure accurate pilot detection of real obstacles and to plan and verify accurate flight navigation. SVS displays can also support accurate traffic surveillance (Bailey et al., 2006).
sets are blended with on-board Inertial Navigation System (INS) information (Bailey et al., 2002).
Figure 1.1. Synthetic vision system concept (Arthur et al., 2004).
It has been suggested that this display concept presents information to pilots with a level of realism that is comparable to flying under visual meteorological conditions (VMC), such as a clear and sunny day, regardless of the actual outside weather conditions (Prinzel et al., 2002). Consequently, it has also been speculated that the enhanced visibility provided with SVS may significantly improve terrain awareness and reduce the potential for CFIT incidents compared to current cockpit navigation display technologies.
attitude direction indicators, or primary flight displays, in transport airplanes with new display concepts, including SVS and EVS, in order to increase pilot SA as well as promote operational capabilities for landing in low-visibility weather conditions. To date, research has successfully demonstrated both the safety and capability benefits of SVS technologies in flight (Snow et al., 1999), landing (Prinzel et al., 2004a; Schnell et al., 2005; Bailey et al, 2006) and taxi operations (Wilson et al., 2002). (Some specific empirical studies are reviewed in the next chapter.) Thus, such display systems are expected to reduce the occurrence of accident precursors, including (Parrish et al., 2001; Bartolone et al., 2005):
Pilot loss of vertical and lateral spatial awareness.
Pilot loss of terrain and traffic awareness on approach.
Unclear escape or go-around path after recognition of flight problem.
Pilot loss of altitude awareness.
Pilot loss of SA relating to the runway environment and incursions.
Unclear path guidance on the surface.
(or helmet)-mounted displays (HMD), and navigation displays (ND) in the cockpit. An EVS is an electronic means by which to provide a display of the external (out-of-cockpit) scene by using an imaging sensor, such as a Forward-Looking InfraRed (FLIR) or millimeter wave radar (MMWR). Such sensors are used to penetrate weather phenomena, including fog, haze, rain, and snow. Figure 1.2 shows an example of an enhanced vision image obtained by FLIR. Like other advanced cockpit display concepts, the design and development of EVS technology was initiated for application to military aircraft. Currently, business jets incorporate EVS displays as a type of night-vision technology. Based on the development of this technology, in 2004, Section 91.175 of the US Federal Aviation Regulations (FAR) was amended such that pilots conducting “straight-in” instrument approach procedures may now operate aircraft below published Decision Heights (DH) or Minimum Descent Altitudes (MDA), when using an approved EVS presented on a HUD (Bailey, 2007).
The intended use of EVS mirrors SVS; both strive to eliminate low-visibility conditions that may cause major flight accidents and to provide the operational benefits of VMC, regardless of actual out-of-cockpit visibility conditions (Bailey et al., 2006). Bailey et al. (2006, 2007) stated that the use of SVS and EVS in the same display may be complementary, even though SVS and EVS had previously been perceived as competing technologies (Bailey et al., 2002). A combined system integrating both SVS and EVS imagery may reduce the disadvantages inherent to either system alone. The SVS technology has some advantages over EVS technology in providing terrain, path and obstacle awareness, which may be obscured by clouds, which an EVS sensor cannot penetrate. Another advantage of the SVS is that it can provide virtually unlimited visibility. On the other hand, EVS can provide a direct view of the external environment, independent of a database. That is, EVS can show “live” imagery of what actually lies ahead of the aircraft, while SVS cannot be used to detect dynamically changing scenery, such as other aircraft or ground vehicles. Beyond this, fixed obstructions may be missing from the terrain database used to support the SVS display, depending upon the database update rate (Ertem, 2005). A pilot using EVS can also develop an extremely high degree of confidence in the system output.
the requirements for display configurations by considering human performance implications. However, there remain a number of human factors issues relating to the development of SVS and EVS technology for effective implementation (Bailey et al., 2006). Corker and Guneratne (2002) categorized the human factors issues associated with SVS/EVS displays into three research areas: image quality, information integration, and operational concepts. Prinzel and Kramer (2006) summarized these issues as follows:
Image Quality: Field-of-view, display size, clutter, iconography, display contrast,
and opacity.
Information Integration: Guidance, terrain presentation, cognitive tunneling,
display integration, trend information, skill retention, and workload demand.
Operational Concept: Flight phase transition, crew interaction, failure modes, essential information, effect at various workloads, crew confidence in system, and resource management.
Among these issues, several have been investigated by experimental studies and several others are still unaddressed. These will be reviewed later.
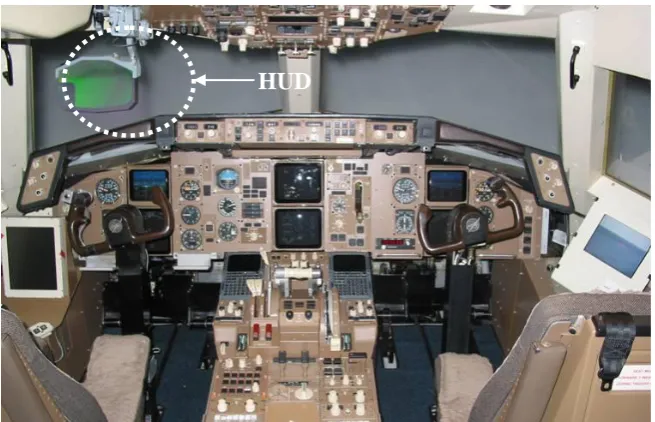
1.1.3. Head-up display (HUD)
transparent screen. Figure 1.3 shows a HUD (left, in the circle) and HDD (right). The HUD supports effective control of an aircraft by facilitating pilot simultaneous scanning of both instruments and the outside environment. Under instrument meteorological conditions (IMC) in landing, a pilot must rely on instrumentation until visually acquiring the runway. The capability to stay “head-up”, despite IMC conditions, is a significant advantage of advanced HUDs (Prinzel & Risser, 2004).
Figure 1.3. Head-up display (HUD) (left) and Head-down display (HDD) (right) in aircraft cockpit (Kramer et al., 2005).
situational awareness, resulting in improved aircraft safety (Wood & Howells, 2001). The symbologies used in HUDs are very similar to the symbols used in a Primary Flight Display (PFD). This eases pilot transitions from head-down instruments to the HUD symbology. Figure 1.4 shows a typical HUD (in-flight) with “primary” mode symbology.
Figure 1.4. Typical HUD symbology overlaid on out-of-cockpit view.
design include the use of pathway/tunnel/highway-in-the-sky (HITS) features, and EVS and SVS (Prinzel & Risser, 2004; Wood & Howells, 2001). The stroke of symbols and raster images making-up these features represent visual properties of the HUD (Wickens et al, 1998). The features are also typically presented as conformal displays, spatially overlaying the far visual domain (out-of-cockpit view) (Wickens, 1994). Related to this, previous research has investigated whether advanced HUDs with conformal symbology, promoting information proximity between spatial information and system information, provide an additional advantage for pilot performance over conventional HUDs or HDDs (Ververs & Wickens, 1998). General results revealed that advanced HUDs provide an advantage in the detection of events both in the symbology and the environment, as well as the benefit of reduced scanning over HDDs.
Figure 1.5. HUD with SVS terrain (left) and EVS imagery (right) (Schnell et al. 2005).
1.2. Previous Studies of Advanced Flight Displays
1.2.1. Use of SVS, path guidance and tunnel features
As previously stated, the use of SVS technology is expected to reduce aircraft accidents, in particular CFIT, due to the display information (terrain model) enhancing pilot SA under low visibility conditions. Several studies have been conducted to assess this expectation and to investigate the effect of specific SVS features on pilot performance. In general, studies have focused on the effects of display sizes and corresponding field of view (FOV), terrain textures, guidance images, and tunnel images on flight path tracking performance, SA, workload, or subjective display ratings.
Prinzel et al. (2002) conducted flight tests to evaluate the effects of three display concepts, including a HDD (Size A; 5.25” x 5.25”), a second HDD (Size X; 8”x 10”) and a HUD as well as two terrain texture concepts (photorealistic and generic) on SA and flight performance/error. Situation awareness was measured using the SA-SWORD (Situation Awareness – Subjective Workload Dominance) technique. Results showed that the HUD and size "A" SVS-HDD concepts significantly improved pilot SA and flight path control. However, there were no significant differences in texture concepts although subjects reported subjective preference for photorealistic texture for improved SA. In general, Prinzel et al. confirmed the hypotheses that SVS would provide safety and performance benefits over traditional EFIS (Electronic Flight Instruments) or EADI (Electronic Attitude Direction Indicators).
recommendations for cockpit display design. In one of their experiments, they investigated the effects of different types of displays, including a HUD and three sizes of HDD (A, X and D (6.25” x 6.25’’)) for presenting SVS information, two types of textures (photorealistic and generic) and two runway conditions on performance, subjective preference ratings, workload and SA (using SA-SWORD). Results demonstrated that the different display sizes did not affect flight performance and that the use of the HUD for presenting SVS information reduced lateral path error, as compared to the HDD. Regarding the texture rendering, there was no significant effect on flight performance as a result of using different terrain texture images, i.e., photo-realistic versus generic texture.
go-around situation. Situation awareness was measured using the Situation Awareness Rating Technique (SART) and SA-SWORD. Workload was measured using modified Cooper-Harper ratings. Results confirmed that the use of the SVS allowed pilots to detect CFIT more efficiently than baseline concepts. It was also revealed that a Size “X” HDD and HUD with SVS yielded lower workload and better terrain awareness.
dynamic crow’s feet and two forms of guidance, including tadpole and ghost concepts, for a HUD. Overall, the results demonstrated that presenting any kind of tunnel feature can produce better performance in terms of RMSE, workload and SA. It was also demonstrated that the concept of a dynamic crow’s feet tunnel and tadpole guidance were most appropriate to use in a SVS HUD.
situation. Schnell et al. (2004) also said that the lack of results on SA did not necessarily mean cognitive tunneling had occurred in the form of pilot reliance on the pathway tunnel image because the workload measures were lower in the SVS condition than with the conventional PFD. However, other studies have pointed-out that pathway tunnels may cause cognitive tunneling. According to experimental research (Alexander et al., 2003; Thomas & Wickens, 2004; Wickens et al., 2004), it was found that, while pathway tunnels in a SVS display can support better flight path tracking, they may degrade traffic awareness and pilot ability to detect unexpected events. The compellingness of the symbology may cause pilots to focus on virtual pathways and enter smaller but more frequent control inputs to maintain closer adherence to the flight path. Pilots may pay an undue amount of attention to the SVS display and far less to other displays, regardless of their relevance to certain tasks such as detecting outside-world unexpected events (Wickens et al., 1998; Thomas & Wickens, 2004).
1.2.2. Integration of SVS and EVS displays
SVS database system creates and presents incorrect information to a pilot, who is relying on the system in an IMC situation. Theunissen et al. (2004) also noted that the Achilles-heel of any database-oriented system is that the quality of the match between the real and the synthetic world is influenced by the quality of data used to generate the synthetic world. This implies that no operations will be allowed in which an undetected error in a database used for synthetic vision can create a hazardous situation. With this in mind, Bailey et al. (2002) introduced two potential techniques to reduce the possibility of SVS displays presenting misleading information. One was development of a complementary system called Database Integrity Monitoring Equipment (DIME) and another was the additional use of EVS, real-time and non-database elements.
aspects of EVS and SVS while mitigating the negative aspects of each concept (e.g., misalignments in SVS images with terrain and low EVS image quality influenced by atmospheric conditions) (Bailey et al., 2002).
In other domains besides aviation, image fusion technologies for supporting human performance under low visibility environments have been investigated. For example, Bender, Reese and van der Wal (2003) presented an optimal image fusion algorithm based on various image sensors (e.g., Long-Wave Infrared (LWIR), Forward-Looking Infrared (FLIR) and thermal sensors) to support military drivers using vision enhancing Helmet-Mounted Displays (HMD). In general, image fusion technology has been considered to have advantages for navigation, surveillance, fire control, and missile guidance by improving position control accuracy. McDaniel et al. (1998) found a well-designed image fusion system to increase human visual scan comprehension. With this research in mind, the use of unmodified/pure SVS and EVS images in an integrated, single display format is expected to minimize operator visual scan and cognitive efforts by promoting visual proximity of terrain information with aircraft symbology information (Bailey et al., 2007).
two display types, including one with pilot selectable features and another with automatic feature selection. During the trials in which the display was pilot selectable, all possible combinations of seven features (sensor images, opacity of sensor images, field of view, guidance cues, runway outlines, display alignment, and obstacles) could be selected by pilots. Subjective workload ratings and questionnaire responses were collected across three legs of flight in approach and landing situations. Results demonstrated that pilots preferred the sensor image (EVS feature) to be on during the whole approach, and they also regarded synthetic overlaying of the runway outline as an important feature. It was noted that the best approach to feature integration depended on the tasks to be performed and the intended use of the resulting information.
which showed a synthetic tunnel image to improve flight performance. In other words, it can be said that the critical objective of improving flight performance might be largely facilitated by the presentation of tunnel images in a HUD.
1.2.3. Applying SVS/EVS features in HUDs
Regarding the efficacy of using conformal feature concepts, such as SVS, in HUDs instead of in HDDs, several studies have confirmed SVS-HUDs to be comparable to SVS-HDDs in terms of flight performance, pilot SA or workload (Prinzel et al., 2003, 2004a). Such displays may even improve pilot abilities (Alexander et al., 2003; Thomas & Wickens, 2004; Wickens et al., 2004; Schnell et al, 2005) because the SVS-HUD can provide conformal guidance information. However, since the visual properties of HUDs are different from those of HDDs, including monochromatic color (HDDs present full color), size, location, and overlap of display symbology (strokes) and raster images on out-of-cockpit views, different research studies have investigated the application of specific SVS/EVS concepts in HUDs. In general, these efforts have examined the effects of HUD image features, including terrain texture, pathway tunnels and EVS images, on flight performance, workload, SA or subjective preferences. The objective has been to demonstrate the efficacy of the features as well as determine optimal HUD configurations.
significant differences in flight performance across the terrain textures.
Using a similar approach, Snow, Reising, Kiggett, and Barry (1999) examined the utility of pathway-in-the-sky HUD symbology in three experiments. In a first experiment, they compared a pathway guidance HUD and a Military Standard (MS) HUD under IMC at night. The complexity of the approach (simple or complex) to landing was also manipulated. Results demonstrated that pilots were more accurate in the flight performance when flying with the pathway HUD, as compared to the MS-HUD. In a second experiment, they compared pilot performance with the pathway HUD under three different visibility conditions (VMC, partial IMC and full IMC). Results demonstrated performance under IMC to be equivalent to performance under VMC, when using the HUD with tunnel symbology. In a third experiment, Snow et al. tested the utility of the pathway guidance HUD in flying complex flight paths. They compared IMC night versus IMC day conditions and manipulated the format of a synthetic terrain model in the HUD (grid, partial grid, texture map or none). They used the SAGAT and SA-SWORD to evaluate HUD use. Results revealed a significant effect of the synthetic terrain format on pilot SA. Pilot SA was best with the grid and texture map conditions. The no synthetic terrain condition greatly decreased SA.
ND; (2) EVS featured HUD, baseline PFD and ND; (3) SVS featured HUD, PFD and ND; and (4) SVS-PFD and ND without the presence of a HUD. Response measures, including path control performance, workload and SA (using SA-SWORD) were collected and analyzed. Results revealed that the baseline combination produced higher workload than the other configurations and that the use of SVS improved pilot SA. Path control performance was not significantly different across the display combinations as all conditions involved pathway tunnels.
major factors; one was visual density, a bottom-up (data-driven) factor, and another was information density, a top-down (knowledge-driven) factor. While the studies conducted by Kaber et al. (2007a, b) and Alexander et al. (2008) used static images of HUD configurations for assessing existence of perceived clutter, later study (Kaber et al., 2008) was conducted using an advanced flight simulator (Integration Flight Deck simulator at NASA Langley, Figure 3.1). Using this facility, Kaber et al. (2008) assessed influences of pilot experience, HUD configuration, flight segment, as well as flight workload on perceptions of display clutter and cognitive load, and flight task performance, in order to develop and validate a new measure of display clutter. They developed a multidimensional measure of display clutter, revealed relations between perceived clutter with subjective workload, and found negative effects of “low” and “high” clutter displays on and flight task performance (stability and RMSE). However, individual effects of terrain features on flight performance, SA, or workload were not assessed in the experiments by Kaber et al. (2007a; 2008) and Alexander et al. (2008).
1.2.4. Summary of previous studies on advanced display concepts
when and why it is best to use particular displays.
1.3. Human Factors Issues
Based on the limitations of previous research identified in the prior section, there is a lack of studies evaluating effects of SVS/EVS features in HUDs on human performance and explanations of effects using, for example, cognitive task analysis approaches. It is necessary to review some human factors issues in order to address these limitations. First, since the primary objective of advanced flight display technologies (SVS/EVS) is to improve pilot SA, there is a need to review SA definitions and measurement techniques in order to identify a comprehensive definition and measure of pilot SA. Second, since explanation of how specific advanced display features affect pilot performance may be achievable through cognitive task analysis, it is also necessary to be aware or what analyses have already been conducted on pilot use of advanced cockpit display technologies. Beyond this, it is important to identify how cognitive task analysis can be used in the present research.
1.3.1. Pilot situation awareness
advanced cockpit displays. Regarding this issue, many empirical studies have assessed pilot cognitive load in order to compare types of display configurations. However, the main objective of applying non-iconic and conformal features, such as SVS/EVS in HUD design, is to enhance pilot SA and to reduce flight accidents, including CFIT. Unfortunately, there is no commonly accepted definition of SA and specific measurement approaches are either not defined or have serious drawbacks in terms of subject bias in responding or interference in performance. Here, definitions of SA, why SA is critical in flight situations, and how pilot SA can be measured are reviewed in detail.
1.3.1.1. Definition of SA
including air traffic control (Kaber et al., 2006), operation of nuclear power plants (Hogg et al., 1995), automobile driving (Ma & Kaber, 2005), and medical procedures (Gaba et al., 1995). Uhlarik and Comerford (2002) said there are common aspects in such domains. For example: (1) the environment is dynamic and information rich; (2) the human may sometimes experience high mental workload; (3) extensive training is usually required; and (4) time is often constrained. A dynamic system can be defined as a system in which the environment is dynamically changing and in which the operator is responsible for maintaining or achieving particular states or goals in a defined time frame. The concept of SA originated from the piloting environment and it has been proven to be a critical factor for flight safety. Several case studies and analyses of existing databases have confirmed that a loss of SA is an important precursor to (aviation) performance failures (Durso & Gronlund, 1999).
knowledge and behavior to attain goals as tempered by the conditions and constraints imposed by the task environment. Smith and Hancock regarded consciousness to be that part of an agent’s knowledge-generating behavior that is within the scope of intentional manipulation. Based on these analogies, they viewed SA as generating purposeful behavior directed toward achieving a goal in a specific task environment. Therefore, they asserted that assessing SA should consider the agent-environment relationship and depend on experience in the environment and development of alternative action plans.
Competing with the process-oriented theory, Endsley (1988, 1995a) proposed a state-oriented definition of SA (Breton and Rousseau, 2001). Endsley said “Situation awareness is the perception of elements in the environment within a volume of time and space, the comprehension of their meaning, and the projection of their status in the near future.” Endsley further claimed that SA is a state of knowledge that needs to be distinguished from the processes used to achieve that state, which is opposite to the view of Smith and Hancock (1995) and Sarter and Woods (1995). In this regard, Endsley also said the process-oriented theory of SA should be referred to as “situation assessment.” This distinction between a “Process” and “State” definition of SA is of considerable importance and it has been influential in the development of measures and modeling efforts (Rousseau et al., 2004). As process-oriented theory was associated with the operator-focused approach, the state-oriented definition of SA can be associated with a situation-focused approach and characterized as driven by the properties of the situation. The situation-focused approach views SA as determined by the environment or situation in which the operator is at work (Rousseau et al., 2004).
flight path (Level 1), based on chart use, and (s)he may recognize the terrain to be hazardous based on comparison of a planned flight level with the terrain height (Level 2). Finally, based on projection of future aircraft states, the pilot can determine whether the flight will crash into the terrain, and (s)he will try to control the aircraft to avoid such an incident (Level 3). Thus, it is speculated that supporting pilot achievement of these three levels of SA through advanced cockpit display concepts, such as SVS and EVS, may improve flight performance and safety.
schema directs exploration, and exploration leads to sampling of the object. Adams et al. explained SA in terms of this perception/action cycle, but unlike Endsley, they suggested that SA should be conceptualized as both a product and a process. This concept is also compatible with the Smith and Hancock’ s (1995) view of SA, because, as stated above, Smith and Hancock defined SA as, “adaptive, externally directed consciousness,” and they utilized the perception/action cycle to conceptualize and define SA (Uhlarik & Comerford, 2002). However, Uhlarik and Commerford also noted that there were criticisms of each framework. Common problems among the two frameworks are that they include psychological constructs that are themselves not well-understood (i.e., attention and STSS in the information processing framework; semantic memory and schemata in the perception/action cycle framework). There is another criticism of the information processing model, specifically the process of achieving SA appears relatively static and finite, while the perception/action cycle model emphasizes the dynamic nature of SA. The perception/action cycle model also has limitations. The approach provides no suggestion as to how the product (i.e., the state of the active schemata) or the process (i.e., the state of the perceptual cycle) of SA can be measured. This criticism of the perception/action cycle model is quite critical to the use of its definition of SA in order to evaluate the affects of display alternatives on pilot performance.
1.3.1.2. Measurement of SA
been introduced. Fracker (1991) and Vidulich (1992) surveyed SA measurement techniques and categorized them as belonging in three major categories, including: (1) explicit measures; (2) implicit measures; and (3) subjective ratings. Explicit metrics probe the contents of subject memory to determine whether mission critical information is appropriately represented. Endsley (1995b) suggested that explicit measurement approaches could be subcategorized into three types: (1) retrospective measures, which assess SA after completing a task; (2) concurrent measures, which are used during the course of a task, such as verbal protocol analysis; and (3) measures utilizing a simulation freeze technique, like SAGAT. While Endsley (1995b) suggested that explicit measures are objective because the collected data can be compared with the true state of the situation, Fracker (1991) considered explicit measures to be subjective because the data are acquired by self-report rather than assessment of observable behavior. One disadvantage of explicit measures is that a normative model of the domain (e.g., aviation), and how operators are expected to behave may be difficult to develop because the task environment is dynamic and complex. Therefore, it is difficult to understand how an explicit measure could be developed outside of a laboratory setting (Uhlarik & Comerford, 2002).
objective, unobtrusive and easy to use (Endsley, 1995b; Fracker, 1991). On the other hand, implicit measures have the disadvantage that performance may not necessarily reflect SA in many task situations (Sarter & Woods, 1995). For example, it is possible that poor performance may be a result of something other than low SA (e.g., lack of task resources) (Uhlarik & Comerford, 2002).
Subjective rating techniques ask the operator to directly assign a value to represent the quality of SA they feel they experienced while performing a task. Rating techniques also include three subcategories (Endsley, 1995b): (1) direct self-rating, such as the 3D (dimension) or 10D SARTs (Taylor, 1989); (2) comparative self-rating (e.g., SA-SWORD); and (3) observable ratings. Advantages of subjective rating techniques are that they are easy to use, inexpensive to implement and practical because they can be used both in simulations and in the actual task environment (Metalis, 1993; Uhlarik & Comerford, 2002). However, disadvantages of subjective rating techniques have been identified to include participant ratings being affected by their performance on a trial and direct self-ratings collected at the end of task being prone to rationalizations and overgeneralizations by participants (Endsley, 1995b).
1.3.1.3. Pilot SA with SVS/EVS display features
are subjective rating techniques. Relatively, few studies have used SAGAT for assessing SA (e.g., Schnell et al., 2004). Although subjective methods provide the advantage of ease of implementation, the use of SART or SA-SWORD to measure pilot SA poses limitations as identified above, including participant bias. Sarter and Woods (1995) criticized self-rating measures such as SART because they ignore the process of achieving SA and only measure SA as a product. Endsley (1995b) also asserted that participant ratings on SA may not only be affected by their performance in a test trial but their perceptions of mental workload as well. Others have said that subjective ratings may actually measure an operator’s confidence regarding SA rather than SA itself (Uhlarik & Comerford, 2002). SA-SWORD shares this shortcoming and it can only be used in contexts where a within-subjects experimental design is used (Uhlarik & Comerford, 2002).
demonstrated that subject accuracy in responding to SAGAT questions was not affected by the amount of time elapsed after a task freeze. Endsley also showed that subsequent task performance was affected by neither the duration nor the frequency of SAGAT freezes.
In research conducted by Snow and Reising (1999) to examine the effect of pathway guidance and synthetic terrain textures in a HUD on SA, they compared and contrasted SA-SWORD, as a subjective measure of SA, with SAGAT, as an objective measure, using experimental data. In their conclusion, they said they could not demonstrate explicit differences between the two measures. However, they did confirm that interruptions of simulations, as part of the SAGAT technique, did not affect pilot performance. This finding was in-line with Endsley’s results. They concluded that the SAGAT was a useful objective SA evaluation.
1.3.1.4. Levels and types of SA
automation mode awareness). Finally, task awareness relates to a pilot’s knowledge of aviation control, navigation, and communication (with a co-pilot or air-traffic controller), and systems management (e.g., managing fuel, cabin pressure, electricity).
could only measure spatial awareness rather than system and task awareness. However, if the pilot could control a flight (simulator) in a dynamic situation, it would be worthwhile to measure all three aspects of pilot SA, according to Wickens (2002), at all three levels of SA defined by Endsley (1995b), by using SAGAT.
1.3.1.5. Summary of pilot SA
Measurement techniques for assessing SA were also reviewed. Among the various techniques, SAGAT has the greatest applicability to the present research. SAGAT allows for direct, objective assessment of SA by making comparisons of operator responses to knowledge questionnaires with the “ground truth” of a domain simulation in a dynamic environment for the three levels of SA (perception, comprehension and projection). Thus, SAGAT has been identified as a useful measure for evaluating pilot SA (Snow & Reising, 1999) and has been used in several studies (Bolton et al., 2007; Schnell et al., 2004). In aviation tasks, three types of pilot SA have been identified, including spatial awareness, system awareness and task awareness (Wickens, 2002). Consequently, in this research, SAGAT was used with queries for evaluating the three levels of SA along with the three types of pilot SA.
1.3.2. Cognitive Task Analysis (CTA)
1.3.2.1. Overview of CTA
CTA is analysis of the knowledge, thought processes, and goal structures of cognitive tasks (Hollnagel, 2003). CTA differs from traditional task analysis by describing the knowledge required for a task and how knowledge is used in decision making, situation recognition, or problem-solving, rather than just procedures (Kireas, 1997a; Wei & Salvendy, 2004).
CTA is appropriate for cognitively complex, or ill structured tasks that occur in dynamic, uncertain, multi-tasking, real-time operational domains (Gordon, 1995; Gordon and Gill, 1997). For this reason, CTA has been applied to various domains and tasks, including weather-related decision making in business aviation piloting (Latorella et al., 2001), SA analysis for air-to-air combat fighters (Endsley, 1993), and commercial jet aircraft piloting during instrument approaches with a HDD SVS (Keller et al., 2003).
cognitive models (e.g., NGOMSL)(Kieras, 1997b) for cognitively demanding tasks. There is currently a wide variety of CTA techniques available for research and human-machine system studies. Among the techniques, the most commonly used involve some form of interview, protocol analysis, scaling method (e.g., multidimensional scaling (MDS)), neural network modeling, computer simulation or error analysis (Redding & Seamset, 1994). O’Hare, Wiggins, Williams and Wong (1998) summarized two categories of such techniques. The first group of techniques focuses on identifying the inherent constraints in the work domain, based on decomposition of the functional structure of the task. O'Hare et al. (1998) also said the advantage of this approach is that it can be used as a basis for developing prototypes of operator interface design in complex systems not yet in operation. The second group is based on an analysis of actual user activity in an already functioning system. This approach is not only used for designing user interfaces but also for developing operator training programs.
Wei and Salvendy (2004) also classified various CTA method into four families based on their formality and analysis mechanisms. The class included:
Family 1 – “Observations and interviews.” Includes observations and unstructured /semi-structured/structured interviews.
Family 2 – “Process tracing.” Includes cognitive walkthroughs, verbal reports, and protocol analyses.
and questionnaires.
Family 4 - “Formal models.” Includes multi-dimensional scaling and use of GOMS (Goal, Operator, Method, and Selection rules) and EPIC (Executive-Process Interactive Control).
1.3.2.2. Previous task analysis efforts relevant to cockpit automation.
Endsley (1993) conducted a CTA to identify the SA requirements of air-to-air fighter pilots. She reviewed three CTA methods including unstructured interviews, goal-directed task analysis, and structured questionnaires. Among the three CTA techniques, she used Goal-directed task analysis (GDTA). The goal of GDTA is to identify the information processing or situation awareness requirements of system users. She said that the outcome of GDTA is a list of critical decisions and information requirements that can be used as a basis for display design, training program development, development of situation awareness assessment measures, and operator selection. Endsley (1993) used an unstructured interview approach aas part of GDTA with experienced pilots for eliciting knowledge an combat maneuvers. Consequently, she determined the specific elements required for SA in air-to-air combat missions.
of three sub-methods including task diagrams, knowledge audits, and extended simulation-based interviews. The results of a CTA demonstrated the role of expertise in business aviation decision-making in flying through weather and how weather information is acquired and assessed for reliability by pilots. The authors also analyzed the results in order to recommend design and training interventions to improve business aviation decision-making.
display affected performance. Therefore, it is necessary to use a CTA method for explaining the effects of SVS and/or EVS HUD configurations on human performance, beyond Keller and Leiden (2002) and Keller et al. (2003) studies.
1.3.2.3. Verbal protocol analysis
In order to elicit the internal information used by an operator in a specific cognitive task, verbal protocol analyses have frequently been used (Koubek et. al., 1994; Zachary et al., 2000). Verbal protocol analyses make it relatively easy to obtain data at a low cost and deliver to process key information from an operator perspective (Wei & Salvendy, 2004). In general, verbal protocol analyses are conducted based on the assumptions that the analyses can be a source of hypotheses on cognitive processes and predictions about non-verbal behaviors; and second, if an operator says something, evidently they have knowledge somewhere in their heads.
1.3.2.4. Summary of CTA approach in aviation applications
2. PROBLEM STATEMENT
2.1. Limitations of Previous Research
Previous studies indicated that non-iconic features, such as SVS/EVS images, in flight deck displays effect flight performance, SA and (or) workload such that safety can be improved. However, few research studies have been conducted on the performance, SA and workload effects of non-iconic, conformal features (SVS and EVS images) in HUDs. Furthermore, pilot preferences as to which displays to use during distinct legs of an approach and/or landing situation have not been evaluated. Moreover, few empirical studies have investigated the effects of the combination of SVS and EVS features in HUDs on pilot performance. Thus, there is a need to examine the individual additive effects of SVS and EVS features in a HUD on pilot performance during various legs of flight (especially in landing situations) by making comparisons to HUDs without such features.
features. While SART and SA-SWORD have been successfully applied in previous studies to show SA improvements when using advanced HUD features, these techniques may reflect participant bias and are not sufficient for explaining the effects of displays on the three levels of SA, defined by Endsley (1995a).
Related to this, it has been suggested that pilot SA has three types including: spatial awareness, system awareness, and task awareness (Wickens, 2002). Bolton et al. (2007) measured three levels of spatial awareness in SVS display use, but their experiment did not involve dynamic continuous controllable flight situations. Therefore, there are no studies presenting measurement of pilot SA at the three levels defined by Endsley (1995a) across the three types identified by Wickens (2002). With this in mind, it would be worthwhile to develop a method to measure pilot SA across all levels and types. SAGAT may be considered as a potential measure to address this need by posing queries to pilots associated with the various levels and types of SA. Moreover, it was expected that the use of SAGAT would allow for illustration of how non-iconic conformal features in a HUD affect pilot SA in a detailed manner.
use of SVS/EVS HUDs to explain the effects of each feature on performance during different legs of flight. Such an analysis could provide a basis for optimizing SVS/EVS HUD design to support pilot cognition. The use of a verbal protocol technique in this research was expected to provide platform for a cognitive explanations of SVS/EVS feature effects on pilot performance, as well as a detailed description of pilot cognitive behaviors with HUDs during simulated flight performance.
2.2. Research Objectives
Given the limitations of prior research and the research needs identified above, this study aimed to address the three following objectives:
First, an experiment was conducted to assess the effects of non-iconic, conformal features (SVS/EVS) on pilot flight performance (e.g., flight path control), workload, SA, and pilot subjective preferences when using advanced HUD displays across different legs of an approach under IMC conditions. The study focused on the individual effects of each raster feature (SVS, EVS, and a combination of SVS/EVS) relative to a baseline HUD symbology condition (without any non-iconic terrain imagery), including pathway tunnel features which have been proven to increase flight path control (Alexander et al., 2003; Bailey et al., 2006, 2007; Prinzel et al., 2004b, 2004c; Wickens et al., 2004).
assess various types of SA in piloting tasks. This elaborate and objective measure of pilot SA was expected to facilitate interpretation of the effects of the advanced HUD features on pilot cognition.
3. METHODS
The methodology to address the research challenges encompassed two distinct efforts. The first was an empirical study and the second involved a cognitive task analysis to explain the experimental results in terms of cognitive behaviors.
3.1. Part I: Experimental Study
task awareness. Lastly, videotapes, observations and verbal protocols of subjects during the experiment were used as a basis for developing a cognitive task analysis for explaining pilot internal/external behaviors.
3.1.1. Equipment and Experiment Environment
In general, conducting an experiment with a real aircraft to examine the effects of certain cockpit display concepts on human performance is quite difficult because of the issues of cost and safety. Consequently, most previous studies have been conducted using various kinds of flight simulators or prototypes in a lab environment, by fitting them to the objectives of the study. Lab settings for simulating aircraft cockpit displays range from low-fidelity, including simple functional capabilities, to high-fidelity presenting more realistic flight situations and controls (Aragon & Hearst, 2005). For example, Bolton et al. (2007) used a relatively low-fidelity simulator in their experiment. They provided subjects with short video files presenting terrain texture images using a workstation and asked subjects to estimate values associated with spatial awareness, without supporting any continuous flight control. In contrast, Bailey et al. (2006, 2007) used a high-fidelity flight simulator for their experiments, specifically the IFD (Integration Flight Deck) simulation facility at NASA Langley Research Center (LaRC), which provides pilots with a full-mission simulator.
environment, Prinzel et al. (2002) confirmed the findings from simulator experiments to be comparable to findings from actual tests with real aircraft. This means a well-designed simulator experiment may be a viable process for determining results relevant to real flight situations.
In the present study, videos of expert pilot performance with an advanced HUD, including non-iconic conformal features (SVS, EVS or a combination of SVS and EVS terrain images), were recorded with the IFD simulator located at NASA LaRC. The videos were later presented to subjects as part of a PC-based lab simulation of aircraft landing in the Ergonomics lab at NC State University. That is, a high-fidelity simulator (IFD) was used to generate the videos of HUD features in flight and a low-fidelity simulator was used to assess the effects of the displays on pilot performance. The reason the videos were captured at NASA is that, the advanced HUDs to be investigated are still under development and can only be implemented in the IFD simulator. The reason for showing the videos as experimental stimuli in a low-fidelity lab simulator was that, access to the IFD simulator at NASA is extremely limited and tremendously costly (approximately $125k for a 24 pilot experiment).
FOV at 26 pixels per degree. The integrated HUD (see Figure 3.1) subtends approximately 32º horizontal by 24º vertical FOV at a typical pilot viewing distance (20”) (Bailey et al, 2006).
Figure 3.1. Integration Flight Deck (IFD) Simulation Facility at NASA Langly (Bailey et al. 2006).
An ex-Air Force (C-130) check pilot, who has some experience with advanced HUDs, operated the IFD simulator according to scenarios defined for an approach and landing at a major international airport (the task scenario is described in the next section), using different HUD configurations in each trial. The HUD configurations included Baseline (without any terrain features from SVS or EVS), SVS, EVS, and the combination of SVS and EVS. All configurations included tunnel features. The display content of the HUD during the trials was recorded continuously. After completing the flight trials, the recorded video files were collected and prepared for the follow-on lab
tests of pilot.
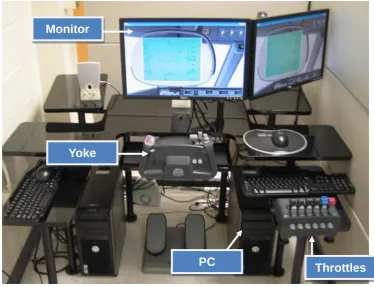
The HUD videos, captured in the IFD simulator, were played-back on the PC-based (see Figure 3.2). The simulator setup consisted of a Dell OptiPlex 755 PC workstation with 4GB of RAM, 256MB of video memory and 2.4 GHz Quad processors, and flight deck controls (a yoke and a throttle quadrant), originally used for a flight simulation game (X-plane). Two 22 inch LCD monitors were also used to present the movie clips to the test pilots and an the experimenter, who manipulated the trial conditions and acted as a first officer (FO) during the flight.
Figure 3.2. Simulator setup for experiment.
Yoke
Throttles PC
A video camcorder was used to videotape subject performance during the last test trial, the think aloud session. These videotapes were used as a basis for the cognitive task analysis and to identify specific performance strategies used by the test pilots. During the experiment, the overhead lights in the lab were covered to prevent glare on the computer screens.
3.1.2. HUD features investigated in study
Since video stimuli were recorded using the IFD simulator at NASA LaRC, the HUD symbology and non-iconic terrain features (SVS, EVS and SVS/EVS) presented in this experiment followed the format developed by NASA. This format has also been used in several prior empirical studies (Kaber et al. 2007a, 2007b, 2008). Since previous research indicated that presenting a pathway tunnel improved pilot performance, especially on flight path control (Alexander et al, 2003; Bailey et al., 2006; Prinzel et al., 2004b; Wickens et al., 2004), it was necessary to examine the pure effects of the SVS, EVS and the combination of features when all display conditions included pathway tunnel images.
Figure 3.3. Baseline HUD symbologies
Figure 3.4. Flight path marker group.
The SVS-HUD configuration presents terrain features using a wireframe grid. The use of the wireframe feature is based on findings from Snow and Reising’s study (1999), which revealed the grid model to be most appropriate for depicting terrain in a HUD. The wireframe features in the HUD in the present study were set to represent terrain using a 500 meter line separation with a 1 pixel line width. Figure 3.6 shows a captured SVS HUD image.
The EVS-HUD presents an actual out-of-cockpit view using a sensor-based forward looking Infrared camera. Figure 3.7 shows the EVS-HUD and Figure 3.8 shows the combination of SVS and EVS (Combo) features in the HUD, recorded using the IFD simulator.
Figure 3.8. HUD with combination of SVS and EVS features.
3.1.3. Flight scenario