DOI: 10.1534/genetics.109.107474
Detection, Validation, and Downstream Analysis of Allelic Variation
in Gene Expression
Daniel C. Ciobanu,*
,†,1Lu Lu,* Khyobeni Mozhui,* Xusheng Wang,* Manjunatha Jagalur,
‡John A. Morris,
§William L. Taylor,** Klaus Dietz,
††Perikles Simon
‡‡and Robert W. Williams*
*Department of Anatomy and Neurobiology, University of Tennessee Health Science Center, Memphis, Tennessee 38163,†Department of Animal Science, University of Nebraska, Lincoln, Nebraska 68583,‡Department of Computer Science, University of Massachusetts, Amherst,
Massachusetts 01003,§Allen Institute for Brain Science, Seattle, Washington 98103,**Molecular Resource Center, University of Tennessee Health Science Center, Memphis, Tennessee 38163,††Department of Medical Biometry, University of Tuebingen,
72070 Tuebingen, Germany and‡‡Department of Sports Medicine, Rehabilitation and Disease Prevention, Johannes Gutenberg–University Mainz, 55099 Mainz, Germany
Manuscript received July 16, 2009 Accepted for publication October 24, 2009
ABSTRACT
Common sequence variants within a gene often generate important differences in expression of corresponding mRNAs. This high level of local (allelic) control—orcismodulation—rivals that produced by gene targeting, but expression is titrated finely over a range of levels. We are interested in exploiting this allelic variation to study gene function and downstream consequences of differences in expression dosage. We have used several bioinformatics and molecular approaches to estimate error rates in the discovery ofcismodulation and to analyze some of the biological and technical confounds that contribute to the variation in gene expression profiling. Our analysis of SNPs and alternative transcripts, combined with eQTL maps and selective gene resequencing, revealed that between 17 and 25% of apparent cis
modulation is caused by SNPs that overlap probes rather than by genuine quantitative differences in mRNA levels. This estimate climbs to 40–50% when qualitative differences between isoform variants are included. We have developed an analytical approach to filter differences in expression and improve the yield of genuinecis-modulated transcripts to80%. This improvement is important because the resulting variation can be successfully used to study downstream consequences of altered expression on higher-order phenotypes. Using a systems genetics approach we show that two validatedcis-modulated genes,
Stk25andRasd2, are likely to control expression of downstream targets and affect disease susceptibility.
V
ARIATION in gene expression contributes tophenotypic diversity and has an impact on disease susceptibility. Early biochemical studies revealed
heri-table variation in levels of b-glucuronidase between
strains of mice and their intercross progeny (Morrow
et al.1949; Lawet al.1952). The first linkage study of this type demonstrated that esterase activity in maize was modulated by a locus tightly linked to the esterase
gene itself (Schwartz 1962). Three decades later,
Damerval et al. (1994) made a breakthrough by ap-plying proteomic methods to the same fundamental problem. They quantified expression differences of 72 proteins in an F2intercross and simultaneously mapped
40 quantitative trait loci (QTL) that modulated the expression of different isoforms. The advent of high-throughput microarray technology made it practical to
apply sophisticated QTL mapping methods to simulta-neously map expression quantitative trait loci (eQTL) that potentially control the expression of thousands of transcripts in yeast, plant, and animal populations (Cavalieri et al. 2000; Karp et al. 2000; Brem et al. 2002; Schadtet al.2003; Monkset al.2004; Morleyet al. 2004; Chesleret al. 2005; Hubneret al. 2005; Dixon et al.2007; Goringet al.2007; Strangeret al.2007).
Genetic variation in expression is produced by mech-anisms that act either incisor intrans. Ciseffects refer to local polymorphisms or alleles that influence the synthesis or stability of a gene’s own message. When this type of variation is mapped, the regulatory locus coincides with the position of the source gene. Previous studies of gene expression have shown that a great majority of transcripts that have highly significant QTL are potentiallycis-modulated (e.g., Chesleret al.2005; Peirce et al. 2006). Surprisingly, in our own work we found that there was more than a twofold excess of cis-modulated transcripts in which the allele associated with high expression was inherited from strain C57BL/ 6J—the strain used for almost all genome sequencing,
Supporting information is available online athttp://www.genetics.org/ cgi/content/full/genetics.109.107474/DC1.
1Corresponding author:Department of Animal Science, University of
Nebraska, P.O. Box 830908, Lincoln, NE 68583-0908. E-mail: [email protected]
EST discovery, and array design. In contrast, we did not detect any significant allelic imbalance for QTL
associ-ated with trans effects. This imbalance highlighted a
systematic bias in the detection of a problematic subclass of cis-modulated transcripts associated with sequence differences that affect probe–target hybridization.
In this study we have applied several systematic approaches to estimate error rates in the discovery of
cis-modulated transcripts and to explore some of the
biological and technical confounds that contribute to expression variation. While this study is by no means the first to point out the potential difficulty of sorting out sources of variation in array hybridization (Schadtet al. 2003; Albertset al. 2005, 2007, 2008; Dosset al. 2005; Chenet al. 2009), we have extended previous work in three ways. First, we provide a comparatively quantita-tive assessment of the severity of the problem for two of the preeminent array platforms (Affymetrix and Illumina) by exploiting several large expression data sets and allele-specific expression protocols. Second, we have found that variation in 39-UTR structure generates serious technical confounds even in the absence of sequence differences that overlap probe sequences. Third, we introduce a relatively simple protocol that can significantly increase the detection of true cis -expression differences. Our analysis is motivated by two factors. First, once cis-modulated transcripts have been validated, they become molecular resources to study downstream consequences of altered gene ex-pression. Second, these variants are particularly amena-ble to detailed molecular analysis and their dissection will lead to a more complete understanding of the allelic modulation of gene expression.
MATERIALS AND METHODS
Microarray expression profiling: Measurement of mRNA expression relied on multiple brain tissues collected from strains C57BL/6J (B6) and DBA/2J (D2), their reciprocal F1 hybrids (B6D2F1and D2B6F1), and BXD recombinant inbred (RI) strains. We used data sets consisting of 39 BXD strains for the whole brain (Peirceet al. 2006), 67 for the hippocampus
(Overall et al. 2009), and 54 for the striatum (Rosenet al.
2009). These studies exploited the most widely used mouse arrays: the Affymetrix Mouse Genome 430A–430B array pair to profile the whole brain, the Affymetrix Mouse Genome 430 2.0 array to profile the hippocampus, and the Illumina MouseWG-6 v1.1 array to profile the striatum. Affymetrix microarray data used in this study were normalized using the position-dependent nearest neighbor (PDNN) method (Zhanget al.
2004) but data normalized using robust multiarray average (RMA) and microarray analysis system 5 (MAS 5) procedures give similar results. We have also used an unpublished but open data set from the hippocampus of 72 BXD strains, the 2 parental strains, and F1hybrids profiled using the Affymetrix Mouse Exon 1.0 ST array (seewww.genenetwork.org/dbdoc/ UMUTAffyExon_0209_RMA.html). Illumina microarray data were normalized using the vendor’s rank invariant method. Additional information about the BXD panel, experimen-tal procedures, and data sets used can be obtained from GeneNetwork information pages (www.genenetwork.org).
Genotyping and QTL mapping:We used 3785 informative SNPs and microsatellite markers to map expression traits in the BXD strain panel. QTL mapping was performed using QTL Reaper as described (Peirceet al.2006). The location of
the probes was identified using the February 2006 assembly and the University of California, Santa Cruz (UCSC) genome browser (http://genome.ucsc.edu).
SNPs data set: We used SNPs extracted from the SNPs data-base and variant browser of GeneNetwork (www.genenetwork. org/webqtl/snpBrowser.py) to analyze the impact of SNPs on expression level. This database incorporates the majority of previously known Celera and Perlegen SNPs available in NCBI Entrez dbSNP. The number of informative SNPs between B6 and D2 used in our screening was1.8 million, although we have recently added an additional set of.1 million SNPs from an ongoing sequencing project.
Isoform mRNA detection:Our analysis is based on several sources of data: mouse genome assembly and EST sequences were downloaded from UCSC (ftp://hgdownload.cse.ucsc. edu/goldenPath/mm8/), and mouse full-length cDNAs were obtained from NCBI (www.ncbi.nlm.nih.org) and RIKEN databases (http://genome.gsc.riken.go.jp). We used the fol-lowing steps to identify mRNA isoforms: (1) we aligned the ESTs and cDNA sequences to the mouse genome sequence using BLAT (Kent 2002), (2) we extracted the genome
sequences that matched each EST/cDNA sequence and up to 5 kb of the flanking sequence, (3) we aligned the EST/cDNA sequences with the highest BLAT scores to the genome sequence using SIM4 software (Floreaet al. 1998) to
infer exon/intron boundaries, and (4) we compared the predicted gene structures for each EST/cDNA and identified potential mRNA isoforms.
Allelic specific expression analysis: We carried out allelic specific expression (ASE) analysis in reciprocal F1individuals (C57BL/6J3DBA/2J) by combining RT–PCR with SNaPshot (Applied Biosystems, Foster City, CA). PCR primers were designed in the same exon flanking the informative SNPs using Primer 3 (supporting information, Table S1) (Rozen
and Skaletsky2000). We selected the most appropriate side
of the SNPs to design SNaPshot extension primers. Hippo-campal tissue was collected from F1mice averaging 60 days old as in the previous microarray experiments (Chesler et al.
2005; Peirceet al.2006). RNA was isolated from pools of two to
four hippocampi using RNA-STAT 60 (Tel-Test) and quanti-fied by a NanoDrop ND-1000 spectrophotometer. We set up four RNA pools, one per each sex and reciprocal cross. The number of individuals in each RNA pool varied from four to eight. We isolated individual DNA from the spleen of four different heterozygote individuals using a standard phenol-chloroform procedure. These DNA samples were used as controls and tested at the same time with the RNA pools. We treated the RNA with Turbo DNase (Ambion) to degrade any traces of genomic DNA. The absence of genomic DNA contamination was confirmed by PCR across small introns.
genomic DNA. We estimated fold difference in expression as the ratio of allelic fold difference in cDNA to the genomic DNA.
qRT-PCR analysis:Dorsal striatum was dissected from four C57BL/6J and DBA/2J mice and total RNA was extracted using RNA-STAT 60. We treated the RNA pools with Turbo DNase. cDNA synthesis was performed on equal amounts of total RNA, using the First-Strand cDNA Synthesis kit and theNotI-d(T)18 primer (GE Healthcare). We selected the qRT-PCR assays using the Universal Probe Library (www.universalprobelibrary.com, Roche Diagnostics) (Table S2). Two assays were designed for each candidate transcript: one that targets the putative alter-native region and one that targets an exon common in both transcripts. Most of the assays designed in the nonpolymorphic exons span an intron while assays targeting alternative regions were designed close to the location of the microarray probe that captured aciseffect. We used cyclophilin D as a reference gene for comparative threshold quantification. This gene is not differentially expressed between strains. qRT-PCR was per-formed using the LightCycler 480 System (Roche Diagnostics) according to the standard protocol for the LC480 Probes Master. Standard curves for five 10-fold dilutions between 2500 and 0.25 ng of reverse-transcribed RNA samples were run for all assays to determine PCR efficiency under experi-mental conditions for reference and selected genes. The mean crossing thresholds (CT) for the technical duplicates of different amplicons were used to calculate mean normalized expression (MNE) values that reflect the relative expression of the target gene compared to the reference gene by taking the efficiencies of the PCR into account (Simon2003). MNE values
for C57BL/6J and DBA/2J were log10transformed and com-pared byt-tests. Mean fold difference values were calculated using the expression of C57BL/6J as a reference.
RESULTS AND DISCUSSION
SNPs overlapping probes affect the rate of discovery
of cis QTL:Recent linkage studies of gene expression
have used commercial short oligomer probes to measure steady-state gene expression levels in a wide variety of tissues and species. The Affymetrix platform is based on sets of 25-mer probes (typically 11 probes per probe set), whereas the Illumina platforms exploit longer 50-mer probes. We used both platforms and systematically mapped cis- and trans-acting loci in multiple tissues of the BXD strains. Acis-acting locus is defined here as a QTL with a likelihood-ratio statistic (LRS).15 (LOD. 3.26) and located within 3 Mb of the source gene. We detected a total of 3431 Affymetrix probe sets
correspond-ing to 2640 potentially cis-modulated genes and 2944
Illumina probes corresponding to 2587 potentially cis -modulated genes in two large CNS expression data sets.
The size and direction of additive effects for thesecis -acting QTL were imbalanced in both tissues and using
both array platforms. Approximately 65% of cis QTL
were associated with higher expression of the C57BL/6J allele (B) relative to the DBA/2J allele (D). This is close to a 2:1 imbalance in favor ofBalleles. If QTL are ranked on the basis of a LRS, the imbalance is even more
pronounced among the top 10% ofcisQTL: a 3:1 ratio
among Affymetrix probe sets and a 6.7:1 ratio among Illumina probes. In contrast, the imbalance is modest
among the bottom 10% of cis QTL: 1.3:1 for both
Affymetrix and Illumina platforms. In marked contrast, trans-modulated transcripts, which by definition are controlled by distant sequence variants, are almost perfectly balanced (1:1) on both platforms with respect to effect size and polarity.
It would be important to know how many of thesecis -acting candidate QTL are genuine and how many are caused by qualitative differences between isoforms. As has been established for several years, SNP position and the number of SNPs overlapping the microarray probes have a significant impact on the discovery rate and the size of apparent expression differences forcis- (Schadt et al. 2003; Albertset al., 2005, 2007; Dosset al. 2005; Chen et al. 2009) and trans-modulated transcripts (Chenet al. 2009). Our analysis found that the longer Illumina 50-mers have approximately the same sensitiv-ity to sequence differences as the shorter Affymetrix 25-mer probes (Figure S1andFigure S2). In both cases, SNPs that overlap at the 59and 39 ends of the probes perturb measurements only slightly, whereas those that overlap more central positions have a strong effect (AffymetrixP,0.00002; IlluminaP,0.02). As expec-ted, the average size ofciseffects increases as a function
of the number of SNPs (P, 0.0001). In contrast, the
effect size oftransQTL is not influenced at all by SNPs that overlap probes.
We removed from our analysis all of the probes that overlap known SNPs but the bias in favor ofBalleles was
still present among cis-acting QTL. For example,
re-moving all Illumina probes that overlap known SNPs reduced the bias from 65 to 57%. This represents a drop in the number ofcisQTL by 17%. The residual imbalance could be readily explained by unknown polymorphisms that overlap probes or by isoform variation.
Alternative splicing, initiation, and termination of transcription—qualitative changes affecting gene ex-pression measurements:Differences in alternative splic-ing, initiation, and termination of transcription have an important contribution to variation in gene expression.
Recently Kwanet al.(2008) employed exon arrays and
showed that 55% of expression differences in a HapMap population are due to isoform variations caused by alternative splicing, initiation, and termination of tran-scription. Expression analysis by multiple probes that profile the same transcript provides a comprehensive picture of the complexity of variation. Expression of 37% of genes profiled in striatum by the Illumina array
(9200 of 25,000 genes) is measured by two or more
probes. Expression of 1100 genes is characterized by a
moderately strongciseffect (LRS.15) and measured
by multiple probes that are not affected by known SNP variants. This enabled us to assess the consistency with
which a cis effect was detected by multiple probes.
Twenty-two percent of these 1100 genes with companion
probes had discordant cisQTL effects—strong cisQTL
detected by one or more probes and insignificant cis
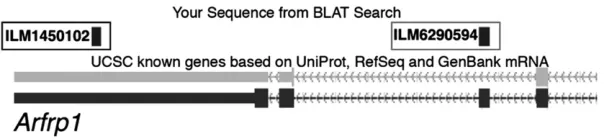
due to unknown SNPs overlapping probes or due to isoform variation. One example of the latter effect is an apparent difference in expression of ADP-ribosylation factor related protein 1 (Arfrp1) that is detected by a probe that targets an alternatively spliced exon but not by a probe that targets an exon common in all isoforms (Figure 1).
The question at this point is what fraction of observed ciseffects is caused by unknown SNPs affecting hybrid-ization or due to isoform variants? To address this we resequenced a random set of 16 genes with discordant probe pairs. We identified new SNPs overlapping probes in only 5 of the genes (31%). In the rest of the genes from this group we identified high levels ofcisvariation specific to 39-UTRs. Two independent quantitative real-time RT–PCR (qRT-PCR ) assays confirmed strain-specific differences strain-specific to 39-UTRs for 5 of the 11 tested genes (Table S3). For the remaining 6 genes the differences were either not specific to the 39-UTR or undetectable by qRT-PCR. For example, analysis of array data uncovered aciseffect specific to a probe that targets the distal end of the longest 39-UTR variant ofSt6galnac4 (Figure 2). In contrast, there is nociseffect for probes that target other exons. There are at least three putative poly(A) sites inSt6galnac4that could generate variation
in 39-UTR length (http://polya.umdnj.edu/polyadb)
(Leeet al.2007).
Exon microarrays provide a more high-throughput alternative to resolve the confound between quantitative and qualitative differences in mRNA expression. We profiled the hippocampus of the BXD panel using the Affymetrix Mouse Exon 1.0 ST array to map loci re-sponsible for quantitative and qualitative variation in expression. In genes that are profiled by at least six probe sets that target multiple exons, we found consistent
evidence (.50%) of cis and trans modulation in 282
and 271 genes, respectively (UMUTAAffy Hippocampus Exon Feb09 RMA). In contrast, we detected significant differences in the putative regulation of gene expression that was measured across different exons in many of the genes. For example, aciseffect for solute carrier family
35, member E1 (Slc35e1) was uncovered only by probe
sets that target the distal region of the 39-UTR and not by the rest of the probes. These data provide additional evidence of increased transcriptome diversity in BXD.
As considered above, variation in transcription termi-nation and alternative splicing can give rise to discrete quantitative differences in the steady-state mRNA level of different isoforms between strains. When these mRNA isoform variants (e.g., long or short 39-UTRs) map as local QTL, we can be sure that the effect is due to a local DNA sequence variant that will not necessarily overlap probes but may nonetheless pro-duce quantitative variation among isoforms. These Figure 1.—Variation in alternative splicing
and the expression difference ofArfrp1 in stria-tum (UTHSC Illumina 6.1: November07 data set). Variation in expression was detected only by a probe that targets the alternatively spliced exon (ILM6290594) but not by a probe that tar-gets the 39-UTR (ILM1450102). This discrepancy is probably a result of variation in the abundance of an alternatively spliced isoform among BXD strains.
Figure 2.—The effect of alternative 39-UTR
combined qualitative and quantitative differences are interesting to study and can affect phenotypes in multiple ways—by altering message stability, translation efficiency, protein sequence, and function. For exam-ple, a 39-UTR long-form variant in them-opioid receptor in CXB RI strains causes a low response to morphine agonists and higher pain sensitivity (Ikedaet al.2001; Hanet al.2006).
Systematic identification of genuine cis-modulated transcripts: We developed an efficient analytical ap-proach that combines bioinformatics and molecular methods to filter out artifactual expression differences. In general, a robust expression-profiling platform will uncover a large number ofcis-regulated candidates in a segregating population. Initially, a large fraction of
apparent cis QTL are excluded on the basis of
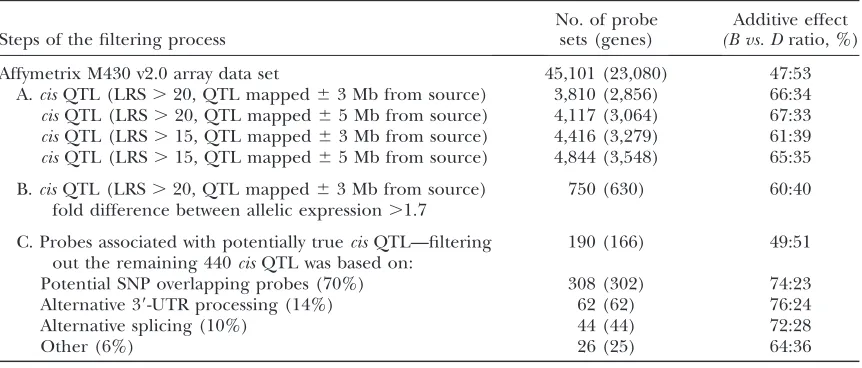
sig-nificance of the linkage, position, and fold difference in expression. All these steps are common to most expression genetics analyses. In one of the CNS data sets (Hippocampus Consortium M430v2 June06), we
identified 3810 cis-acting QTL candidates (LRS . 20)
closely mapped to the source gene (63 Mb) (Table 1,
step A). The size and direction of additive effects
were imbalanced with 66% of cis QTL associated
with higher expression of the B alleles relative to the Dalleles. A more relaxed stringency of effect size (LRS.
15) or distance between QTL and the source gene (65
Mb) did not correct the imbalance in favor ofBalleles (61%:39% to 67%:33%). If we apply the highest strin-gencies (LRS.20,63 Mb from source), 750 of 3810cis QTL have robust differences in gene expression (fold
difference.1.68). These 750 candidatecisQTL
modu-late the expression of 630 genes. The imbalance in this reduced set of candidates favored theBover theDalleles (60%:40%) (Table 1, step B).
We analyzed each of these transcripts at the level of probes and probe sets to evaluate likely sources of
expression differences (Table 1, step C). We were interested in identifying expression variation that is solely quantitative and not a result of sequence differ-ences overlapping probes or due to alternative splicing, initiation, and termination of transcription. First, we identified probes overlapping known SNPs by compar-ing flankcompar-ing positions of probes with positions of all informative SNPs. We included this information and flagged problematic probes, using the GeneNetwork ‘‘probe tool’’ page created for each probe set. This procedure is frequently used by most expression genet-ics studies (Strangeret al. 2007). Other studies simply assess the impact of SNPs on the rate of discovery ofcis -modulated transcripts by sequencing the complemen-tary area of probes associated with the highest effects (Drukaet al. 2008).
We are aware that a large number of sequence variants have not been yet identified (especially indels) and some of these can overlap probes. We used QTL Reaper and a more refined linkage analysis of individual probe data—the single 25-mers as opposed to the full probe set—and examined the consistency of linkage across individual probes and those generated by the Affyme-trix full probe set. Alberts et al. (2007) developed a different approach of identifying problematic probes by decomposing the signal provided by the probe set and analyzing the deviation of the individual probes from the entire set. A computational protocol that flags probes that may overlap SNPs is freely available in R (Alberts et al. 2008). The end result of both ap-proaches is similar and neither of the methods requires a prioriinformation on SNP location. Our approach and resequencing data revealed many examples of artifac-tual expression variation due to overlaps between probes and sequence variants.
We assumed that a large fraction of expression differences are due to isoform variation as a result of
TABLE 1
Filtering process of thecisQTL candidates in the hippocampus of BXD
Steps of the filtering process
No. of probe sets (genes)
Additive effect
(B vs. Dratio, %)
Affymetrix M430 v2.0 array data set 45,101 (23,080) 47:53
A.cisQTL (LRS.20, QTL mapped63 Mb from source) 3,810 (2,856) 66:34
cisQTL (LRS.20, QTL mapped65 Mb from source) 4,117 (3,064) 67:33
cisQTL (LRS.15, QTL mapped63 Mb from source) 4,416 (3,279) 61:39
cisQTL (LRS.15, QTL mapped65 Mb from source) 4,844 (3,548) 65:35
B.cisQTL (LRS.20, QTL mapped63 Mb from source) fold difference between allelic expression.1.7
750 (630) 60:40
C. Probes associated with potentially truecisQTL—filtering out the remaining 440cisQTL was based on:
190 (166) 49:51
Potential SNP overlapping probes (70%) 308 (302) 74:23
Alternative 39-UTR processing (14%) 62 (62) 76:24
Alternative splicing (10%) 44 (44) 72:28
events such as alternative splicing, initiation, or termi-nation of the transcription. We used EST/cDNA se-quences from various sources, identified their position in the mouse genome, and compared the predicted gene structures at each locus for detection of possible isoform variants. We determined that a considerable fraction of the probe sets target areas that are polymorphic between isoforms, which vary between strains, especially at the distal end of the 39-UTR. In CNS tissues this can become an important confound, because genes tend to express longer transcripts and 39-UTRs (Zhanget al. 2005) and exhibit higher levels of alternative splicing than other tissues (Yeoet al. 2004).
Following all these bioinformatics analyses we pre-dicted that the expression differences of 190 of the 750 candidates (25%) are solely quantitative and a result of cismodulation. Probes that target these transcripts will mapcisirrespective of their location relative to different regions of the transcript. In this group of 190 candidates we were able to regain close to a 1:1 balance betweenB andDalleles (B vs. D, 49.2–50.8%, Table 1). In contrast,
we predicted that the remaining 440 potentially cis
-modulated transcripts are mainly a result of SNPs or other sequence variation (known and unknown) that
overlap probes (70%), 39-UTR processing, (14%) and
alternative splicing (10%). The imbalance in the di-rection of the additive effect is significantly higher in favor ofB alleles in all of these categories that affect
expression measurements. We excluded all cis QTL
candidates on the basis of probes that overlap known SNPs or probes with inconsistent linkage across the set due to potential unknown sequence variants. We fil-tered out the probes that detect combined qualitative and quantitative differences between isoforms in a distinct group and used them separately in validation studies and downstream analyses.
A large number of genuine cis-regulated transcripts were probably excluded by our filtration process due to overly stringent criteria. For example, the number of candidatecis-modulated transcripts could be increased
to 5000 by simply selecting all transcripts with a localcis
LRS.10 or by extending the allowed distance between
the source gene and the QTL. While this procedure will boost the final number of candidates, it will also increase the false discovery rate (FDR). The FDR at other stages of our filtration process could be de-termined empirically by measuring allelic expression or by similar procedures using sets of randomly selected transcripts from each step.
Validation ofcisvariation by ASE:The ASE approach provides a relatively unambiguous measure of expression variation generated bycis-acting factors (Dosset al.2005). From the short list of 190 putative cis-acting QTL de-scribed above we selected 43 candidates for ASE analysis (Figure 3 andTable S4). These candidates vary in their effect and significance and cover most chromosomes (Figure 3). They also provide sufficient statistical power to predict the true distribution of the 190ciscandidates. ASE of at least 40 candidate QTL is required to predict with sufficient accuracy the true distribution of the entire set of 190cisQTL (95% confidence interval$j0.15j).
We used reciprocal C57BL/6J3 DBA/2J F1hybrids
and SNPs in which the expression of both alleles can be quantified simultaneously in single samples. If the variation in expression of a particular transcript is a
result of genuine cismodulation, the expression of B
andDalleles will be significantly different in F1hybrids.
If the variation in expression across BXD strains is a result of trans modulation or is simply an artifact, no difference in allelic expression will be observed in hybrids. While thetranseffects remain in F1individuals,
the difference in allelic expression will not be detected since both allelictransfactors (BandD) are part of the same cell and have equal access to their downstream targets. We intentionally selected SNPs that are shared by most or all mRNA isoforms, to capture quantitative differences in expression rather than structural differ-ences among isoforms.
Fold difference in expression and the significance of cismodulation vary considerably among transcripts. We Figure 3.—Chromosomal distribution and
confirmed that 33 (77%) of 43 genes are genuinelycis modulated atP,0.05 and that 81% arecismodulated at
P , 0.1. If we apply the properties of the binomial
distribution, the 95% confidence interval of the valida-tion rate in the entire set of 190 genes will be between 66 and 88%. We performed a statistical evaluation of the LRS score effect on true positive prediction ofcisQTL. While at first glance a LRS threshold of at least 60 seems
to improve the number of genuinecisQTL (Figure 3),
we did not identify any significant statistical relationship between LRS and the validation results. Directions of allelic effects agreed in all cases with our array data. Furthermore, the percentage of validation was inde-pendent of the polarity of the effect (77% forBand 76% forDalleles).
We estimated the fraction of genuinecis-modulated
transcripts by applying our ASE validation rate with the assumption that the bias in favor of B-allele effects is generated entirely by sequence variants that affect probe signal. In the original set of 750cis-acting QTL the imbalance favoredBoverDQTL by a ratio of3/2. This imbalance indicates that one-third ofB-positivecis effects are false, assuming that allD-positive ciseffects are true. After we apply the ASE validation rate, the estimated fraction of true cis-modulated transcripts is
51% forB-positive and77% forD-positive alleles. Sequence variation and the universal biases in genetic expression studies: It is important to note that even in the absence of an explicit imbalance in allelic effects seen in the BXD panel, the same problems and challenges apply with equal force in other population resources. For example, in the LXS panel there is a perfect balance betweencisQTL with high levels ofL vs. high levels of S alleles since both L andS haplotypes share roughly the same fraction of theBhaplotype used to design microarrays. However, in this cross, there is a similar fraction of artifactual expression variation, but the source is shared equally by both parental strains. After taking into account the sample size, parental strain genetic differences, and the choice of microarray platform, we estimate that in the hippocampus data
set of 3810 candidate cisQTL there are at least 1000
genuine QTL responsible for a fold difference in
expression.50% (Hippocampus Consortium M430v2
June06).
Downstream analysis ofcis-modulated variation:The possibility of quantifying gene expression in segregating populations provides an opportunity to infer relation-ships between genes and their transcripts. Another objective of this study is to show the potential of system genetics to identify downstream targets of cis modula-tion and the impact on higher-order phenotypes.
Some of the cis-modulated transcripts validated by
ASE have roles in CNS development and neurotrans-mission and are potential candidates for behavioral traits and neurological diseases. It would be interesting to know if any of these expression differences are large
enough to lead to quantitative differences at the protein level that could ultimately trigger variation in behavior and disease susceptibility. For example, serine
threo-nine kinase 25 (Stk25) is known to be involved in a
pathway that leads to cerebral cavernous malformation
(CCM) in humans (Vosset al. 2007). Human STK25
interacts directly with the products of two genes
associated with CCM: CCM2 and CCM3 (Voss et al.
2007). In agreement with these results we detected moderate to high correlations between expression of Stk25 and expression of three mouse orthologs of the
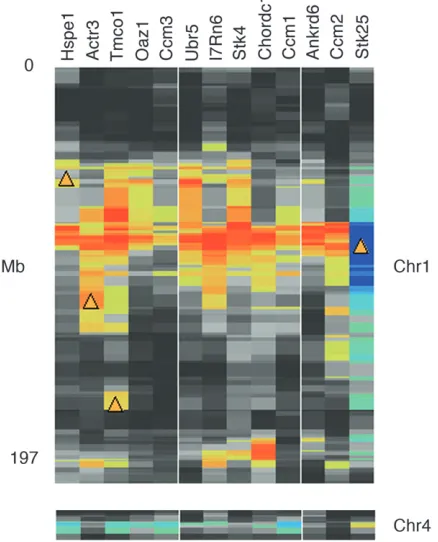
CCMgenes (Table 2). We uncovered a locus responsible
for the variation in the expression of all three tran-scripts—Krit1(Ccm1), Ccm2, and Pdcd10 (Ccm3)—that maps to chromosome (Chr) 1 between 90 and 100 Mb, the precise location ofStk25, strongly implicatingStk25 as the source of expression difference (Figure 4). We then used a global method to generate a list of other downstream targets ofStk25(Table S5). All of the targets presented in Table 2 have a correlation withStk25of at least 0.45 in one of the CNS tissues and at least 0.25 in three or more tissues. These potential targets have
moderate to strong QTL that overlap Stk25. Finally,
all targets have strong correlations with Stk25 purely on the basis of an analysis of their shared literature (Homayouniet al. 2005). For example,Stk25is related by expression, by QTL, and by literature withStk4.
Over the years the BXD panel has been extensively phenotyped for many pharmacological, anatomical, and behavioral traits, and these data are available in GeneNetwork. We explored if variation in expression of Stk25 correlates with any of these traits. SinceStk25 is linked to brain vascularization, it is noteworthy that the
top correlates of Stk25 are all neural and behavioral
traits. The expression ofStk25is highly correlated with the initial sensitivity to ethanol-induced ataxia (r¼0.70,
P ,0.001; GeneNetwork trait ID, 10144) and
cerebel-lum vocerebel-lume (r¼ 0.48,P,0.05; trait ID, 10004) and moderately correlated with many traits associated with motor activity in an open field such as vertical activity
(r ¼ 0.48, P , 0.0001; trait ID, 11863) or distance
traveled in a novel environment (r¼0.36,P,0.01; trait ID, 11602).
RASD family, member 2 (Rasd2) is another cis
-modulated gene that exhibits a significant difference
in expression in the BXD panel.Rasd2is a member of
the Ras GTPase family of proteins that controls pathways involved in synaptic plasticity, learning, and memory (Spanoet al. 2004).Rasd2is predominantly expressed in striatum but also in other areas of the brain such as hippocampus. We detected a moderate correlation
between the expression of Rasd2 and the adhesion
molecule with the Ig-like domain 2 gene (Amigo2,r¼
0.41) in hippocampus. Amigo2is located on Chr 15 at
expression ofAmigo2 in hippocampus. The confidence limits of the QTL extend from 78 to 79.2 Mb and include only three genes:Rasd2,Mcm5, and1700007B14Rik. We examined expression patterns of these genes andAmigo2
using in situ data available from Allen Brain Atlas
(www.brain-map.org). Mcm5 and 1700007B14Rik have low expression in the brain and are less interesting candidates for theAmigo2 transQTL. In contrast, variants in Rasd2 could clearly influence Amigo2 expression. Rasd2exhibits regional expression in the hippocampus, high in both CA1 and CA3, but little to none in CA2. Amigo2shows complementary regional differences with high expression in CA2, but almost none in CA1 or CA3,
supporting a repressive influence of Rasd2 on Amigo2
expression (Figure 5).
To test the hypothesis thatRasd2 expression
consis-tently represses expression of Amigo2 we analyzed 10
other CNS regions in which Rasd2 is expressed. A
complementary pattern of high expression of Rasd2
and low to absent expression ofAmigo2was found in 8 of the 10 areas: the pyramidal cell layer of fields CA1 and CA3 of the hippocampus, the dorsal striatum, the mitral layer and periglomerular cells of the main olfactory bulb, the olfactory tubercle, the substantia nigra pars compacta, the entorhinal cortex, and the reticular nucleus of the thalamus. We did not detect the same pattern for the hilus of the hippocampus or for the paraventricular nucleus of the thalamus. The presence
of the Amigo2 trans QTL on Chr 8 and the relatively
consistent complementary expression pattern and cor-relation provide cumulatively strong support for the hypothesis thatRasd2is an inhibitor ofAmigo2.
Rasd2is known to be regulated by thyroid hormones (Erricoet al. 2008) and interestingly we found the ex-pression of its potential downstream target—Amigo2—to be highly correlated with total serum thyroxine (r¼0.87, P,0.005; trait ID, 10602). The expression ofAmigo2was shown to promote the survival of cerebellar granule neurons and was considered a candidate for familial Alzheimer’s disease type 5 (Ono et al. 2003). We found the expression ofAmigo2to be highly correlated with the
granule cell number in hippocampus (r ¼ 0.76,P ,
TABLE 2
Expression and literature correlations between transcripts withtransQTL located on Chr 1 (90 and 100 Mb) andStk25
Symbol Probe set ID Gene ID
Correlation withStk25, probe 1416770_at (P-value)
Literature correlation withStk25
QTL Chr 1 LRS
Stk25 1416770_at 59041 1.00 (0) 1.00 96.2
Actr3 1452051_at 74117 0.54 (0.00014) 0.42 11.9
Ankrd6 1437217_at 140577 0.57 (3.64e-05) 0.44 15.1
Ccm1 1448701_a_at 79264 0.48 (1.01e-0.3)S 0.55 9.2
Ccm2 1456290_x_at 216527 0.54 (0.00013) 0.63 8.7
Ccm3 1448527_at 56426 0.37 (1.39e-02) N.A. 8.7
Chordc1 1460645_at 66917 0.49 (0.00075) 0.58 14.7
Hspe1 1450668_s_at 15528 0.51 (0.00043) 0.52 13.7
l7Rn6 1419351_a_at 67669 0.72 (2.67e-09) 0.51 22.5
Oaz1 1436292_a_at 18245 0.47 (0.00139) 0.49 13.0
Stk4 1436015_s_at 58231 0.47 (0.00034) 0.78 11.7
Tmco1 1423759_a_at 68944 0.52 (0.00031) 0.53 14.4
Ubr5 1452718_at 70790 0.47 (0.00113) 0.57 12.6
Figure4.—Downstream potential targets of serine
threo-nine kinase 25 (Stk25).Stk25is located on Chr 1 at 95.4 Mb and iscis-modulated in brain (LRS¼96.1, INIA Brain mRNA M430: January06, probe set 141770_at). Several potential tar-gets of Stk25 have relatively strong trans QTL that overlap
0.001; trait ID, 10337) and with the volume of the dorsal (r¼ 0.48,P,0.01; ID, 10755), and ventral hippocam-pus (r ¼ 0.47, P , 0.01; trait ID, 10757). Rasd2 was found recently to affect another neurogenerative disor-der—Huntington’s disease—by interacting with the mu-tant allele of huntingtin (Subramaniamet al. 2009).
Next-generation eQTL studies: While the methods we have described here provide an effective way to correct for problems associated with array-based mea-surement of expression, there are more satisfying solutions that are now on the horizon. Massively parallel
sequencing of RNA samples (e.g., Mortazavi et al.
2008) represents a more direct way to measure steady-state abundance of mRNAs. RNA sequencing (RNA-seq) has three potential benefits in eQTL studies. First, this method is comparatively insensitive to sequence differences among individuals in segregating popula-tions. SNPs and short indels should not have a signifi-cant impact on the alignment and identification of 50-nt mRNA tags. Second, this method can resolve the relative expression of mRNA isoforms and will enable the genetic dissection of splice variants and alternative UTRs. Finally, this method can be multiplexed more easily than array-based methods. It will be practical to sequence pools of RNA from many samples in single runs. This should reduce technical confounds in large experimental designs that are so common in this field. We are now beginning to exploit this approach by profiling expression in the parental strains of the BXD RIs—a step that should allow us to recalibrate first-generation eQTL studies.
In this report we have developed and tested a protocol to systematically extract, study, and validate DNA se-quence variants that are responsible for differences in mRNA abundance in a RI population. We have done this by combining gene expression profiling with a collection of bioinformatics routines and molecular techniques, including qRT-PCR, ASE, and resequenc-ing. Our study demonstrates that both quantitative and
qualitative variation contributes to the mRNA diversity in segregating populations. In particular, we have
focused our work on cis-acting QTL. Validated cis
variations are in essence more subtle and natural forms of standard genetically engineered mutants. Rather than completely inactivating gene expression of a gene on a single strain background, these alleles modulate expression over a 2- to 20-fold range across a panel of readily available strains. As we have exemplified above, once validated, these allelic expression differences can be used in reverse genetic studies to generate well-defined hypotheses regarding downstream effects on molecular, cellular, and functional networks.
We thank M. Nielsen, T. Cunningham, F. Jiao, S. Li, H. Li, and Z. Sun for technical assistance. This work was supported by the National Institute on Alcohol Abuse and Alcoholism (NIAAA) (U01AA013499, U01AA014425), by the National Institute of Drug Abuse (NIDA) and NIAAA (P20-DA 21131), by the National Cancer Institute (U01CA105417), and by the National Center for Research Resources (U01NR 105417).
LITERATURE CITED
Alberts, R., P. Terpstra, L. V. Bystrykh, G.deHaanand R. C.
Jansen, 2005 A statistical multiprobe model for analyzing cis
and trans genes in genetical genomics experiments with short-oligonucleotide arrays. Genetics171:1437–1439.
Alberts, R., P. Terpstra, Y. Li, R. Breitling, J. P. Nap et al.,
2007 Sequence polymorphisms cause many false cis eQTLs. PLoS ONE2:e622.
Alberts, R., G. Veraand R.C. Jansen, 2008 affyGG: computational
protocols for genetical genomics with Affymetrix arrays. Bioinfor-matics24:433–434.
Brem, R. B., G. Yvert, R. Clintonand L. Kruglyak, 2002 Genetic
dissection of transcriptional regulation in budding yeast. Science
296:752–755.
Cavalieri, D., J. P. Townsendand D. L. Hartl, 2000 Manifold
anomalies in gene expression in a vineyard isolate of Saccharo-myces cerevisiae revealed by DNA microarray analysis. Proc. Natl. Acad. Sci. USA97:12369–12374.
Chen, L., G. P. Page, T. Mehta, R. Fengand X. Cui, 2009 Single
nucleotide polymorphisms affect both cis- and trans- eQTL. Genomics93:501–508.
Chesler, E. J., L. Lu, S. Shou, Y. Qu, J. Guet al., 2005 Complex trait
analysis of gene expression uncovers polygenic and pleiotropic
Figure 5.—Expression complementarity
be-tween Rasd2andAmigo2. Expression pattern of
Rasd2andAmigo2was analyzed usingin situdata available from Allen Brain Atlas (www.brain-map. org). (A) The expression ofRasd2in hippocam-pus is intense in CA1 and CA3 and weak or absent in CA2 or dentate gyrus (DG). (B) In contrast, the expression ofAmigo2 in hippocampus is in-tense only in the CA2 region. (C) Rasd2 (Chr 8, 78.1 Mb) iscis-modulated in hippocampus of the BXD panel (LRS¼23.7, Hippocampus Con-sortium M430v2: June06, probe set 1427343_at). (D)Amigo2is located on Chr 15 at 97.1 Mb and is modulated by atransQTL on Chr 8 at 78.7 Mb (LRS ¼ 27, probe set 1434601_at) overlapping
networks that modulate nervous system function. Nat. Genet.37:
233–242.
Damerval, C., A. Maurice, J. M. Josse and D. de Vienne,
1994 Quantitative trait loci underlying gene product variation: a novel perspective for analyzing regulation of genome expres-sion. Genetics137:289–301.
Dixon, A. L., L. Liang, M. F. Moffatt, W. Chen, S. Heathet al.,
2007 A genome-wide association study of global gene expres-sion. Nat. Genet.39:1202–1207.
Doss, S., E. E. Schadt, T. A. Drakeand A. J. Lusis, 2005 Cis-acting
expression quantitative trait loci in mice. Genome Res.15:681– 691.
Druka, A., E. Potokina, Z. Luo, N. Bonar, I. Druka et al.,
2008 Exploiting regulatory variation to identify genes underlying quantitative resistance to the wheat stem rust pathogenPuccinia graminis f. sp. triticiin barley. Theor. Appl. Genet.117:261–272. Errico, F., E. Santini, S. Migliarini, A. Borgkvist, D. Centonze
et al., 2008 The GTP-binding protein Rhes modulates dopa-mine signalling in striatal medium spiny neurons. Mol. Cell. Neu-rosci.37:335–345.
Florea, L., G. Hartzell, Z. Zhang, G..M. Rubinand W. Miller,
1998 A computer program for aligning a cDNA sequence with a genomic DNA sequence. Genome Res.8:967–974.
Goring, H. H., J. E. Curran, M. P. Johnson, T. D. Dyer, J. Charlesworth
et al., 2007 Discovery of expression QTLs using large-scale tran-scriptional profiling in human lymphocytes. Nat. Genet.39:1208– 1216.
Han, W., S. Kasai, H. Hata, T. Takahashi, Y. Takamatsu et al.,
2006 Intracisternal A-particle element in the 39noncoding re-gion of the mu-opioid receptor gene in CXBK mice: a new ge-netic mechanism underlying differences in opioid sensitivity. Pharmacogenet. Genomics16:451–460.
Homayouni, R., K. Heinrich, L. Weiand M. W. Berry, 2005 Gene
clustering by latent semantic indexing of MEDLINE abstracts. Bioinformatics21:104–115.
Hubner, N., C. A. Wallace, H. Zimdahl, E. Petretto, H. Schulz
et al., 2005 Integrated transcriptional profiling and linkage analysis for identification of genes underlying disease. Nat. Genet.37:243–253.
Ikeda, K., T. Kobayashi, T. Ichikawa, T. Kumanishi, H. Nikiet al.,
2001 The untranslated region of (mu)-opioid receptor mRNA contributes to reduced opioid sensitivity in CXBK mice. J. Neuro-sci.21:1334–1339.
Karp, C. L., A. Grupe, E. Schadt, S. L. Ewart, M. Keane-Mooreet al.,
2000 Identification of complement factor 5 as a susceptibility lo-cus for experimental allergic asthma. Nat. Immunol.1:221–226. Kent, W. J., 2002 BLAT—the BLAST-like alignment tool. Genome
Res.12:656–664.
Kwan, T., D. Benovoy, C. Dias, S. Gurd, C. Provencheret al.,
2008 Genome-wide analysis of transcript isoform variation in humans. Nat. Genet.40:225–231.
Law, L. W., A. G. Morrowand E. M. Greenspan, 1952 Inheritance
of low liver glucuronidase activity in the mouse. J. Natl. Cancer Inst.12:909–916.
Lee, J. Y., I. Yeh, J. Y. Parkand B. Tian, 2007 PolyA_DB 2: mRNA
polyadenylation sites in vertebrate genes. Nucleic Acids Res.
35:D165–D168.
Monks, S. A., A. Leonardson, H. Zhu, P. Cundiff, P. Pietrusiak
et al., 2004 Genetic inheritance of gene expression in human cell lines. Am. J. Hum. Genet.75:1094–1105.
Morley, M., C. M. Molony, T. M. Weber, J. L. Devlin, K. G. Ewens
et al., 2004 Genetic analysis of genome-wide variation in human gene expression. Nature430:743–747.
Morrow, A. G., E. M. Greenspanand D. M. Carroll, 1949
Liver-glucuronidase activity of inbred mouse strains. J. Natl. Cancer Inst.10:657–661.
Mortazavi, A., B. A. Williams, K. McCue, L. Schaeffer and B.
Wold, 2008 Mapping and quantifying mammalian
transcrip-tomes by RNA-Seq. Nat. Methods5:621–628.
Ono, T., N. Sekino-Suzuki, Y. Kikkawa, H. Yonekawaand S. Kawashima,
2003 Alivin 1, a novel neuronal activity-dependent gene, inhibits apoptosis and promotes survival of cerebellar granule neurons. J. Neurosci.23:5887–5896.
Overall, R. W., G. Kempermann, J. Peirce, L. Lu, D. Goldowitz
et al., 2009 Genetics of the hippocampal transcriptome in mouse: a systematic survey and online neurogenomics resource. Front. Neurogen. doi: 10.3389/neuro.15.003.2009.
Peirce, J. L., H. Li, J. Wang, K. F. Manly, R. J. Hitzemannet al.,
2006 How replicable are mRNA expression QTL? Mamm. Ge-nome17:643–656.
Rosen, G. D., C. J. Pung, C. B. Owens, J. Caplow, H. Kimet al.,
2009 Genetic modulation of striatal volume by loci on Chrs 6 and 17 in BXD recombinant inbred mice. Genes Brain Behav.
8:296–308.
Rozen, S., and H. Skaletsky, 2000 Primer3 on the WWW for
gen-eral users and for biologist programmers. Methods Mol. Biol.
132:365–386.
Schadt, E. E., S. A. Monks, T. A. Drake, A. J. Lusis, N. Cheet al.,
2003 Genetics of gene expression surveyed in maize, mouse and man. Nature422:297–302.
Schwartz, D., 1962 Genetic studies on mutant enzymes in maize.
II. On the mode of synthesis of the hybrid enzymes. Proc. Natl. Acad. Sci. USA48:750–756.
Simon, P., 2003 Q-Gene: processing quantitative real-time RT-PCR
data. Bioinformatics19:1439–1440.
Spano, D., I. Branchi, A. Rosica, M. T. Pirro, A. Riccioet al.,
2004 Rhes is involved in striatal function. Mol. Cell. Biol.24:
5788–5796.
Stranger, B. E., A. C. Nica, M. S. Forrest, A. Dimas, C. P. Birdet al.,
2007 Population genomics of human gene expression. Nat. Genet.39:1217–1224.
Subramaniam, S., K. M. Sixt, R. Barrow and S. H. Snyder,
2009 Rhes, a striatal specific protein, mediates mutant-hunting-tin cytotoxicity. Science324:1327–1330.
Voss, K., S. Stahl, E. Schleider, S. Ullrich, J. Nickel et al.,
2007 CCM3 interacts with CCM2 indicating common patho-genesis for cerebral cavernous malformations. Neurogenetics
8:249–256.
Yeo, G., D. Holste, G. Kreimanand C. B. Burge, 2004 Variation in
alternative splicing across human tissues. Genome Biol.5:R74. Zhang, B., D. Schmoyer, S. Kirovand J. Snoddy, 2004 GOTree
Machine (GOTM): a web-based platform for interpreting sets of interesting genes using Gene Ontology hierarchies. BMC Bio-informatics5:16.
Zhang, H., J. Y.Leeand B. Tian, 2005 Biased alternative
polyade-nylation in human tissues. Genome Biol.6:R100.