Quantitative Trait Locus Mapping in Laboratory Mice Derived From
a Replicated Selection Experiment for Open-Field Activity
Maria Grazia Turri,* Norman D. Henderson,
†John C. DeFries
‡and Jonathan Flint*
*Wellcome Trust Centre for Human Genetics, Oxford, OX3 7BN, United Kingdom,†Oberlin College, Oberlin, Ohio 44074-1086 and‡Institute for Behavioral Genetics, University of Colorado, Boulder, Colorado 80309
Manuscript received November 6, 2000 Accepted for publication April 2, 2001
ABSTRACT
Bidirectional selection in rodents has been used to derive animal models of human behavior. An important question is whether selection for behavior operates on a limited number of QTL or whether the number and individual contribution of QTL varies between selection experiments. To address this question, we mapped QTL in two large F2intercrosses (N⫽815 and 821) from the four lines derived
from a replicated selection experiment for open-field activity, an animal model for susceptibility to anxiety. Our analyses indicate that selection operated on the same relatively small number of loci in both crosses. Haplotype information and the direction of effect of each QTL allele were used to confirm that the QTL mapped in the two crosses lie in the same chromosomal regions, although we were unable to determine whether QTL in the two crosses represent the same genes. We conclude that the genetic architecture of the selected strains is similar and relatively simple.
A
RTIFICIAL selection for extremes of animal behav- mans indicate a complex genetic basis for behavior ior has long been used to derive strains that can (Risch and Botstein 1996; Risch and Merikangas be used to test hypotheses about the underlying neuro- 1996;Uhl et al. 1997), the genetic architecture of se-biology of behavior. If the experiment results in animals lected strains appears to be surprisingly simple, with a that show consistent heritable differences in the appara- small number of quantitative trait loci (QTL) contribut-tus, selection is assumed to have produced a state model ing to the bulk of the genetic variance (Flintet al.1995; of the behavioral trait. Such models are potentially use- Moisanet al.1996).ful since most important human behavioral disorders We previously carried out a QTL mapping study of are trait conditions with moderate to high heritabilities. mice selected for activity differences in an open-field For example, rats selected for high and low behavior in arena (hereafter referred to as the DeFries strains;Flint the elevated plus maze, a pharmacologically validated et al.1995). An open-field arena is a large, well-lit white model for human anxiety, could be considered as ani- box, considered anxiogenic to rodents: animals selected mal models of trait anxiety (Liebsch et al. 1998a,b). for low activity are regarded as more fearful than those Searching for behavioral, physiological, and biochemi- selected for high activity. Just three loci (on chromo-cal differences between high- and low-selected strains somes 1, 12, and 15) were found to contribute to most has been a fruitful method of investigating the biobehav- of the genetic variance of open-field ambulation (OFA) ioral basis of animal models. Rats selected for differ- and the genetically correlated trait of open-field defeca-ences in two-way active avoidance (the shuttle-box) have tion (OFD). If the genetic architecture were as simple provided evidence for the association between changes as the mapping results suggest, it would considerably in steroid hormone levels and behavioral stress (Dris- simplify the process of identifying the underlying genes. coll and Battig 1982; Driscoll et al. 1987, 1998; However, it is possible that the study may have
under-Ferreet al.1995). estimated the true number of loci and overestimated
With the advent of complete genome maps for mice the contribution of each QTL (Utz andMelchinger (Van Ettenet al.1999) and rats (Watanabeet al.1999; 1994; Beavis 1998). The small contribution of each McCarthyet al.2000), it has become possible to extend locus to the total phenotypic variation means that large the analysis of selected strains and to identify the genetic sample sizes are needed for their detection. Further-loci underlying the heritable differences in behavior as more, the response to selection may have been unusual a prelude to identifying the molecular nature of the
in the strains studied: We did not have data from a allelic variants. While difficulties mapping genes in
hu-replicate to see whether the outcome was a similarly simple genetic architecture. Finally, as stressed in a re-cent study of mouse behavior, problems of replication
Corresponding author:Jonathan Flint, Wellcome Trust Centre for
beset behavioral measures, particularly when searching
Human Genetics, Roosevelt Dr., Headington, Oxford, OX3 7BN,
United Kingdom. E-mail: [email protected] for small effects (Crabbeet al.1999). Independent
F1cross was reciprocal, consisting of equal numbers of male cations are essential to establish confidently the position
H1⫻female L1 and vice versa. Similarly, 821 F2animals were and number of loci (Melchingeret al.1998).
derived from the DeFries H2 and L2 animals. In this way four
The DeFries strains are derived from a replicated se- different F
2combinations occur for each replicate, taking into lection experiment and thus provide an opportunity to account strain and sex of the progenitor inbred strains. All
mice were bred in the specific pathogen-free colony of the
investigate thoroughly the genetic architecture of the
Institute for Behavioral Genetics (Boulder, CO). Animals were
response to behavioral selection. The foundation for
weaned at 25 days and housed with like-sex littermates (no
the selection experiment consisted of an F3generation
more than 5 per cage) until day 40 when they were individually
derived from a cross between two inbred lines, BALBc/J housed prior to testing. All testing was done during the first and C57BL/6J. Ten F3litters that contained at least two 4 hr of the dark cycle. For comparison, we included data from
our original F2intercross, a separate set of mice from those males and females were chosen at random. The most
described here, but derived from the same H1 and L1 parents
active male and female within each litter were selected
(Flintet al.1995). A description of the phenotypic measures
to become the progenitors of one selected line, termed
for these mice is given inFlintet al.(1995).
H1. The least active male and least active female from Open field:The open field is a 61-cm white plastic-lined each of these same 10 litters were selected to serve as square box, 38 cm deep. The apparatus is covered and a 100-W
bulb placed over the center, providing a graded illumination,
progenitors of a low-activity line, L1. Exactly the same
ⵑ600 lux at the center of the arena. In addition to 11 light
selection procedure was applied to members of a second
beams on each side of the apparatus to detect horizontal
randomly chosen group of 10 F3litters, thereby
provid-movement, 4 light beams at each corner were placed 6 cm
ing 10 pairs of parents for replicate selected lines H2 from the floor to detect rearing on the walls of the open field. and L2. From a third set of F3litters a male and female Animals are placed in a Plexiglas cylinder in one corner of
the apparatus, the cylinder is removed, and activity is
moni-were chosen at random to serve as the progenitors of
tored for a 5-min interval. At the end of the session the number
a control line, C1. In the same manner, parents for a
of fecal boli deposited is recorded and the floor is cleaned.
replicate control line (C2) were chosen from a fourth
Elevated plus maze:The elevated plus maze (EPM) consists
set of 10 F3litters. Within each of these six lines, animals of four runways (5⫻30 cm) arranged in a cross and elevated chosen for breeding were mated at random after selec- 37.5 cm above the ground. Black acrylic plastic walls (21 cm) tion. The resulting progeny represented the first se- enclose two arms and two arms are open (regarded as relatively anxiogenic). The open arms contain a slight raised (0.25-cm)
lected generation. In subsequent generations, one male
edge to provide additional grip. Photo beams, positioned to
and female were chosen when possible from each litter.
detect both horizontal activity and vertical rearing, detect
Within the two high lines the most active male and movement. Animals were tested for a 5-min period and the female were selected from each litter, whereas the least time spent on the open arms was recorded, as well as the active male and female were selected from each litter number of entries into the open and closed arms of the
appa-ratus.
in the two low lines. Within the control lines, one male
Light-dark box:The light-dark box consists of two chambers.
and one female were chosen entirely at random from
The dark enclosed compartment is 27⫻15 cm and has an
each litter. After selection the chosen males and females
exit, 8 cm wide and 9 cm high, in the middle of the wall
were mated at random within line. The number of mice adjoining the light compartment (31⫻27 cm). A 60-W bulb tested in each of the six lines varied between 44 and positioned over the center of the light compartment delivers
ⵑ400 lux. Photo beams record horizontal activity in both light
108. Thirty generations of selection were completed and
and dark compartments. Animals were placed in the dark
in generation 30 open-field activity scores of the high
chamber and movement recorded over a 5-min period.
Mea-lines were 30 times greater than those of the low Mea-lines.
sures of latency to emerge from the dark compartment, time
Following the suspension of selection the six lines were spent in both compartments, and activity counts in both com-randomly mated within line for 18 generations and then partments were recorded.
inbred using brother-sister mating (DeFriesandHeg- DNA extraction and genotyping:DNA was extracted from spleens using standard techniques and diluted to a
concentra-man1970;DeFrieset al.1978).
tion of 10 ng/l and 50 ng was used for amplification
reac-Our initial QTL mapping experiment of open-field
tions. All PCRs were carried out in 96-well plates using Taq
behavior was performed in a cross between H1 and L1 polymerase, the manufacturer’s buffer (Boehringer Mann-strains. We set out to replicate this finding and to estab- heim, Indianapolis) with 2 mmMgCL
2. PCR conditions were lish whether the same QTL were segregating in a cross 30 sec at 95⬚; 30 sec at either 50⬚, 55⬚, or 60⬚; and 30 sec at 72⬚, with the annealing temperature determined by a test
between H2 and L2. In addition to measures taken in
reaction to assay which temperature gave a specific product.
the open-field arena, we report results from two other
We used markers previously used in the initial H1⫻L1 cross
tests used in investigations of the neurobiology of
anxi-(Flintet al.1995). We screened these markers on the parental
ety: the elevated plus maze and the light-dark box. The inbred strains H2 and L2, looking for strain differences, and data set allows us to compare replications across differ- where we found that a marker was not polymorphic in this cross, we screened the parental strains with nearby markers
ent behavioral tests.
(Van Ettenet al.1999). We chose markers with a difference between the two alleles of at least 6 bp so that all products could be analyzed on 4% agarose gels. Alleles were scored MATERIALS AND METHODS
using a semiautomated system, coded in Interactive Data Lan-guage, and allele calls were checked manually. Allele sizes
F2intercrosses:The DeFries H1 and L1 lines were crossed
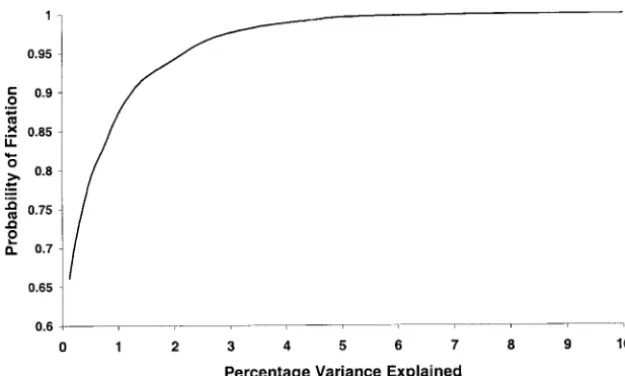
parent allele, homozygote for the H parent allele, or heterozy- ability of ⬎0.99 of going to fixation in the expected gote. The order of all markers was checked using the MAP- direction, but the probability drops sharply for QTL MAKER software package (Lincolnet al.1992) and results
explaining⬍2% of the variance (probability of 0.87 for
were compared with radiation hybrid maps (Van Ettenet al.
a QTL explaining 1% of the variance).
1999).
QTL mapping procedures:Using the map distances derived QTL mapping:Genotypes were obtained for 815
ani-from the MAPMAKER software, we analyzed all data by interval mals in the H1 ⫻ L1 cross and 821 animals in the mapping (LanderandBotstein1989) in QTL-MAPMAKER H2⫻ L2 intercross. All animals were genotyped with (Lincolnet al.1992) and composite interval mapping (Zeng
all markers (a total of 128,500 genotypes). The results
1994) in QTL-CARTOGRAPHER (Basten et al. 1996). We
for mapping open-field behaviors in the two replicates
used permutations to establish appropriate significance
thresholds (Churchill and Doerge 1994; Doerge and and the first F2 intercross are shown in Table 1, which Churchill1996). Simulated data were generated with a pro- gives LOD scores, position on the chromosome, and gram written in C, available on request from [email protected]. percentage of the phenotypic variance explained for ac.uk. The selection experiment was simulated using exactly
QTL that exceed the 1% significance threshold (LODs
the same breeding strategy applied in the original experiment
⬎3) for at least one intercross. The numbers of animals
and described in the Introduction. For multiple trait
compos-ite interval mapping we used JZmapqtl (Bastenet al.1996). in the two replicates are nearly equivalent, so we can
We started by fitting phenotype and genotype data to a simple directly compare the LOD scores. However, the first linear regression model and, for each chromosome, chose experiment genotyped only 384 animals, including positively correlated traits with near normal distributions and
those with the most extreme OFA scores. P values ⬍0.001. These traits were used for multiple trait
The remarkably high LOD scores on chromosome 1
analysis (JiangandZeng1995), in which a test for the
pres-ence of a QTL is performed using a likelihood-ratio statistic. for both OFA and OFD in all three experiments
un-We tested the full model ofJiangandZeng(1995) for a QTL equivocally replicate the finding that a locus here
ex-influencing all traits jointly. plains about one-half the genetic variance of both traits.
The results for other chromosomes are more equivocal. The locus on chromosome 15 is again detected, but
RESULTS
with a reduced LOD score (11.0 compared to 5.6 and 7.3), and the locus on chromosome 12 does not reach Significance thresholds and simulation results:To
ob-tain an appropriate threshold value for detecting a QTL the 1% significance level in the two replicates. A locus on chromosome 17 failed to reach significance in the effect, we employed a permutation test. For a single
phenotype the values we obtained were 3.2 and 3.9 for replicates, and the LOD score for a locus on chromo-some 18 exceeded only 3 in the H2⫻ L2 intercross. the 5 and 1% genome-wide significance levels,
respec-tively. Phenotypes within each test were significantly and Furthermore, a highly significant locus for OFA on chro-mosome 7 was missed in the first H1⫻L1 cross (LOD positively correlated, except for activity and defecation
in the open field, which correlated negatively (⫺0.3). 1.3 compared to LODs of 7.6 and 7.0).
In both crosses the direction of allele effects was the There were no significant correlations with measures in
other tests. Therefore we divided theP values obtained same and the estimated dominance components were similar (Table 2). Not all QTL were additive: The QTL for one phenotype by the number of tests (four) to
obtain significance levels appropriate to our experi- on chromosome 1 has a substantial dominance compo-nent in both crosses, and the QTL on chromosome 7 ment. The resulting 5% threshold was a LOD score of
3.8 and the 1% level was 4.5. However, as the correla- acts recessively, consistent with it representing the al-bino c locus. The effect of albinism on open-field behav-tions between measures were low (on the order of 0.3),
the thresholds may be too stringent so we reported all iors is well documented (Abeelen and Kroes 1968; DeFries1969; Thiessenet al. 1970;Katz andDoyle LOD scores that equaled or exceeded the 5% threshold
for a single phenotype (LOD 3.2). 1981;LassalleandLe Pape1983) and its detection by
QTL methodology was expected. Failure to find the To estimate the expected genetic architecture of the
selected lines, we simulated 10,000 replicate selection locus in the previous F2intercross (H1⫻L1) is probably a consequence of genotyping extremes only.
experiments, using the breeding and selection strategy
of the experiment that led to the creation of the selected The progenitor strains for the selection experiment, C57BL/6 and BALB/c, were also genotyped with all lines described above. For each simulation we recorded
which allele (increaser or decreaser) went to fixation, markers to determine the origin of alleles in each strain. Except for the locus on the X chromosome, QTL that using an additive model and QTL of different effect
sizes. In Figure 1 we show the probability that an in- increase open-field activity were found on chromosomal regions derived from the C57BL/6 progenitor, and creaser allele goes to fixation when under selective
pres-sure for increasing the phenotype. For comparison with QTL that decrease OFA were found on the BALB/c-derived chromosomal regions. In both crosses, QTL on our mapping results, the effect size is shown as the
percentage phenotypic variance that would be ex- chromosomes 1, 7, and the X influence OFD and OFA in opposite directions, as expected given the known phe-plained in an F2 intercross. Increasing alleles of QTL
Figure1.—The probability during selection for high phenotypic scores of a QTL allele that increases the phenotypic score going to fixation. The selection protocol is described in the text. Probabilities are calculated from 10,000 simulations.
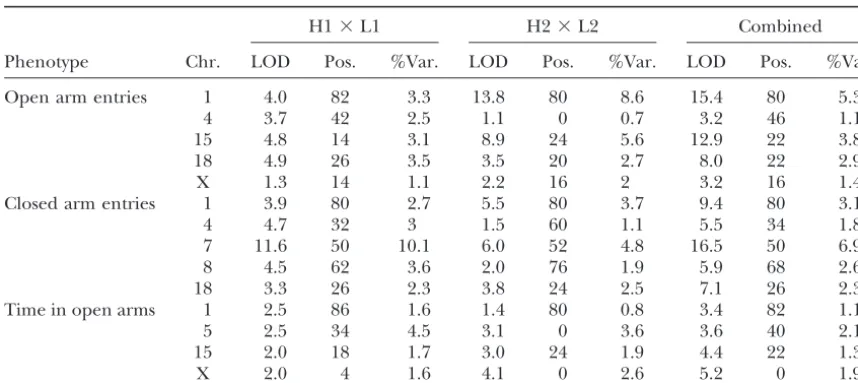
Hegman1970). Interestingly, the increasing QTL allele the elevated plus maze we mapped loci on chromosomes 1, 15, and 18 in both crosses; in the light-dark box we on chromosome 14 that influences only OFD is from
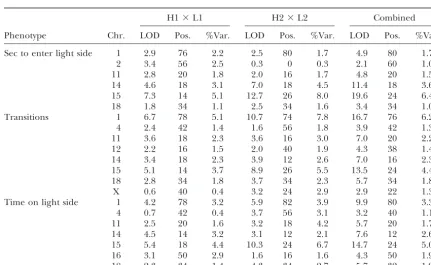
the C57BL/6 strain, unlike the other autosomal QTL. find loci on chromosomes 1, 14, and 15. As with QTL influencing open-field behaviors, the direction and Tables 3 and 4 give the results of mapping behaviors
in the light-dark box and elevated plus maze. For these dominance effects of QTL in the two crosses were the same (data not shown).
phenotypes there is less consistency in the LOD scores
than seen for the open-field results, with intergroup Haplotype analysis: The results suggest that the un-derlying loci are the same in the two crosses, but our differences of well over 5 LODs for the light-dark box
on chromosome 15 and entries into the open arms of mapping information is insufficiently powerful to deter-mine whether this is indeed the case: for QTL contribut-the elevated plus maze on chromosome 1. Nevercontribut-theless,
when we consider loci explaining ⬎3% of the pheno- ing 5% to the phenotypic variance, mapped with 800 animals, the 95% confidence intervals of the QTL loca-typic variance, the data do indicate that the same loci
are contributing to the phenotype in each cross. For tion still encompassⵑ40 cM, or about one-half a mouse
TABLE 1
QTL with LOD scores exceeding a 5% significance threshold for open-field activity and defecation
H1⫻L1 (1995) H1⫻L1 H2⫻L2 Combined
Phenotype Chr. LOD Pos. %Var LOD Pos. %Var LOD Pos. %Var LOD Pos. %Var
OFA 1 13.4 74 10.7 12.8 72 10.9 14.8 74 10.0 27.3 74 10.0
4 6.2 34 4.2 2.5 36 1.7 1.6 62 1.2 3.5 36 1.1
7 1.3 46 1.2 7.6 66 6.5 7.0 50 6.0 13.1 52 5.8
12 4.3 2 3.5 2.9 16 1.8 1.4 50 1.0 3.6 40 1.2
15 11.0 12 8.3 5.6 12 3.5 7.3 26 4.8 12.4 20 4.0
17 3.4 12 2.5 1.0 14 0.6 1.4 0 0.8 0.4 14 0.2
18 4.0 10 4.4 2.2 34 1.4 3.4 32 2.2 5.3 32 1.7
X 1.9 32 0.8 2.1 14 1.5 3.3 12 1.9 5.2 14 1.9
OFD 1 4.8 80 4.1 7.6 80 5.8 7.4 72 5.3 14.4 74 5.5
7 2.8 32 9.6 1.2 82 0.9 4.0 42 3.1 3.3 44 1.4
12 4.4 6 4.6 1.5 16 0.9 0.4 44 0.3 1.7 38 0.6
14 2.5 0 5.9 4.0 18 2.5 5.9 22 4.5 9.4 20 3.3
X 1.2 38 1.3 2.1 2 1.6 3.9 52 3.9 5.3 50 2.7
Data are given for three F2intercrosses. The first [H1⫻L1 (1995)] was described inFlintet al.(1995) and the results are
TABLE 2
Additive and dominance components of QTL for open-field behaviors
H1⫻L1 H2⫻L2
Phenotype Chr. Additive Dominant Additive Dominant
OFA 1 ⫺0.39 ⫺0.36 ⫺0.43 ⫺0.27
4 ⫺0.17 ⫺0.02 ⫺0.15 ⫺0.04
7 ⫺0.17 0.39 ⫺0.27 0.31
12 ⫺0.18 0.07 ⫺0.11 0.13
15 ⫺0.25 0.11 ⫺0.30 0.08
18 ⫺0.16 0.00 ⫺0.21 0.06
X 0.11 ⫺0.14 0.15 ⫺0.14
OFD 1 0.31 0.17 0.27 0.26
7 0.12 ⫺0.09 0.18 ⫺0.22
14 ⫺0.21 0.12 ⫺0.25 0.18
X ⫺0.01 ⫺0.28 ⫺0.08 ⫺0.31
Data are given for the two F2intercrosses that derive from the replicate selection experiment. Additive and
dominance components were estimated with MAPMAKER-QTL (Lincolnet al. 1992). Alleles were categorized as either BALB/c or C57BL/6 (progenitors of the selection experiment) from the size of the microsatellite alleles. The direction of allelic effects is given with respect to the BALB/c allele, which in each case decreases activity and increases defecation in the open-field arena.
chromosome (DarvasiandSoller1997). Thus selec- the same progenitor inbred strain, which is either C57BL/6 or BALB/c. Therefore, if selection operated tion could have operated on different QTL in the same
chromosomal region. However, QTL cannot be segre- on the same QTL, we expect this to be reflected in the chromosomal structure: A region containing a QTL in gating in regions where the chromosome is derived from
TABLE 3
Light-dark box: LOD scores exceeding a 5% significance threshold for the two F2intercrosses
(H1⫻L1 and H2⫻L2) and for a combined data set
H1⫻L1 H2⫻L2 Combined
Phenotype Chr. LOD Pos. %Var. LOD Pos. %Var. LOD Pos. %Var.
Sec to enter light side 1 2.9 76 2.2 2.5 80 1.7 4.9 80 1.7
2 3.4 56 2.5 0.3 0 0.3 2.1 60 1.0
11 2.8 20 1.8 2.0 16 1.7 4.8 20 1.5
14 4.6 18 3.1 7.0 18 4.5 11.4 18 3.6
15 7.3 14 5.1 12.7 26 8.0 19.6 24 6.4
18 1.8 34 1.1 2.5 34 1.6 3.4 34 1.0
Transitions 1 6.7 78 5.1 10.7 74 7.8 16.7 76 6.2
4 2.4 42 1.4 1.6 56 1.8 3.9 42 1.3
11 3.6 18 2.3 3.6 16 3.0 7.0 20 2.2
12 2.2 16 1.5 2.0 40 1.9 4.3 38 1.4
14 3.4 18 2.3 3.9 12 2.6 7.0 16 2.3
15 5.1 14 3.7 8.9 26 5.5 13.5 24 4.4
18 2.8 34 1.8 3.7 34 2.3 5.7 34 1.8
X 0.6 40 0.4 3.2 24 2.9 2.9 22 1.3
Time on light side 1 4.2 78 3.2 5.9 82 3.9 9.9 80 3.3
4 0.7 42 0.4 3.7 56 3.1 3.2 40 1.1
11 2.5 20 1.6 3.2 18 4.2 5.7 20 1.7
14 4.5 14 3.2 3.1 12 2.1 7.6 12 2.6
15 5.4 18 4.4 10.3 24 6.7 14.7 24 5.0
16 3.1 50 2.9 1.6 16 1.6 4.3 50 1.9
18 2.3 34 1.4 4.3 34 2.7 5.7 32 1.9
TABLE 4
Elevated plus maze: LOD scores exceeding a 5% significance threshold for the two F2intercrosses
(H1⫻L1 and H2⫻L2) and for a combined data set
H1⫻L1 H2⫻L2 Combined
Phenotype Chr. LOD Pos. %Var. LOD Pos. %Var. LOD Pos. %Var.
Open arm entries 1 4.0 82 3.3 13.8 80 8.6 15.4 80 5.3
4 3.7 42 2.5 1.1 0 0.7 3.2 46 1.1
15 4.8 14 3.1 8.9 24 5.6 12.9 22 3.8
18 4.9 26 3.5 3.5 20 2.7 8.0 22 2.9
X 1.3 14 1.1 2.2 16 2 3.2 16 1.4
Closed arm entries 1 3.9 80 2.7 5.5 80 3.7 9.4 80 3.1
4 4.7 32 3 1.5 60 1.1 5.5 34 1.8
7 11.6 50 10.1 6.0 52 4.8 16.5 50 6.9
8 4.5 62 3.6 2.0 76 1.9 5.9 68 2.6
18 3.3 26 2.3 3.8 24 2.5 7.1 26 2.3
Time in open arms 1 2.5 86 1.6 1.4 80 0.8 3.4 82 1.1
5 2.5 34 4.5 3.1 0 3.6 3.6 40 2.1
15 2.0 18 1.7 3.0 24 1.9 4.4 22 1.3
X 2.0 4 1.6 4.1 0 2.6 5.2 0 1.9
Shown are the chromosome (Chr.), the position (Pos.) in centimorgans of the maximum LOD score (LOD), and the percentage of the phenotypic variance (%Var.) explained. All values are derived from MAPMAKER-QTL (Lincolnet al. 1992).
the H1 and H2 strains should derive from the same information. For example, on chromosome 1, between 45 and 55 cM, both H1 and H2 are BALB/c in origin progenitor (C57BL/6 or BALB/c) and be different
from L1 and L2. Furthermore we expect the direction while L1 and L2 are C57BL/6, thus excluding this re-gion as containing the QTL, while the rere-gion from 65 of the QTL effect to be same in H1 and H2, opposing
that of both L1 and L2. We therefore set out to analyze to 85 cM has the converse pattern and could therefore harbor the QTL. Although this region is still large, the the chromosomal structure around the largest QTL
(those on chromosomes 1, 4, 7, and 15) and see if the intervals on chromosomes 4 and 15 are small:⬍10 cM in both cases. In addition to the chromosomes shown in same chromosomal regions contained the QTL in both
crosses. Figure 2 we analyzed chromosome 18 (data not shown).
Again we found that the chromosomal structure in the DNA from the four selected strains (H1, L1, H2, and
L2) as well as DNA from the progenitor animals region most likely to contain the QTL was the same in the two crosses.
C57BL/6 and BALB/c was amplified with markers
spaced every 5 cM across those chromosomes identified The combination of composite interval mapping for multiple traits and haplotype analysis decreases the in-as containing QTL explaining⬎5% of the phenotypic
variance. We also used composite interval mapping for tervals containing QTL and goes some way to demon-strating pleiotropic action. Under each peak of the com-multiple traits to map correlated traits on chromosomes
1, 4, 7, and 15 and plotted the results over the haplotype posite interval mapping, there lies a chromosomal region of the expected haplotype structure. Thus, for pictures; the results are shown in Figure 2. The
chromo-somes of the selected strains are colored according to example, on chromosome 15 there is a small C57BL/ 6-derived region at ⵑ20 cM (solid box in Figure 2) their progenitor origin: Black indicates C57BL/6 and
white indicates BALB/c. Since we know the direction under the likelihood-ratio peak. A recombinant inbred segregation test previously showed that the region con-of effect con-of each allele, we can exclude chromosomal
regions that do not have a pattern consistent with that tains the QTL influencing OFA and OFD (Turriet al.
䉴
1999). It is also gratifying to observe that the albino (c) QTL are found, indicating that the genetic architecture of the two selected strains is relatively simple.
locus was mapped to 44 cM on chromosome 7 (Kwon
et al.1989), coincident with the peak of the composite Our findings have a number of implications for the interpretation of QTL mapping and the inferred ge-interval mapping (Figure 2).
Identifying QTL of small effect:Our results indicate netic architecture of selected strains. Comparing the two H1 ⫻ L1 crosses for open-field activity, only two that the same major QTL are segregating in both strains
but do not rule out the possibility that many additional loci (on chromosomes 1 and 15) occur in both experi-ments at significance thresholds of⬍1%. It is likely that smaller QTL that differentiate the crosses could be
pres-ent. In each F2 we do not have the power to detect procedural differences between the two crosses explain the discrepancies: The first intercross employed a circu-reliably QTL contributing⬍2% to the phenotypic
vari-ance (using a power calculation given byDarvasi1998), lar open-field arena and testing occurred during the light cycle with uniform illumination of the apparatus. but by combining the data set we do. We analyzed
phe-notypes and gephe-notypes from all 1636 mice in MAP- Testing in the open field was carried out with ambient noise. By contrast, phenotyping in the two experiments MAKER-QTL and in QTL-CARTOGRAPHER. Table 1
shows LOD scores of open-field measures using the com- described here was performed in the first half of the dark cycle (when mice are active) in a square open-bined data sets and Tables 3 and 4 show the results for
elevated plus maze and light-dark box. field arena (allowing the animals access to relatively
safe corners) that was soundproofed and had graded Where there is evidence that QTL segregate in both
crosses, the LOD scores in the combined data set are illumination (the center being brighter and hence more threatening than the periphery).
approximately the sum of the two LODs, so that for the
locus on chromosome 1 we obtain a LOD of 27 for OFA There is greater agreement between the analyses of the two crosses that were bred and phenotyped contem-and a LOD of 14 for OFD. There are remarkably few
changes to the QTL identified in the individual crosses: poraneously using the same phenotypic assessments, even though these crosses are not genetically identical. Regarding the loci in each behavioral test as
indepen-dent, 42 QTL were found in the two crosses and 48 in Of five loci for OFA that exceed the 5% significance threshold, three are found in both crosses and the differ-the combined data set. If we accept that differ-the QTL act
pleiotropically across all behavioral tests, then the com- ence between LODs is much smaller than the differ-ences observed between the noncontemporaneous bined data set identified 12 loci, only 2 of which were
not found in the individual F2intercrosses. One of these H1⫻L1 replicates. Analysis of combined data from the two new crosses replicated all but one of the QTL found is a locus on chromosome 12, which replicates the
find-ing from the previous F2intercross of H1⫻L1 (Flint in the original H1 ⫻ L1 (a QTL on chromosome 17 achieved a LOD of 3.4 in the first cross, but only 0.4 in
et al.1995).
the combined set), while identifying a further two (on chromosomes 7 and X). Two QTL, those on
chromo-DISCUSSION
somes 12 and 4 found in the initial F2 analysis, are replicated only with a LOD⬎3.2 in the combined data We carried out the largest genome scan of animal
behavior so far reported and we describe the first QTL set. Overall, our data show that it is possible to replicate QTL analysis for QTL influencing behavior, but that analysis of a replicated behavioral selection experiment.
The results confirm and extend the findings of our confirmation at significance levels of 1% or lower re-quires large numbers of animals.
initial F2 intercross of the H1 and L1 DeFries strains.
Using significance levels derived from permutation We amassed evidence indicating that the genetic ar-chitecture of the selected strains is very similar and is tests, we replicated loci on chromosomes 1, 4, 12, 15,
and 18 for open-field activity and identified new loci on relatively simple. First, we find that the results from two crosses, H1 ⫻ L1 and H2⫻ L2, are in agreement: In chromosome 7 and on the X chromosome. Open-field
defecation mapped to four loci (1, 7, 14, and X). both crosses the same chromosomes are found to harbor QTL accounting for⬎3% of the phenotypic variance. By analyzing four lines derived from a replicated
selec-tion experiment, we have been able to investigate the Where in one cross a LOD score of 3.2 or more indicates the presence of a QTL, there is supporting evidence effects of selection on behavior. Our data indicate that
selection operated on the same relatively small number from the other cross so that the number of QTL in the combined data (48) is almost the same as in the of loci in both crosses. Haplotype information and the
direction of effect of each QTL allele were used to individual analyses (42).
However, it remains possible that, within the large confirm that the QTL mapped in the two crosses lie in
the same chromosomal regions, although our analyses regions identified by the F2 mapping data, different molecular variants may be segregating in the two crosses. are not sufficiently powerful to determine whether the
QTL do in fact represent the same genes. Finally, we We attempted to address this issue by using composite interval mapping to reduce the intervals as much as demonstrated that in a combined sample, with twice
the chromosomal structure of the four strains. Together tribution, and the likely molecular nature of the QTL the data show that the position of the QTL coincides remain to be addressed.
with the expected common chromosomal structure and David Fulker was instrumental in the design of this project but considerably refine the locations of the QTL. These unfortunately did not live to see its completion. We acknowledge the support of Allan C. Collins throughout the project and we are grateful
findings make it less likely that selection has operated on
to Theresa Tritto, Michelle Bohl, Colleen Cykowski, and Susmita Datta
different QTL on the same chromosome and strengthen
for technical assistance. This work was supported by U.S. National
the case that the two high strains (H1 and H2) contain
Institute of Mental Health grant MH53480 to David Fulker, Norman
the same QTL that increase OFA, while the two low Henderson, Jonathan Flint, and John DeFries. The Wellcome Trust strains (L1 and L2) share the decreasers. Nevertheless, supports Jonathan Flint. Maria Grazia Turri is a Scatcherd European each QTL may still be the product of a number of closely scholar, supported by a fellowship from the Italian Telethon.
linked genetic effects.
Our analyses of the other phenotypes (in the elevated plus maze and the light-dark box) are consistent with
LITERATURE CITED
the conclusions reached from the open-field data,
Abeelen, J. H. V., andH. W. Kroes, 1968 Albinism and mouse
namely that the same small numbers of loci influence
behaviour. Genetica38:419–429.
the phenotypes in both crosses. The evidence suggests Basten, C. J., Z-B. ZengandB. S. Weir, 1996 QTLCartographer: that the QTL are acting pleiotropically: There is a close a suite of programs for mapping quantitative trait loci, p. 108 in
Abstracts to Plant Genome, IV. Academic Press, San Diego.
coincidence in the map positions; QTL effects operate
Beavis, W. D., 1998 QTL analyses: power, precision and accuracy,
in the same direction as the phenotypic correlations (so
pp. 250–266 in49th Annual Corn and Sorghum Industry Research
that, for example, the C57BL/6 allele on chromosome Conference.ASTA, Washington, DC.
Churchill, G. A., and R. W. Doerge, 1994 Empirical threshold
1 increases OFA, decreases OFD, and increases the time
values for quantitative trait mapping. Genetics138:963–971.
spent in both the open arms of the elevated maze and
Crabbe, J. C., D. WahlstenandB. C. Dudek, 1999 Genetics of
the light section of the light-dark box); and composite mouse behavior: interactions with laboratory environment. Sci-interval mapping of multiple traits identifies likelihood- ence284:1670–1672.
Darvasi, A., 1998 Experimental strategies for the genetic dissection
ratio peaks over relatively small regions with the
pre-of complex traits in animal models. Nat. Genet.18:19–24.
dicted haplotypes [for example, the region on chromo- Darvasi, A., andM. Soller, 1997 A simple method to calculate some 15 is reduced toⵑ3 cM (Figure 2)]. Assuming resolving power and confidence interval of QTL map location.
Behav. Genet.27:125–132.
pleiotropy, then, the number of loci contributing to the
DeFries, J. C., 1969 Pleiotropic effects of albinism on open field
phenotypes is small: Twelve would account for variation
behaviour in mice. Nature221:65–66.
in all the phenotypes measured. DeFries, J. C., andJ. P. Hegman, 1970 Genetic analysis of open-field behavior, pp. 23–56 inContributions to Behavior Genetic Analysis: The
Is the relatively simple genetic architecture a
conse-Mouse as a Prototype, edited by G.Lindzeyand D. D.Thiessen.
quence of the selection experiment? Theoretically, we
Appleton-Century-Crofts, New York.
expect that the selection process should have lost rela- DeFries, J. C., M. C. GervaisandE. A. Thomas, 1978 Response to
30 generations of selection for open field activity in laboratory
tively little genetic diversity. With 10 mating pairs in
mice. Behav. Genet.8:3–13.
each of the closed lines and within-litter selection, the
Doerge, R. W., andG. A. Churchill, 1996 Permutation tests for
expected increase in the coefficient of inbreeding is multiple loci affecting a quantitative character. Genetics 142: ⬍1.5%/generation (FalconerandMackay1996). Our 285–294.
Driscoll, P., andK. Battig, 1982 Behavioral, emotional and
neuro-simulation results give the probability (p) that a QTL
chemical profiles of rats selected for extreme differences in active
will go to fixation (Figure 1) and allow us to examine two way avoidance, pp. 95–123 inGenetics of the Brain, edited by whether the selection experiments are likely to produce I.Lieblich.Elsevier, Amsterdam.
Driscoll, P., C. Gentsch, M. LichtsteinerandH. Feer, 1987
Se-lines with different QTL. For QTL explaining⬎5% of
lection for extreme differences in 2-way avoidance—is anxiety
the variance this probability is low. The probability that and or depression involved. Int. J. Neurosci.32:503.
two replicate selected lines will become fixed for differ- Driscoll, P., R. M.Escorihuela,A.Fernandez-Teruel, O.Giorgi, H.Schwegleret al., 1998 Genetic selection and differential
ent QTL alleles is 2p(1⫺p). With a probability of
fixa-stress responses—the Roman lines/strains of rats. Ann. NY Acad.
tion of 0.996 (QTL explaining 5%), we would expect
Sci.851:501–510.
the replicated selection experiment to have resulted in Falconer, D. F., andT. F.C. Mackay, 1996 Introduction to Quantita-lines that do not share the same selected alleles in only tive Genetics. Longman, Harlow, UK.
Ferre, P., A. Fernandezteruel, R. M. Escorihuela, P. Driscoll,
0.8% of cases. For QTL explaining 2% of the variance
M. G. Cordaet al., 1995 Behavior of the Roman verh
high-the number increases to only 7%, but for very small avoidance and low-avoidance rat lines in anxiety tests— effect QTL (1%) the number increases to almost 20%. relationship with defecation and self-grooming. Physiol. Behav.
58:1209–1213.
Overall, our results indicate that selection has
oper-Flint, J., R. Corley, J. C. DeFries, D. W. Fulker, J. A. Grayet al.,
ated on the same number of loci in the four strains. 1995 A simple genetic basis for a complex psychological trait The resulting genetic architecture is relatively straight- in laboratory mice. Science269:1432–1435.
Jiang, C., and Z-B.Zeng, 1995 Multiple trait analysis of genetic
forward; the loci we identified contribute to most of the
mapping for quantitative trait loci. Genetics140:1111–1127.
genetic variance of the open-field behaviors (DeFries
Katz, R. J., andR. L. Doyle, 1981 The albino locus and locomotor
andHegman1970;Flintet al.1995). The exact nature behavior in the mouse: studies using extended test intervals.
Behav. Genet.11:167–172.
con-Kwon, B. S., A. K.Haq, M.Wakulchik, D.Kestler, D. E.Barton Hendleyet al., 1996 A major quantitative trait locus influences hyperactivity in the wkha rat. Nat. Genet.14:471–473.
et al., 1989 Isolation, chromosomal mapping, and expression
Risch, N., andD. Botstein, 1996 A manic depressive history. Nat. of the mouse tyrosinase gene. J. Invest. Dermatol.93:589–594.
Genet.12:351–353.
Lander, E. S., andD. Botstein, 1989 Mapping Mendelian factors
Risch, N., andK. Merikangas, 1996 The future of genetic studies underlying quantitative traits using RFLP linkage maps. Genetics
of complex human diseases. Science273:1516–1517.
121:185–199.
Thiessen, D. D., G. LindzeyandK. Owen, 1970 Behavior and allelic
Lassalle, J. M., andG. Le Pape, 1983 Measurements of the
behav-variations in enzyme activity and coat color at the C locus of the ioral effects of albino mutation in mice (Mus musculus):
compari-mouse. Behav. Genet.1:257–267. sons of coisogenic inbred and hybrid lines. J. Comp. Psychol.97:
Turri, M. G., C. J. Talbot, R. A. Radcliffe, J. M. WehnerandJ.
353–357.
Flint, 1999 High-resolution mapping of quantitative trait loci
Liebsch, G., A. C. E. Linthorst, I. D. Neumann, J. Reul, F. Holsboer
for emotionality in selected strains of mice. Mamm. Genome10:
et al., 1998a Behavioral, physiological, and neuroendocrine
1098–1101. stress responses and differential sensitivity to diazepam in two
Uhl, G. R., L. H. GoldandN. Risch, 1997 Genetic analyses of Wistar rat lines selectively bred for high- and low-anxiety-related
complex behavioral disorders. Proc. Natl. Acad. Sci. USA94:
behavior. Neuropsychopharmacology19:381–396.
2785–2786.
Liebsch, G., A. Montkowski, F. HolsboerandR. Landgraf, 1998b
Utz, H. F., andA. E. Melchinger, 1994 Comparison of different Behavioural profiles of two Wistar rat lines selectively bred for
approaches to interval mapping of quantitative trait loci, pp. high or low anxiety-related behaviour. Behav. Brain Res.94:301–
195–204 inBiometrics in Plant Breeding: Applications of Molecular
310.
Markers, edited by J. W.Van Ooijenand J.Jansen.Proceedings
Lincoln, S., M. DalyandE. Lander, 1992 Mapping genes
control-of the Ninth Meeting control-of the EUCARPIASection Biometrics in ling quantitative traits with MAPMAKER/QTL 1.1. Whitehead
Plant Breeding, Wageningen, The Netherlands. Institute Technical Report, Cambridge, MA.
Van Etten, W. J., R. G. Steen, H. Nguyen, A. B. Castle, D. K. McCarthy, L. C., M. T. Bihoreau, S. L. Kiguwa, J. Browne, T. K.
Slominet al., 1999 Radiation hybrid map of the mouse genome.
Watanabeet al., 2000 A whole-genome radiation hybrid panel Nat. Genet.22:384–387.
and framework map of the rat genome. Mamm. Genome11: Watanabe, T. K., M. T. Bihoreau, L. C. McCarthy, S. L. Kiguwa,
791–795. H. Hishigakiet al., 1999 A radiation hybrid map of the rat
Melchinger, A. E., H. F. UtzandC. C. Schon, 1998 Quantitative genome containing 5,255 markers [see comments]. Nat. Genet. trait locus (QTL) mapping using different testers and indepen- 22:27–36.
dent population samples in maize reveals low power of QTL Zeng, Z-B., 1994 Precision mapping of quantitative trait loci. Genet-detection and large bias in estimates of QTL effects. Genetics ics136:1457–1468.
149:383–403.