ABSTRACT
PALMER, JEREMY CORD. Modeling Disordered Nanoporous Carbons Using Reactive Force Fields. (Under the direction of Keith E. Gubbins.)
Disordered nanoporous carbons (DNCs) are amorphous materials that have characteristic pore sizes less than 2 nm in diameter and can be synthesized from a wide variety of inexpensive and abundant carbonaceous precursors such as woods, coals, polymers and crystalline carbides. Guest phases contained within the nanoscopic pores of these materials experience a number of confinement effects that can alter phase behavior, chemical equilibria, reaction rates and mechanisms, and transport properties. These effects may be tuned by modulating the structural features, such as porosity, pore size and surface area, of the DNCs through judicious choice of the precursor material and synthesis conditions. As a result, these materials have found use in disparate applications, such as gas and electrolyte storage, gas and fluid purification and as catalysts and catalyst supports, where confinement effects lead to enhanced performance.
Modeling Disordered Nanoporous Carbons Using Reactive Force Fields
by
Jeremy Cord Palmer
A dissertation submitted to the Graduate Faculty of North Carolina State University
in partial fulfillment of the requirements for the Degree of
Doctor of Philosophy
Chemical Engineering
Raleigh, North Carolina 2011
APPROVED BY:
_______________________________ ______________________________
Keith E. Gubbins Carol K. Hall
Dedication
Biography
Jeremy Cord Palmer was born on October 26, 1983 in Toledo, Ohio, to his parents Teresa Ann and James Fred Palmer. A little more than two and a half years later, on July 3, 1986, Jeremy’s sister, Randahl Christelle Palmer, was born. Jeremy grew up with his family in Sylvania, Ohio, and later in Southeast Michigan. He started his formal education at age five at the West Side Montesorri School of Toledo and continued there for grades K-4 . At age 11, he attended 5th grade at Smith Road Elementary School in Bedford, Michigan, and from age 12 to14 he attended Bedford Junior High School. At age fourteen, Jeremy was accepted to the St. Francis de Sales college preparatory high school in Toledo, which he attended until graduation in the spring of 2002. In addition to his academic pursuits, Jeremy swam competitively throughout his youth and won numerous state titles throughout his swimming career.
from the university and both departments associated with his majors. During his time at Johns Hopkins, Jeremy was also heavily involved in student mentorship and participated in numerous related organizations. Immediately following graduation, he took on the position of teaching assistant with the Investigations in Engineering program at the Center for Talented Youth at the Johns Hopkins University, where he taught and mentored gifted youth.
Acknowledgements
I want to first thank my advisor and mentor, Keith E. Gubbins. Throughout my doctoral studies, he has always been there to offer his guidance and support. I am particularly grateful for the autonomy that he has allowed me in pursuing my own research interests, while offering his wisdom in order to help me realize my objectives. He has also relentlessly sought to ensure that I have had the best professional opportunities available, including many travels abroad and chances to attend conferences, meetings with world-renowned experts in related fields, and the opportunity to develop research proposals and teach. On a more personal note, it has been an immense pleasure to be under his mentorship over the last five years. He is a fine gentleman of exceptional character, and the persistence of his enthusiasm and kindness has helped me persevere and move forward even in times of adversity. I am very thankful to Keith for giving me the opportunity to work in his group, his support and advice, and his friendship.
Table of Contents
List of Tables ... ix
List of Figures ... x
Chapter 1. An Introduction to Modeling Disordered Nanoporous Carbons Using Reactive Force Fields... 1
1.1 Introduction... 1
1.2 The Structure on Different Length Scales ... 4
1.3 Constitutive Models... 8
1.4 Reactive Chemistry Methods... 11
1.4.1 Classical Reactive Force Fields ... 12
1.4.2 Quench Molecular Dynamics ... 16
1.4.3 Hybrid Reverse Monte Carlo... 25
1.5 Conclusions... 41
Chapter 2. Detailed Structural Models for Activated Carbons from Molecular Simulation .. 44
2.1 Introduction... 44
2.2 Experimental Methods ... 47
2.2.1 X-ray Diffraction ... 47
2.2.2 Adsorption Measurements ... 48
2.3 Theoretical Methods ... 48
2.3.1 The Hybrid Reverse Monte Carlo Method ... 48
2.3.2 Generation of the Model ... 49
2.3.3 Structural Characterization ... 51
2.3.4 Simulated Adsorption Isotherms... 52
2.4 Results and Discussion ... 55
2.4.1 Details of the Microstructure ... 55
2.4.2 Pore Size Distribution and Specific Surface Area ... 58
2.4.3 Adsorption Equilibrium ... 61
2.5 Conclusions... 67
Chapter 3. Modeling the Structural Evolution of Carbide-Derived Carbons Using Quench Molecular Dynamics... 68
3.1 Introduction... 68
3.2 Methods... 70
3.2.1 Quench Molecular Dynamics Simulations ... 70
3.2.2 Grand Canonical Monte Carlo Simulations... 71
3.2.3 CDC Synthesis and Neutron Scattering Measurements... 72
3.3.4 Adsorptive Properties... 83
3.4 Conclusions... 87
Chapter 4. Adsorption and Diffusion of Argon in Disordered Nanoporous Carbons ... 89
4.1 Introduction... 89
4.2 Computational Methods... 93
4.2.1 Carbon Model Generation... 93
4.2.2 Grand Canonical Monte Carlo Simulations... 93
4.2.3 Molecular Dynamics Simulations... 95
4.3 Results and Discussion ... 96
4.3.1 Structural and Morphological Features... 96
4.3.2 Adsorptive Behavior ... 101
4.3.3 Dynamic Behavior ... 105
4.4 Conclusions... 113
Chapter 5. Adsorptive Behavior of CO2, CH4 and Their Mixtures in Carbon Nanospace: A Molecular Simulation Study ... 114
5.1 Introduction... 114
5.2 Nanoporous Carbon Models ... 117
5.3 Computational Methods... 120
5.3.1 Grand Canonical Monte Carlo Simulations... 120
5.3.2 Calculation of Absolute and Excess Quantities ... 121
5.3.2.1 Adsorption Isotherms... 122
5.3.2.2 Isosteric Heats of Adsorption... 123
5.4 Results and Discussion ... 125
5.4.1 Optimization of Slit Pores and SWCNT Bundles... 125
5.4.2 Pure Component Adsorption... 131
5.4.3 Mixture Adsorption... 137
5.5 Conclusions... 143
Chapter 6. Simulating Local Adsorption Isotherms in Structurally Complex Porous Materials: A Direct Assessment of the Slit-Pore Model... 145
6.1 Introduction... 145
6.2 Calculation of Pore Size Maps... 148
6.3 Results and Discussion ... 149
6.4 Conclusions... 157
Chapter 7. Conclusions and Future Research Directions... 158
List of Tables
Table 1.1 Relative computational efficiencies and a list of features for several reactive force fields for carbon, including the reactive summation state (RSS) force field80, the Tersoff70, 71 force field, the second-generation reactive empirical bond order74 (REBO II) and adaptive intermolecular REBO73 (AIREBO) force fields, and the general purpose reactive force field, ReaxFF77, 78. The
efficiencies reflect the relative amounts of computational time required to perform 104 0.5 fs timesteps in microcanonical (NVE) MD simulations of a graphene sheet containing 680 carbon atoms on a single-core 2.8 GHz Intel Xenon processor with the LAMMPS simulation packaged79. Initial velocities of the carbon atoms in the MD simulations were randomly drawn from a Maxwell-Boltzmann distribution at 300 K. The efficiencies were computed from the average of five simulations with each force field and are normalized such that the force field with the fastest average wall-clock time has an efficiency of 1.0. The features list includes the hybridization states of carbon captured by the force fields and also the different types of interactions they incorporate. ... 14 Table 2.1 Lennard-Jones parameters used in this study... 54 Table 2.2 Bonding characteristics and ring statistics. Where appropriate, values are
List of Figures
Figure 1.1 The structure of DNCs as viewed on different length scales. (a) On the local atomic scale, carbon atoms bond to form aromatic ring structures. (b) Aromatic ring structures constitute defective graphene nanocrystals, which give rise to intermediate-range structural order. (c) The nanocrystals form orientationally-disordered domains that encompass micro- and meso-porous features. (d) A TEM image adapted from Ref.14 of a carbon nanoparticle edge from a DNC synthesized at 600 °C from electrospun TiC nanofibers showing the nanocrystals (black lines) and the absence of structural order on the mesoscale. Although some ordered carbon fringes are seen in the interface, the bulk appears completely amorphous. (e) A TEM image of the same carbon showing an aggregate of tubule-shaped nanoparticles. (f) A photograph of a bituminous coals-based carbon (BPL) that illustrates the powdered appearance of DNCs on the macroscale. ... 5 Figure 1.2 Examples of constitutive models for DNCs. (a) The slit-pore model. (b) The
isotropic platelet model of Segarra and Glandt36. (c) The hierarchical virtual porous carbon (VPC) model of Biggs and Argawal33. (d) The fullerene
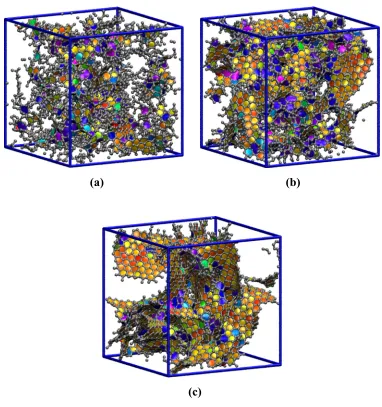
fragment of Harris 34 [adapted from Ref. 59]... 9 Figure 1.3 Snapshots of three DNC structures obtained from QMD simulations at relative
quench rates of (a) 32, (b) 8 and (c) 1. Grey beads and cylinders represent center of mass positions of carbon atoms and C-C bonds, respectively.
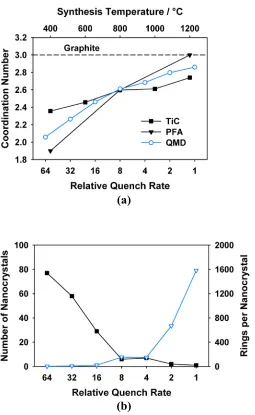
Aromatic rings of different sizes and shapes have different shadings... 18 Figure 1.4 (a) Average coordination numbers for QMD models (open circles) produced
at different relative quench rates. The coordination numbers measured by neutron diffraction experiments for DNCs derived from titanium carbide (TiC, squares)30 and poly(furfuryl alcohol) (PFA, triangles)47 at different synthesis temperatures are also shown. The dashed reference line shows the
coordination number for graphite (i.e., 3.0). (b) The number of nanocrystals (squares) and the average number of aromatic carbon rings per nanocrystal (triangles) for QMD models produced at different relative quench rates... 20 Figure 1.5 Simulated adsorption isotherms for Ar at 87.3 K on the QMD models
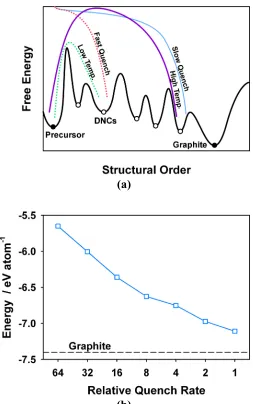
Figure 1.6 (a) A free energy landscape diagram illustrating the metastable nature of DNCs and the connection between the quench rate used in QMD simulations and the experimental synthesis temperature. (b) The depths of the metastable basins on the 0 K FES obtained by energy minimization of the QMD models using the conjugate gradient method with the AIREBO73 force field. The dashed reference line shows the depth of the basin for graphite (-7.4 eV/atom). ... 24 Figure 1.7 Radial distribution functions of the target QMD structure and the RMC and
HRMC models. The three RDFs are nearly identical, and indicate that the models are locally ordered and have an absence of structural coherence
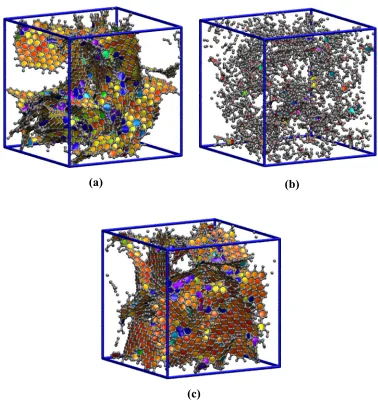
beyond ~0.8 nm. The lines are offset by 2 for clarity... 30 Figure 1.8 Reconstruction of a DNC model using the RMC and HRMC methods. (a) The
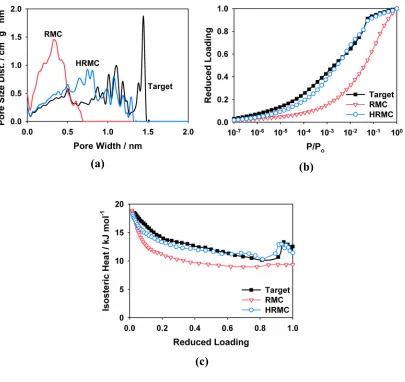
target model used for the reconstruction, which was produced with the QMD method using a relative quench rate of 1. The RMC,(b) and HRMC,(c), reconstructions of the target model in (a), respectively. Grey beads and cylinders represent center of mass positions of carbon atoms and C-C bonds, respectively. Aromatic rings of different sizes and shapes have different shadings... 31 Figure 1.9 (a) Pore size distributions of the target and reconstructed models calculated
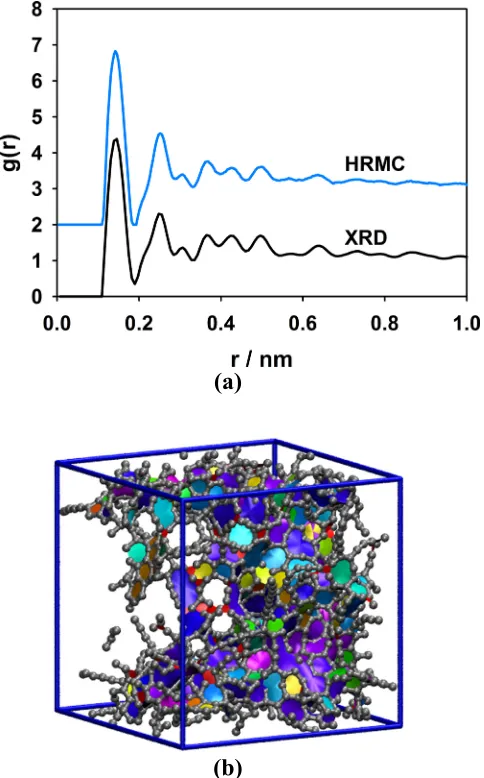
using the method of Gelb and Gubbins109. (b),(c) The simulated adsorption isotherms and isosteric heats of adsorption for Ar at 87.3 K, respectively. ... 33 Figure 1.10 (a) Radial distribution functions for BPL (from XRD) and the HRMC model.
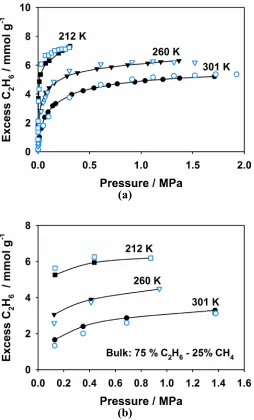
The lines are offset by 2 for clarity. (b) Simulation snapshot of the HRMC model... 36 Figure 1.11 Simulated and experimental adsorption isotherms for the HRMC model and
BPL carbon, respectively. (a) Pure component isotherms for C2H6 at 212, 260 and 301 K. (b) Co-adsorption isotherms for C2H6 from a bulk mixture
containing 75 % C2H6 and 25% CH4 at the same three temperatures. Open and closed symbols results from simulation and experiment, respectively. The experimental data was taken from Ref.112... 38 Figure 1.12 The sets of unique structures that can be generated with the RMC, CRMC and
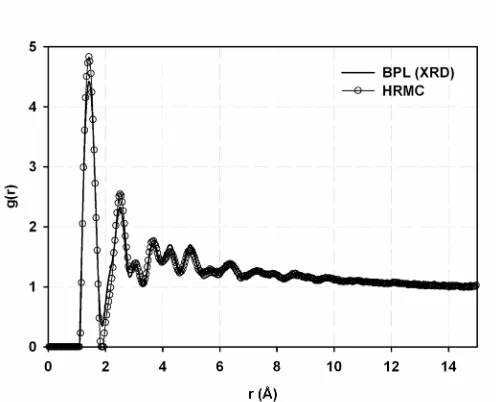
Figure 2.1 Radial distribution functions for BPL (from XRD) and the HRMC-generated model... 55 Figure 2.2 (a) A molecular snapshot of the model for BPL illustrates the highly
amorphous nature of the material. Spheres and cylinders are carbon atoms and carbon-carbon bonds, respectively. (b) Five representative graphene
microcrystals identified by color in the BPL model using ring connectivity analysis. Their respective locations can be directly mapped onto the larger structure on the left by superimposing the unit cells. ... 58 Figure 2.3 The pore size distribution for the BPL sample estimated using QSDFT and
the geometric and QSDFT distributions for the HRMC-generated model. The geometric PSD shows small pores (< 2.5 Å) that are inaccessible to nearly all adsorbate molecules... 59 Figure 2.4 Simulated and experimental nitrogen adsorption isotherms for the HRMC
model and the BPL sample, respectively... 62 Figure 2.5 Carbon dioxide adsorption isotherms at 212.7 K (squares), 260.2 K (triangles)
and 301.4 K (circles) for the BPL sample and the HRMC model. Filled symbols with lines are the experimental data taken from Reich et al. and unfilled symbols are predictions of the model... 63 Figure 2.6 Methane adsorption isotherms at 212.7 K (squares), 260.2 K (triangles) and
301.4 K (circles) for the BPL sample and the HRMC model. Filled symbols are experimental data taken from Reich et al., dashed lines are Toth fits (see Eq. (2.9)) to the experimental data and unfilled symbols are predictions of the model... 64 Figure 2.7 Isosteric heats of adsorption for methane. Filled symbols are estimates from
experimental measurements and unfilled symbols are predictions of the
HRMC model... 66 Figure 3.1 Carbon radial distribution functions for three representative QMD-generated
structures... 74 Figure 3.2 First neighbor coordination number as a function of relative quench rate
(simulation) and chlorination temperature (experiment). ... 76 Figure 3.3 Comparison of experimental HRTEM images (left column), simulated
HRTEM images (center column) and snapshots of the model structures (right column). Each images has been scaled such that the edge length corresponds to 4 nm. (a) HRTEM images of Ti-CDC synthesized at 600°C and QMD structure quenched at 64x, respectively. (b) Same as (a) except for 800°C and 8x. (c) Same as (a) except for 1200°C and 1x. ... 78 Figure 3.4 Geometric PSDs for four representative QMD-generated structures. ... 80 Figure 3.5 Average pore size as a function of relative quench rate (simulation) and
Figure 3.6 Specific surface area as a function of relative quench rate (simulation) and chlorination temperature (experiment). Experimental results taken from Dash et al. 4. ... 82 Figure 3.7 Argon adsorption isotherms at 77 K for QMD-generated structures... 84 Figure 3.8 Same as Figure 3.7 but on a log-scale to show the low-pressure region. ... 84 Figure 3.9 Zero-coverage isosteric heats of adsorption of argon at 77 K for the
QMD-generated structures. ... 87 Figure 4.1 Snapshots of three nanoporous carbon structures obtained from quench
molecular dynamics simulations at relative quench rates of (a) 64, (b) 8 and (c) 1 . Grey beads and cylinders represent center of mass positions of carbon atoms and C-C bonds, respectively... 97 Figure 4.2 Total geometric pore size distributions calculated using the method of Gelb
and Gubbins109 for the simulated nanoporous carbons... 98 Figure 4.3 Adsorption isotherms of argon at 87.3 K (closed symbols) and 120 K (open
symbols) for the three nanoporous carbon structures. ... 101 Figure 4.4 Isosteric heats as a function of the reduced loading (Г/ Гo) for argon at 87.3 K
in the three nanoporous carbon structures. ... 103 Figure 4.5 Zero-coverage solid-fluid potential energy distributions for argon at 87.3 K
on the three nanoporous carbon models... 105 Figure 4.6 Mean-square displacement of argon in the three nanoporous carbons at 87.3K:
(a) Q1, (b) Q8, (c) Q64. Reference lines (dotted) illustrating t1 and t1/2
dependence are also shown... 108 Figure 4.7 Mean-square displacement of argon in the three nanoporous carbons at 120K:
(a) Q1, (b) Q8, (c) Q64. Reference lines (dotted) illustrating t1 and t1/2
dependence are also shown... 109 Figure 4.8 Mean-square displacement of argon in the three nanoporous carbons at 87,
300, 500, and 1000K at approximately 70 % loading: (a) Q1, (b) Q8, (c) Q64. Reference lines (dotted) illustrating t1 and t1/2 dependence are also shown. . 112 Figure 5.1 Atomistic renderings of the four types of carbon structures examined in this
study with CH4 and CO2 adsorbed from an equimolar bulk phase mixture at 0.1 MPa and 300 K. (a) SP H = 0.61 nm (w = 0.95 nm); (b) (8,8) SWCNT bundle; (c) 2×2×2 C-FAU supercell; (d) AC. The carbon framework is represented as small beads (silver) connected by cylinders (silver), while CH4 (pink) and CO2 (red and blue) are represented by a single bead and three collinear beads, respectively. ... 119 Figure 5.2 Adsorption selectivity of an equimolar bulk mixture at 300 K calculated from
the absolute adsorption isotherms as a function of pore width and pressure.127 Figure 5.3 (a) Total pore size distributions of the SWCNT bundles calculated with a
Figure 5.4 Total pore size distributions of the H=0.61 nm SP, C-FAU and AC calculated with a mesh resolution of 0.01 nm using the method of Gelb and Gubbins109. ... 132 Figure 5.5 Adsorption isotherms at 300 K for (a) CH4 and (b) CO2 on the H=0.61 nm SP,
(8,8) SWCNT bundle, C-FAU and AC. Filled and open symbols denote absolute and excess isotherms, respectively. ... 134 Figure 5.6 Isosteric heats of adsorption at 300 K for (a) CH4 and (b) CO2 on the H=0.61
nm SP, (8,8) SWCNT bundle, C-FAU and AC. Filled and open symbols denote calculations using Eqs. (5.4) and (5.5), respectively... 135 Figure 5.7 Coadsorption isotherms for (a) CH4 and (b) CO2 from an equimolar bulk
mixture at 300 K on the H=0.61 nm SP, (8,8) SWCNT bundle, C-FAU and AC. Filled and open symbols denote absolute and excess amounts adsorbed, respectively. ... 138 Figure 5.8 Isosteric heats of adsorption for (a) CH4 and (b) CO2 from an equimolar bulk
mixture at 300 K on the H=0.61 nm SP, (8,8) SWCNT bundle, C-FAU and AC. Filled and open symbols denote calculations using Eqs. (5.4) and (5.5), respectively. ... 139 Figure 5.9 Adsorption selectivity of the H=0.61 nm SP, (8,8) SWCNT bundle, C-FAU
and AC for a (a) 75/25 mol %, (b) 50/50 mol% and (c) 25/75 mol % mixture of CO2 / CH4 at 300 K. Filled and open symbols denote selectivites calculated from absolute and excess isotherms, respectively. ... 142 Figure 6.1 (a) (left panel) Simulation snapshot of the NPC with N2 and CO2 adsorbed
from an equimolar bulk mixture at 300 K and 20 bar. (right panel) Pore size map highlighting the voxels in the NPC framework where the local pore size is within ± 0.1 Å of the specified value (denoted by color). (b) The total pore size distribution of the NPC framework, with contributions of the 3.5, 7.5 and 11.1 Å sized pores shaded in blue, green and pink, respectively... 150 Figure 6.2 Adsorption isotherms for Ar at 87.3 K for pore sizes of (a) 3.5, (b) 7.5 and (c)
11.1 Å. Filled circles and squares are adsorption isotherms calculated for the independent carbon SP and SP-H models, respectively, while open triangles indicate local, pore-size specific isotherms in the NPC that were calculated from the number of Ar molecules occupying the voxels where the local pore size was within ± 0.1 Å of the specified value. The fractional loadings were calculated by normalizing each isotherm by its value at the saturation pressure of Ar. Isotherms for the NPC model were obtained by averaging the results of 5 statistically independent simulations. Symbol sizes are larger than the
estimated uncertainties... 153 Figure 6.3 Carbon dioxide adsorption selectivity from an equimolar bulk mixture of N2
and CO2 at 300 K as a function of bulk pressure and pore size in (a) independent carbon SPs and (b) the NPC model. The results in (b) were calculated from 15 statistically independent simulations. (c) Estimated
Chapter 1
An Introduction to Modeling Disordered Nanoporous Carbons Using
Reactive Force Fields
i1.1
Introduction
Disordered nanoporous carbons (DNCs) are highly heterogeneous materials that are synthesized from carbonaceous precursors such as woods, coconut shells, coals, polymers and crystalline carbides1-3. Due to their predominately micro- and meso-porous features and large specific surface areas, DNCs have shown exceptional performance in applications ranging from gas- and liquid-phase separations to microelectronics1-3. They are also key components in numerous technologies aimed at emissions reduction, environmental remediation and energy storage2, 4. At the industrial scale, DNCs are widely used as adsorbents for reducing the presence of hazardous substances, such as volatile organic compounds, dioxins and sulfates from effluents2. They also serve as reactive adsorbents, catalysts and catalyst supports for the degradation of gas-phase pollutants such as sulfides, NOx compounds and ammonia5-7. DNC-based filtration systems also play a critical role in the removal of biological contaminants, lead, mercury and arsenate from waste and drinking water8-10. Recent attention has been drawn to DNCs because of their use as electrodes in supercapacitor technologies11-14 and as materials for gas storage15-18.
guide their synthesis and application12. Development of such guidelines for porous materials requires a complete understanding of the relationship between their nanostructure and functional properties. Achieving this level of understanding for DNCs is extremely challenging because their heterogeneous structures are notoriously difficult to characterize2, 3. Efforts to fine-tune DNC-based technologies have employed an Edisonian approach where precursors, synthesis conditions and post-synthesis procedures are varied in a combinatorial fashion to produce carbons with suitable performance characteristics12. While this approach has gained some traction, its inherently slow and expensive nature poses a significant hindrance to the rapid development of new technologies. It also does not provide the insight necessary to expand the role of DNCs in disparate applications.
Over the last two decades, numerous structural models for DNCs have been proposed33-36. One feature common among many of these models is that they are constructed from elementary building blocks, or constituent pieces, such as aromatic carbon rings and graphene fragments of various sizes and shapes. Although the approaches are conceptually similar, they generally differ in their choice of constituents and the algorithms used to combine them. Constitutive models have been successful in capturing many aspects of real DNCs, including their variable pore sizes and morphology and pore-connectivity. They have also provided valuable insights into the structure-function relationship and contributed substantially to understanding the effect of confinement on phase equilibria1, 37 and transport33, 38 in DNCs. The major factor limiting the predictive capabilities of these models is that they assume significant prior knowledge of the carbon chemistry and nanostructure.
to demonstrate their utility in modeling DNCs. We also discuss the current limitations of these methods and potential avenues for improving their predictive capabilities. Finally, in Section 1.5 we summarize and discuss future outlooks.
1.2
The Structure on Different Length Scales
On the local atomic scale, wide-angle XRD and ND methods have continued to play a vital role in understanding the structure of DNCs. Scattering at wide angles arises from constructive and destructive interference of X-rays or neutrons from individual carbon atoms, providing significant information about the local atomic and intermediate-range structural order31. Modern scattering studies suggest that DNCs are highly crystalline on the local atomic level and typically have a narrow distribution of C-C bond lengths ranging from ~0.135-0.150 nm, with the average being close to the 0.142 nm found in graphite29, 47-49. Recent results also support early findings and indicate that DNCs are composed of connected aromatic ring structures that form small graphene nanocrystals (Figure 1.1(b)). In addition to hexagonal rings, it is also widely believed that they may contain pentagonal and other ring structures (e.g., Figure 1.1 (a)) that give rise to distortion of the nanocrystals29, 47, 49. Elemental analysis of DNCs has confirmed that they also contain heteroatoms, such as O, N, S, and H. The prevalence of particular types of heteroatoms depends on the precursor material and synthesis conditions, but it is generally thought that they are involved in creating local chemical defects and forming functional groups that decorate the edges of the nanocrystals2, 21, 50.
as observed in graphite30, 47. In contrast, DNCs synthesized at higher temperatures (>1200 °C) have more ordered nanostructures. The increase in synthesis temperature is accompanied by an increase in the coordination number to ~2.7-3.0 and the persistence of the structural coherence to longer length scales. This indicates the formation of larger nanocrystals up to several nanometers in size30, 47. Evidence from ND and TEM images of DNCs produced at higher temperatures also suggests the formation of graphitic domains4, 30, 47.
The irregular packing of nanocrystals in DNCs gives rise to disordered structural domains and a variety of porous features (Figure 1.1 (c)). Since most of the pores can be accessed by small gas molecules such as He, Ar, N2 and CO2, several methods have been proposed to estimate the pore size distribution (PSD) of DNCs from adsorption isotherms51-54. The PSDs show that disordered carbons may contain pores ranging from less than one nanometer to several hundred nanometers in size, with typically more than half of the total pore volume residing in sub-2 nm micropores51. The micropores give DNCs many of their characteristic functional properties and have traditionally been thought to have a slit-like morphology based on the assumption that they form between domains of stacked nanocrystals52. However, the large variations in the intermediate-range order between different materials suggest that the pore morphology may also vary dramatically and take on highly irregular shapes. Although little is known directly from experiment, the pores in DNCs are also thought to be highly connected and form complex networks21.
contain the lattice fringes constitute only small fractions of single nanoparticles, which in turn form clusters (microparticles) on the micron length scale (Figure 1.1 (e)). These particles have a wide range of sizes and shapes that may be influenced by the structure of the precursor material56. The particulate nature of DNCs persists on larger length scales, which can be observed with scanning electron microscopy and other imaging techniques56. This remains unchanged even on visible lengths scales, where DNCs resemble charcoal and appear as powdered substances composed of macroparticles (Figure 1.1 (f)).
1.3
Constitutive Models
In an effort to capture the heterogeneous porous features, Segarra and Glandt36 modeled DNCs as an isotropic collection of identical nanocrystals. Their so-called platelet model (Figure 1.2 (b)) assumes that the nanocrystals are cylindrical in shape and composed of two perfectly stacked graphene layers, giving them a thickness of 0.335 nm. Model DNCs are constructed using a Monte Carlo (MC) procedure to arrange the platelets in non-overlapping configurations in a periodic simulation cell. The final structures are composed of loosely-packed platelets with different relative orientations and interconnected porous features that are irregularly shaped. Using grand canonical Monte Carlo (GCMC) simulations, Segarra and Glandt36 studied the adsorption of methane and ethane on several different realizations of the platelet model composed of identical platelets with diameters of 0.5, 0.75 and 1.0 nm, respectively. They found that the amount of each gas adsorbed increased with the diameter of the nanocrystals, since the models composed of larger platelets had greater accessible surface areas for adsorption. In their initial study, they also compared the simulated isotherms with experimental measurements on an activated bituminous coal-based carbon, BPL. Mixed agreement with experiment was found and attributed to the fact that the crystalline platelets were not heterogeneous enough to describe the nanostructure of real DNCs. However, Liu and Monson60 later revised the model by matching the thickness, diameter and mean packing density of the platelets to structural data for the BPL carbon and found that it accurately predicted the adsorption isotherms of methane and ethane mixtures. They also showed that the revised model predicted water isotherms on BPL when polar functional groups were added along the edges of the nanocrystal platelets61.
blocks that consist of small domains of stacked graphene nanocrystals, as shown in Figure 1.2 (c). These nanocrystals have various shapes and sizes and may also contain chemical defects and functional groups. The building blocks are seated on a large lattice, up to 100 nm in length, to form models with a variety of structural and porous features. The approach of Biggs and Agarwal33, 38 is rather general, placing few restrictions on the types of the building blocks that may be used. It also allows for the impact of different structural features on adsorption and transport to be systematically investigated.
Based on the tortuous appearance of TEM lattice fringes, Harris and Tsang34 proposed a model consisting of fullerene-like fragments. In addition to the hexagonal aromatic rings found in graphene, fullerene fragments also contain pentagonal and heptagonal rings that add curvature to the nanocrystals. Models are generated from these fragments using a MC method similar to the one used by Segerra and Glandt 36, in which the nanocrystals are randomly displaced and rotated to produce non-overlapping arrangements (Figure 1.2 (d)). Terzyk et al.37, 59, 62 have successfully used these models to gain insight into gas- and liquid-phase adsorption in DNCs. They have also been used to test the reliability of various methods that are used to estimate the PSDs of disordered carbons63. Another recent example is the model of Herrera et al.35, which uses a combination of benzene rings and graphite fragments to describe the amorphous and crystalline phases of char. They used a MC method along with a thermal annealing procedure to build models by heating mixtures of the two components to different temperatures in order to mimic the experimental carbonization process. Their mimetic procedure was able to capture the increase in pore volume, density and surface area of real chars synthesized at progressively higher temperatures.
constitutive models may be found in Refs. 21, 38. These few examples demonstrate that a number of elementary building blocks can be incorporated into models. However, in spite of the fact that similar features may exist in real disordered carbons, there are no rigorous guidelines to suggest how these elements should be combined. In the following sections, we focus on two methods that have been developed to build DNC models from the ground up, using only single carbon atoms as basic building blocks. Different structural elements in the models are predicted using methods that dynamically describe the formation and disassociation of chemical bonds between carbon atoms during the simulations.
1.4.1
Classical Reactive Force Fields
In the late 1980s and early 1990s, the first generation of reactive force fields were developed for carbon based on the Abell-Tersoff-Brenner69-72 bond-order formalism, in which the atomic pair potential uij is written as,
( ) ( ) ( )
ij ij rep ij ij att ij
u r =u r +b u r (1.1)
The functions urep and uatt are the repulsive and attractive contributions to the pair potential, respectively, and are dependent on the separation distance between atoms, rij. The many-body coupling,bij, takes into account the local chemical environment of the atoms using their coordination numbers and the bond- and torsion-angles they form with their neighbors. The first-generation force fields based on Eq.(1.1)71, 72 have been parameterized from experimental bond lengths and bond energies for graphite, diamond, and small hydrocarbon molecules, and include both short-range two-body forces and three-body interactions (bond-angle constraints). Despite their simplistic treatment of the many-body interactions, these force fields show remarkable transferability and are able to predict reactions in many systems that are outside of their training sets. However, the demand for greater accuracy and transferability led to the development of a second generation of reactive force fields in the early 2000s73-77. Many of these second-generation force fields also include explicit four-body interactions by constraining torsion-angles in bonded sets of atoms. Some of them also incorporate long-range van der Waals (vdW) forces that are important in modeling small molecules and materials such as graphite. Force fields such as ReaxFF77, 78 have achieved greater transferability by using first-principles calculations to parameterize more flexible bond-order schemes that can describe reactions involving several chemical species.
transferable force fields are generally more computationally intensive, since they describe the carbon chemistry in greater detail. Benchmarks of several reactive force fields obtained from molecular dynamics (MD) simulations of a single sheet of graphene using the LAMMPS simulation package 79 are shown in Table 1.
Table 1.1 Relative computational efficiencies and a list of features for several reactive force fields for carbon, including the reactive summation state (RSS) force field80, the Tersoff70, 71 force field, the second-generation reactive empirical bond order74 (REBO II) and adaptive intermolecular REBO73 (AIREBO) force fields, and the general purpose reactive force field, ReaxFF77, 78. The efficiencies reflect the relative amounts of computational time required to perform 104 0.5 fs timesteps in microcanonical (NVE) MD simulations of a graphene sheet containing 680 carbon atoms on a single-core 2.8 GHz Intel Xenon processor with the LAMMPS simulation packaged79. Initial velocities of the carbon atoms in the MD simulations were randomly drawn from a Maxwell-Boltzmann distribution at 300 K. The efficiencies were computed from the average of five simulations with each force field and are normalized such that the force field with the fastest average wall-clock time has an efficiency of 1.0. The features list includes the hybridization states of carbon captured by the force fields and also the different types of interactions they incorporate.
Force field Ref. # Efficiency Features
Hybridization
States Interaction Types
sp2 sp3 3-body 4-body vdW Electrostatic
RSS 80 1.0 9 9
Tersoff 70, 71 1.4 9 9 9
REBO II 74 3.9 9 9 9
AIREBO 73 10.1 9 9 9 9 9
ReaxFF 77, 78 34.3 9 9 9 9 9 9
be used to model DNCs that are partially graphitized since it lacks long-range vdW forces. The AIREBO force field, which incorporates vdW interactions, is roughly an order of magnitude slower than the RSS potential, while ReaxFF is more than 30 times more computationally expensive due to its inclusion of polarizable electrostatic interactions and vdW forces. To put this into perspective, a 10 ns QMD simulation with the RSS potential using eight 2.8 GHz Intel Xenon processor takes approximately two days to complete for a modest system size of only 4,000 carbon atoms. If the same scaling holds for all the force fields, this simulation system would take nearly twenty days if the AIREBO force field were used, and more than two months with ReaxFF. Fortunately, MD methods can be efficiently parallelized to significantly reduce these times. On the other hand, HRMC simulations are inherently serial calculations and usually perform poorly in parallel. Using the efficiencies in Table 1, it is estimated that a typical serial HRMC simulation of 4,000 carbon atoms could take up to nine months with ReaxFF, which is too long for most practical applications.
1.4.2
Quench Molecular Dynamics
Mimetic methods produce structural models for materials by employing simulation protocols that replicate the experimental synthesis procedures. For a method to be truly mimetic, it must start with a realistic representation of the precursor material and subsequently simulate all of the synthesis steps to arrive at a final model. Unfortunately, modeling DNCs with such an approach is presently not possible since many aspects of the synthesis pathways are poorly understood. There is also a significant challenge in overcoming the disparity between the synthesis time scales and those currently accessible with molecular simulation. Alternatively, a pseudo-mimetic approach follows a different route to achieve the same physical transformations that occur during synthesis.
The QMD method was first applied to carbon systems in the 1990s when it was used to investigate the growth of metastable thin films of amorphous carbons produced by vapor deposition84. These films are generally nonporous and contains mostly sp3-hybridzed carbon atoms, since they have densities close that of diamond (3.52 g/cm3)85. Wang et al.68 performed simulations with a tight-binding potential in which systems of 512 atoms were quenched from the liquid phase into disordered solids with densities ranging from1.25 to 4.0 g/cm3. Although some small cavities were observed at lower-densities, their model systems were too small to contain large micropores. Shi80 subsequently used the QMD method with the RSS force field to quench systems of several thousand carbon atoms from the vapor phase at ~15,000 K. The resulting models were large enough to capture the full range of microporous features found in DNCs, containing pores up to 2 nm in size. Shi also compared the model structures with XRD measurements taken at 300 K on several carbons derived from saccharose cokes. He found that a final quench temperature of ~6,600 K was needed to achieve satisfactory agreement with the XRD measurements, since models that were quenched to ambient temperature were too locally ordered. This suggested that the initial parameterization of the RSS force field did not preserve the physical temperature scale associated with the phase diagram of carbon. However, in a later study by Xi and Shi86, this deficiency was corrected with only minor modifications to the RSS force field.
(a) (b)
(c)
For notational convenience, the actual quench rates have been normalized by 2.5×10¹² K/s to give relative rates ranging from 64 to 1. As is evident from Figure 1.3 , the quench rate has a large impact on the morphology of the models. The structure generated using a relative quench rate of 32 (Figure 1.3 (a)) appears to be almost amorphous, consisting of small carbon fragments that contain only a few aromatic rings each. As the quench rate decreases, the local and intermediate range order increases due to the aggregation of the small fragments into larger nanocrystals (Figure 1.3 (b)). At the slowest quench rate (Figure 1.3 (c)), the model consists entirely of intertwined graphene sheets.
(a)
(b)
In a recent study30, we have also shown that in both simulation and experiment, the increase in intermediate range order coincides with changes in the morphology of the porous features. The small graphene fragments found in models produced at fast quench rates frequently bisect the void spaces, resulting small pores that are highly irregular. As larger nanocrystals are formed at slower quench rates, the porous features become more regularly shaped, increasing the total pore volume and the average size of the micropores. These changes have a measurable impact on adsorptive properties of the structures 4. The adsorption isotherms for Ar at 87.3 K calculated using grand canonical Monte Carlo simulations (GCMC)88 are shown in Figure 1.5. Details of the calculations are identical to those described elsewhere89.
Figure 1.5 Simulated adsorption isotherms for Ar at 87.3 K on the QMD models produced at relative quench rate of 32, 8 and 1.
higher relative pressure (P/Po > 10-2) than the structures produced at faster quench rates. Similar trends following the synthesis temperature have been observed in adsorption isotherms for Ar at 77 K on DNCs derived from TiC4. Our recent MD studies suggest that diffusion is also affected by the changes in morphology90, 91. The small, tortuous nanopores found in models produced at fast quench rates sterically hinder the transport of Ar, while the strong fluid-solid interactions in the more ordered models give rise to energetic traps that impede diffusion. The diffusion of Ar is optimal in models produced at intermediate quench rates, due to the large pores and relatively weak fluid-solid interactions.
(a)
(b)
1.4.3
Hybrid Reverse Monte Carlo
Reconstruction methods build virtual replicas of heterogeneous materials by successively refining models until they conform to a set of experimental target data. These approaches have been successful in modeling a variety of materials, including silica xerogels92, 93, Vycor glass94 and disordered carbons29, 95-97. In many cases, the models produced with these methods yield quantitative predictions of the properties of the targeted materials32. However, such capabilities are not guaranteed by any reconstruction method since models with very different structures may reproduce any given set of target data equally well. The main difficulty in applying these methods is therefore choosing experimental data that contains sufficient information about the structure of the material to ensure a faithful reconstruction.
Reverse Monte Carlo (RMC) algorithms are the most widely used class of reconstruction methods for modeling liquids and amorphous materials. The original RMC method proposed by McGreevy and Pusztai98 in 1988 uses the Metropolis99 algorithm to refine the structure of a model system until it matches an experimental target function, fexp( )x . The agreement between simulation and experiment is assessed using theχ2 merit function:
(
)
22
sim( )i exp( )i i
f x f x
χ =
∑
− (1.2)where 2 2
RMC n m
E χ χ
Δ = − is the change in the merit function and kT is the thermal energy of the system. According to Eq.(1.3), the new configuration is always accepted if ΔERMC <0 and is otherwise accepted with a probability accept exp( / )
m n RMC
P→ = −ΔE kT . This procedure is repeated in order to minimize χ2 until it converges within some specified tolerance. The
RMC method is often combined with a simulated annealing (SA) procedure that progressively lowers the temperature to cool the system throughout the simulation 100. This prevents the system from getting trapped in local χ2 minima by allowing it to explore a
wider range of phase space. In contrast to the quench rate in the QMD method, SA is only a minimization technique and has no relevance to the physical nature of the system being simulated.
Although different target functions can be used in the RMC method, the most common is the pair correlation, or radial distribution function (RDF), g r( ), which gives the probability of finding two atoms at a separation distance r in the material. The RDF may be obtained from XRD or ND experiments by taking the Fourier transform of the normalized scattering profile,
( )
which poses a significant problem in using the RMC method to model DNCs and other covalently bonded solids with local atomic structures that are heavily influenced by many-body forces.
One approach to modeling DNCs with RMC methods is to apply additional constraints to the chemistry to ensure that models with realistic bonding structures are produced. Thompson and Gubbins95 constrained their models of DNCs to contain only planar nanocrystals composed of hexagonal carbon rings. This constraint was enforced during the RMC simulations by restricting the types of MC moves to those where entire nanocrystals were created, destroyed, displaced or rotated. The nanocrystals were also allowed to grow and shrink during the simulation by adding and removing rings along their edges. Although the approach of Thompson and Gubbins has been successful in modeling highly graphitic carbons, the constraints they used are generally too restrictive to describe the nanostructure of most DNCs. Pikunic et al.96, 103 developed a more flexible method known as constrained reverse Monte Carlo (CRMC) that incorporates an additional ncmerit functions in the reconstruction procedure by replacing ΔERMCin Eq.(1.3) with:
c n
CRMC RMC i i
i
E E w C
Δ = Δ +
∑
Δ (1.4)unstable due to the presence of highly strained 3- and 4-member rings105, indicating that the constraints were insufficient to produce physically realizable nanostructures.
The CRMC method is difficult to apply in practice because it requires defining a reasonable set of constraints to treat the many-body correlations that determine the bonding structure of solid materials. Moreover, the models produced with the method are sensitive to the choice of constraints, allowing for unfavorable biases to be easily introduced. The reactive force fields for carbon discussed in Section 1.4.1 are essentially sophisticated constraints that have been carefully optimized to describe the many-body forces involved in chemical bonding. Opletal et al.106 proposed using the potential energy of the systems, EPE, calculated by a reactive force field as a constraint, thereby replacing Eq. (1.4) with:
HRMC RMC PE PE
E E w E
Δ = Δ + Δ (1.5)
used by Nguyen and co-workers108 to build a model for activated carbon fiber, which has successfully predicted adsorption isotherms for a number of gases including Ar, N2 and CO2.
In order to demonstrate these approaches, we have used the RMC and HRMC methods to reconstruct the QMD model from Sec 1.4.2 that was produced at the slowest quench rate. In both the RMC and HRMC simulations, an annealing procedure was used to avoid local χ2
Figure 1.7 Radial distribution functions of the target QMD structure and the RMC and HRMC models. The three RDFs are nearly identical, and indicate that the models are locally ordered and have an absence of structural coherence beyond ~0.8 nm. The lines are offset by 2 for clarity.
(a) (b)
(c)
(a) (b)
(c)
One consequence of the discrepancies between the PSDs is that the models have different accessible pore volumes. For an Ar-sized molecule ~0.34 nm in diameter, the target model has an accessible volume of 0.55 cm3/g, while the RMC and HRMC models have 0.20 and 0.51 cm3/g, respectively. As a result, the target model has a higher total adsorption capacity. Figure 1.9 (b) and Figure 1.9 (c) show the simulated adsorption isotherms and isosteric heats of adsorption for Ar at 87.3 K on each of the models. To account for the differences in adsorption capacity, the isotherms have been normalized by the amount adsorbed in each model at P/Po=1 to facilitate comparison. The RMC model adsorbs less Ar at low pressures compared with the other two models because its pores are highly disordered and dispersed throughout the structure, preventing the Ar molecules from adsorbing in a cooperative fashion. Since the morphology of the HRMC and target models is similar, their isotherms are in good agreement except for some slight deviations around P/Po~10-4 that are caused by differences in the PSDs. As shown in Figure 1.9 (c), the isosteric heats of adsorption for the HRMC and target models are also in good agreement. At low reduced loadings, the isosteric heats are dominated by fluid-solid interactions because few Ar molecules are adsorbed. The isosteric heats of all three models converge to ~18 kJ/mol at low-loading, suggesting that their nanostructures give rise to similar fluid-solid interactions. This is expected since the models have nearly identical local carbon density profiles. However, at higher reduced loadings, the isosteric heats are strongly influenced by fluid-fluid interactions and are therefore sensitive to the structure of the adsorbed phase. Consequently, the heats of adsorption for the RMC model diverge rapidly from those of the target and HRMC models as the loading increases.
combination of small-angle and wide-angle XRD measurements. As discussed in Section 1.3, this same carbon was originally modeled by Segarra and Glandt36 using their isotropic platelet model. The potential energy of the carbon system in the HRMC simulations was calculated using the AIREBO73 force field. Due to the expense of the potential energy calculations, the size of the model was limited to ~1,400 carbons, which took nearly a month to simulate on a single processor. The simulations were carried out in a cubic simulation cell 3.0 nm in length. This size was chosen to give a mean carbon density ~1.05 g/cm3, which was estimated from the experimental micropore volume of the BPL carbon29.
Figure 1.10 (a) and Figure 1.10 (b) show the simulated and experimental RDFs and a snapshot of the reconstructed model, respectively. The two RDFs are in reasonable agreement, with an average residual χ2 error of ~10-2 per data point. The agreement is not as good as in the example where model data was used for the target RDF. The experimental RDF has anomalously wide first and second neighbor peaks that were difficult to match due to the potential energy constraints on the model. Obtaining good resolution of these two peaks in experiment usually requires measuring ( )S q to q-values in excess of 4.0 nm-1 using ND methods or synchrotron X-ray radiation31. Due to the limited range of the diffractometer,
( )
(a)
(b)
(a)
(b)
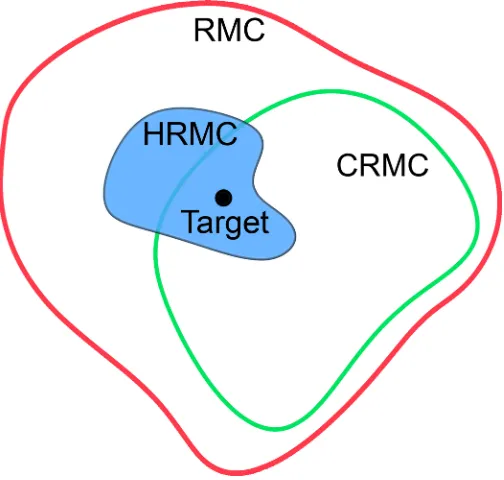
Figure 1.12 The sets of unique structures that can be generated with the RMC, CRMC and HRMC methods. The RMC method is the least restrictive since it only requires that the final model structure conforms to the experimental RDF, which is not unique for materials with many-body interactions. Constraints on the average coordination number and the bond angles in the CRMC method reduces the number of accessible nanostructures, closing in on the true target structure. The HRMC method is the most restrictive method since it uses a reactive force field to incorporate 3- and 4-body constraints. However, none of the methods guarantee convergence on the target structure since they do not fully constrain the N-body system.
Calculating the RDF from the corrected scattering intensities is also a nontrivial procedure that is prone to error31, 113. As we demonstrated for the QMD model, even with a perfect RDF in hand, the HRMC models may not accurately reproduce the PSD of the target structure. This is not entirely unexpected since the porous features in DNCs are highly amorphous, giving rise to very weak density correlations. Nevertheless, reproducing the porous features of the target material is extremely important for accurately predicting adsorptive and diffusive behavior. The PSD itself could potentially be used as a target function, but it is difficult to accurately estimate from experiment, especially for microporous materials53. Salazar and Gelb93 were successful in using the adsorption isotherm as a target function to reconstruct the porous features in lattice models of mesoporous silicas gels; however, such calculations would be too expensive for fully atomistic models. The chord length distribution is another potential target function, since it contains a significant amount of information about the solid-void interface114, 115. Unfortunately, this function is computationally expensive to evaluate in simulation, and it is also difficult to accurately determine from experiment since it requires high resolution small-angle diffraction measurements. Thus, finding a general constraint function to supplement the RDF in reconstructing the porous features of DNCs remains an open problem at present.
1.5
Conclusions
approaches vary significantly in the types of building blocks they use, incorporating structural elements ranging from single benzene rings to large fragments of graphite. The strength of these approaches is that they allow for absolute control over the morphology of the models, permitting the impact of different structural features to be systematically investigated. On the other hand, the predictive capabilities of these approaches are limited since there are no rigorous guidelines based on physical principles to suggest how these building blocks should be defined or pieced together.
The QMD and HRMC methods are fundamentally different from the constitutive approaches. These methods aim to build structural models from the ground up, predicting the nanostructure and porous features of DNCs using techniques that are rooted in statistical mechanics. The QMD method is an example of a pseudo-mimetic approach, in which carbon is thermally quenched from the liquid or vapor phase into a metastable disordered solid. The morphological changes of the QMD models that result from modulating the quench rate are analogous those to observed in real DNCs as the synthesis temperature is varied. These changes are similar since the quench rate and synthesis temperature are used to guide the simulated and experimental systems, respectively, into different metastable configurations. In contrast, the HRMC method attempts to reconstruct real DNCs using the experimental RDF of the target material. Since the RDF is insufficient to uniquely describe the local bonding structure of disordered carbons, the HRMC method incorporates many-body constraints into the reconstruction procedure in order to produce models that have physically reasonable nanostructures. Although the HRMC models have shown considerable promise in predicting adsorptive properties, accurately reconstructing the porous features of the target materials remains a major challenge.
that allow for the inclusion of heteroatoms such as O, S, and H into DNC models. This will be particularly useful in predicting the surface chemistry of real disordered carbons, which remains poorly understood21. The functional groups formed by these heteroatoms are also important for accurately predicting the adsorption and transport properties of polar molecules, such as water and ammonia, that are important for many separations-based applications of DNCs2. Finally, the improvements in the efficiency of these force fields and increases in computational power will also allow larger models to be constructed that describe DNCs over a wider range of length scales, capturing large structural and mesoporous features.
Chapter 2
Detailed Structural Models for Activated Carbons from Molecular
Simulation
i2.1
Introduction
Activated carbons are among the most widely used industrial materials. Due to their low cost of production and high adsorption capacity, they have found use in a number of applications such as gas and electrolyte storage, gas and fluid purification, and as catalysts and catalyst support3, 116-118. Activated carbons are typically synthesized from organic carbonaceous precursors such as woods, coconut shells and coals. By judicious choice of the precursor materials and processing conditions, they can be synthesized with a wide range of features characterized by pore size distribution (PSD), specific surface area (SSA) and chemical composition. As a result, a considerable amount of effort has been expended into characterizing activated carbons in order to understand how specific structural and chemical features influence their performance (e.g.119-121 ). Despite these efforts, their highly amorphous nature has limited the ability of traditional structural characterization techniques, such as X-ray diffraction (XRD), to fully resolve the detailed microstructure of these materials. As a result, a fundamental understanding of how their structural features give rise to their adsorptive properties remains elusive and thus the ability to develop activated carbons with optimal properties for specific applications has not yet been achieved.
Molecular simulation methods have been widely used to study the adsorptive properties of porous materials (e.g.109, 122-124). The primary limitation in applying these methods to study activated carbons has been the lack of realistic structural models. The most frequently used approach has been to use highly simplified geometric models such as infinite slit or cylindrical shaped pores to model the porous structures in activated carbons58, 125. While these models account for variations in pore size, they fail to adequately capture sources of heterogeneity such as pore connectivity and irregular pore morphologies. More detailed structural models have been developed by so-called reconstruction methods that generate atomistic models to match key experimental measurements, such as the pore size distribution or radial distribution function (RDF)95, 96. Structural models produced by reconstruction methods incorporate pore connectivity and irregular pore shapes, but without additional constraints these methods do not provide an accurate description of the carbon microstructure and usually produce models that contain unrealistic structural features such as highly strained three- and four-member carbon rings.
fiber108, a wood-derived ultra-microporous activated carbon and a non-activated carbon derived from crystalline TiC126.
Our goal is to develop a structural model for Calgon’s bituminous coal-based carbon, BPL. BPL is a widely used industrial adsorbent that has shown promise in environmental applications, particularly as an adsorbent for toxic and odorous industrial chemicals120, 127-131. There have been many approaches taken to model BPL including those based on classical thermodynamic theories132, 133 and molecular simulation and statistical mechanics36, 60, 61. Segarra and Glandt36 and Liu and Monson60, 61 have both proposed platelet models for BPL, in which the carbon framework of BPL is modeled as a collection of randomly positioned and oriented graphite platelets, consisting of either one or two featureless, planar graphene sheets. This approach has been very successful in reproducing experimental adsorption data over a wide range of state conditions for a number of adsorbates, including methane, ethane and their mixtures, and water. While the platelet models go well beyond the slit-pore approximation by introducing sources of heterogeneity such as pore connectivity and variable pore morphologies, they do not provide the atomistic-level detail needed to allow for local structural deviations from that of graphite, such as curvature of the basal graphite sheets, deviations in the carbon bonding chemistry or a realistic description of the polydispersity of graphene fragment sizes found in BPL. As a result, the ability of these models to accurately predict the structural features of BPL and their impact on the adsorption properties is limited.
considerable detail and calculate geometric properties such as the carbon ring size distribution, bond angle distributions and ring connectivity87 and illustrate that these features are very different from those found in crystalline graphite. In addition, the geometric pore size distribution and surface area are calculated using exact Monte Carlo integration techniques. The adsorptive properties of the model are also examined for several simple fluids and compared directly with experimental measurements.
2.2
Experimental Methods
2.2.1
X-ray Diffraction
2.2.2
Adsorption Measurements
Volumetric adsorption measurements were taken on BPL samples using a Quantachrome Autosorb 1C analyzer to measure nitrogen adsorption and desorption isotherms at 77 K. The nitrogen isotherms were used to estimate the differential PSD for BPL using the quenched-solid non-local fluid density functional theory (QSDFT) of Ravikovitch and Neimark135 implemented in the Quantachrome data reduction and analysis software, ASWin ver. 1.55. While this implementation of non-local density functional theory still assumes a simple slit-pore geometry in calculating the properties of the carbon sample, it treats the solid carbon phase as a quenched component, allowing for a heterogeneous carbon density profile to be incorporated into the slit-pore model. Thus additional sources of heterogeneity in the microstructure that are not explicitly taken into account may be incorporated into the slit-pore model through an effective surface roughness, resulting in improved estimates of the PSD for highly heterogeneous materials such as activated carbons. The linear region of the nitrogen adsorption isotherm was also used to estimate the SSA of BPL using Brunauer-Emmett-Teller (BET) analysis136.
2.3
Theoretical Methods
2.3.1
The Hybrid Reverse Monte Carlo Method
more complex systems, such as covalently-bonded solids, energy functionals that can accurately describe correlations between atoms beyond a few angstroms have not been developed. Thus, a biasing function is used to account for long-range correlations in the potential energy, which dictates the micro- and meso-scopic structures. In our simulations, we have used the total residual error cost function,χ2, which is calculated between the
simulated and experimentally measured RDFs,g r( ),
2 2
exp 1
( ( ) ( ))
n
sim i i
i
g r g r
χ
=
=
∑
− . (2.1)The sampling is conducted with the total number of particles,N , and the total volume of the system, V , held constant. In addition, the ratio of a temperature-like parameter,T, and a weighting factor, w, that is related to the total error in the experimental RDF, is also held constant. The Metropolis acceptance probability in the HRMC procedure for transitioning from one configuration to another is a function of both the change in configurational energy and residual error,
2
min[1,exp( ( ) / )]
accept
P = − Δ + ΔU w χ T . (2.2)
Further details of the HRMC method can be found elsewhere97, 137.
2.3.2
Generation of the Model
packed particle density, ranges from 0.4 0.5 g/cm− 3 depending on the particle size. The
particle density, as measured by mercury displacement, gives an estimate of the density that includes the void space contribution due to micropores and small mesopores and has been reported to be 0.8 g/cm for BPL. And finally, the true density, which excludes void 3
volumes that are large enough to be accessible to helium, is 2.23g/cm , or roughly that of 3
crystalline graphite129.
Since the HRMC method is best suited for microporous systems, we estimated the carbon density using the approach taken by Nguyen et al.108, in which the density,ρc, is
1 C c MP He X V ρ ρ ≈ + , (2.3)
where Xcis the weight percent of carbon in BPL, ρHe is the true density as measured by helium displacement and VMPis the micropore volume. This method was chosen because it provides an estimate of the density that includes only the void space of the micropores. The micropore volume was estimated to be 0.44 cm /g by integrating over the PSD that was 3
calculated using QSDFT and the value for the true density was taken from Ref129. Since BPL is synthesized from bituminous coal, it contains a number of heteroatoms such as N, O, H, S and Cl. The composition of the BPL may also vary from batch to batch depending on the composition of the coal precursor. We chose Xc such that the micropore volume of our final structure matched our estimate of the micropore volume obtained from the PSD, where the method for calculating the model’s micropore volume is discussed in Section 2.3.4. Therefore usingXc =0.935 and 0.44 cm /g3
MP
Simulations were initiated from a randomly-generated initial configuration of 1420 carbon atoms in a periodic cubic unit cell, 30 Å in length. Beyond 15Å , oscillations in the experimental RDF were not observed, indicating it did not contain significant structural information. Therefore, the length of the unit cell was chosen so that a RDF cutoff of 15Å could be used while keeping the minimum image convention138. An annealing procedure was also implemented by varying w and Tin such a way that their ratio remained constant during the simulation. This was done to ensure that configurational space was adequately sampled during the simulation and that the final structural model would not be heavily influenced by the choice of our initial starting configuration. The HRMC method was used to perform 4
10 blocks of 4
3.5 10× Monte Carlo steps. The ratio /w T and annealing rate were chosen such that the final simulated and experimental RDF were in good agreement and no highly strained small carbon rings structures were observed. To calculate the configurational energy in our simulations and to capture bond breaking and formation, we used the Adaptive Intermolecular Reactive Empirical Bond Order (AIRBEO) potential of Stuart et al.73.
2.3.3
Structural Characterization
The total geometric pore size distribution was calculated using the method of Gelb and Gubbins109, which uses a spherical probe to determine the largest sphere that may be inserted at a given point in the simulation cell without overlapping the carbon structure. The pore width is then defined as the diameter of this largest sphere. We sampled approximately 6
10 points using an evenly spaced grid to discretize the space of the simulation cell. Overlap was defined to occur if the probe sphere came within the Lennard-Jones diameter, 3.36 Å, of the geometric center of a carbon atom. The Connolly surface area of the model structure was calculated using the chord length distribution method described in Ref 140. This measure of the surface area is the area that would be obtained if a spherical probe were rolled over the carbon structure. Therefore, any region of the structure accessible to the surface of the probe molecule contributes to the total surface area. For our calculations, we used a sphere of
3.75 Å in diameter, which is the Lennard-Jones diameter of the nitrogen model used in this study.
2.3.4
Simulated Adsorption Isotherms
Grand canonical Monte Carlo (GCMC) simulations141 were used to calculate simulated adsorption isotherms on our model structure. The adsorbate molecules and carbon atoms were modeled as single-site Lennard-Jones spheres. The adsorbate collision diameters and well-depths, as well as the adsorbate-carbon collision diameters were taken from Nguyen et al.108. The adsorbate-carbon well-depths ,εsf , were scaled from the parameters for graphite,
sf G ε ,
sf sf
G
ε =αε , (2.4)