Understanding Rate of Diffusion between Two
Liquids in a Christiansen Cell in Terms of
Time Evolutions of Diffraction Halos
Rajib Mahanta1, Chandana Gogoi2, G D Baruah3
Assistant Professor, Department of Physics, Dibru College, Dibrugarh, Assam, India1
Associate Professor, Department of Physics, Dibru College, Dibrugarh, Assam, India2
Rtd. Professor,Centre for Laser and Optical Science, Doom Dooma, Assam, India3
ABSTRACT: When laser radiation is allowed to pass through the diffusion region separating the two liquids in a Christiansen cell, beautiful circular halo is observed on the screen. The pattern of this diffraction halo changes with time. In the present work we have studied this diffraction halo and its time evolution. It has been observed that there is a definite co-relation between the shape of the diffraction halo and width of the diffusion region. The time evolution of this diffraction halo indicates that as diffusion region increases the circular halo becomes elliptical and finally straight. It may be noted that this type of diffraction halo and its time evolution is not reported in any earlier works in connection with Christiansen effect. It is believed that the time evolution of this diffraction halo will have practical application in diffusion study between two molecules.
KEY WORDS: Christiansen effect, Diffraction halo, Diffusion, Chromatic pattern.
I. INTRODUCTION
When an optically isotropic solid like glass is powdered and put inside a flat sided cell which is then filled with a liquid and its refractive index of the latter is adjusted suitably by varying its composition or altering its temperature, beautiful chromatic effects are observed when the refractive index of the liquid is brought into coincidence with that of the powder for some chosen wavelength of the spectrum. The cell becomes transparent for that particular wavelength while rest of the incident light passing through the cell is diffused out in various directions and appears as a halo surrounding the light source. This is known as the Christiansen effect observed by Christiansen. It is evident that this effect has its great practical application in designing optical filter, capable of isolating narrow region of the spectrum with minimum loss of light. It was Raman and co-workers [1-3] who gave adequate explanations to the observed facts of Christiansen effect through a series of papers on the basis of wave front corrugation concept. Christiansen effect has found its applications in diverse field of science and technology; mainly in IR study[4,5,], in glass technology[6], heat transfer and flow through porous media[7], in atmospheric study[8,9], to build optical power limiter and sensor[10,11], colloids and polymer study[12], and also in microgravity research [13]. In a recent work Mahanta et al.[14,15]have described in detail about the role of diffusion on the chromatic patterns associated with Christiansen effect. The present work is concerned with some salient features of Christiansen cell observed without glass spherules and using laser beam. It is observed that when laser radiation is allowed to pass through the diffusion region separating the two liquids in a Christiansen cell, beautiful circular halo is observed on the screen. Studies on the time evolution of diffraction halos may lead to the development of an optical technique for diffusion study.
II. MATERIALS AND METHODS
transparent solid powder in liquid combination as done by earlier workers. Laser radiation is allowed to fall on the Christiansen cell containing liquids through an iris and the diffraction halos are observed on a white screen. DSLR camera has been used to photograph the chromatic patterns under different circumstances. Here we use different types of liquids combination like acetone and CS2, acetone and benzene, acetone and CCl4 etc. Square curettes as well as test tubes of diameter 0.5 cm and 1.0 cm and 30 cm
long have been used as sample cells. In our experiment the cell was first half filled with heavier liquid. The lighter liquid of equal volume is introduced very carefully to avoid any convection currents. The observed chromatic patterns are projected on a white screen at distance of 15 cm. and the pattern is recorded by the DSLR camera.
III. EXPERIMENTAL
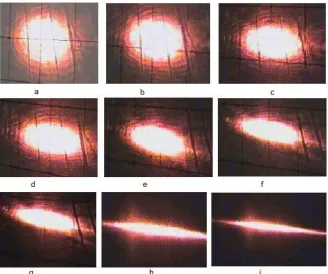
When laser radiation is allowed to pass through the boundary separating the two liquids, beautiful circular halo is observed on the screen. The photograph of the halo patterns are recorded after a specific interval of time. It is seen that the shapes of the halo pattern changes with time. It is instructive to record the diffraction haloes in the region of diffusion at different instant of time from the beginning and at successive stages of its development till a stage of saturation is attained. They are reproduced in Fig.1. It is worthwhile to note that the circular halo does not appear on the screen when the light is transmitted through other parts of the sample cell. It is worthy of remark that the diffraction halos are also observed when coherent light from green or other laser radiation is used. But in this case the haloes are not well focused as compared to red laser.
IV. RESULTS AND DISCUSSION
Fig.1 (a, b, c,…..i) shows the optical patterns at different times. At the beginning of the experiment, approximately circular halo is observed and as time evolves, the halo become more and more elliptical. In case of acetone and CS2 the elliptical pattern becomes
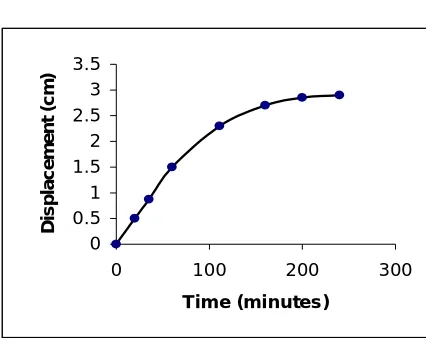
almost straight after few hours. The development of the elliptical halos from circular takes places at a quicker rate when the process of diffusion is rapid. It is worthwhile to note that the fringe patterns move upward. This indicates that diffusion is more towards lower side due to gravitation. The displacement of the center against time yields a curve as shown in Fig. 2.
Fig. 2: Displacement of the centre of diffraction halos with time.
It is mentioned earlier that these types of halos observed in diffusion region and its time evolution is not reported yet. However in a recent work the method of multiple beam intererometry has been used to determine diffusion co-efficient [16]. The types of fringes observed by these workers are attributed to the change in the path traveled by the incident light with its position inside the experimental cell.
Why the phenomenon described above manifests itself is not difficult to understand if we consider the process of diffusion which is taking place between two liquids to both sides of the boundary separating them. The appearance of diffraction halo patterns is due to diffusion between the liquids which is taking place between acetone and CS2 to both sides of the boundary separating them. The density of the liquid at the boundary and in the region of diffusion is more than that lying above and is less than that lying below it. In our experiment the cell was first half filled with heavier liquid (heavier concentration). The lighter liquid (lower concentration) of equal volume is introduced very carefully to avoid any convection currents. The process of diffusion starts after the cell is filled.
The free diffusion process is governed by Fick’s second law, and for one-dimensional diffusion along the z-axis it is given by [17],
D
dt
t
z
dC
)
,
(
2 2)
,
(
dz
t
z
C
d
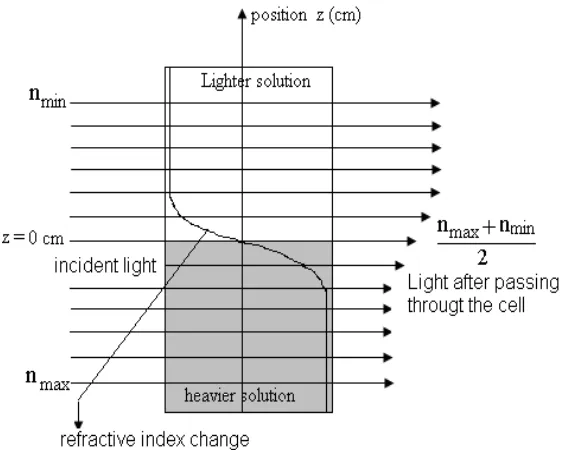
where C(z, t) is the concentration at z at time t, D is the diffusion coefficient and z is the direction of diffusion. Inside the diffusion cell and for the range of concentrations over which the experiments were conducted, the refractive index is a linear function of concentration(Fig.3) [16].
0 0.5 1 1.5 2 2.5 3 3.5
0 100 200 300
Tim e (m inutes)
Fig. 3: Change in refractive index with concentration. [16]
Then one can write,
n(z,t) = mC(z,t) + no,
where m is the slope of the concentration versus refractive index curve in the applied concentration range and no is the
constant. There will be change in refractive index at a particular plane perpendicular to the direction of diffusion with time. Since the refractive index at different planes in the cell is different the light passing through the cell will have different optical paths at different planes given by
Δ1(z1) = n1(z1)L, Δ2(z2) = n2(z2)L,…….
where Δ1,Δ2,….are the optical paths of the light rays through different planes situated at z1,z2,… and n1,n2….. are the
corresponding refractive indices of the planes and L is the thickness of the cell. The orientation of the experimental cell and change in the path length of the light traveling through the cell is shown in fig. 4.
Fig. 4: Change in path traveled by the incident light with its position inside the cell.
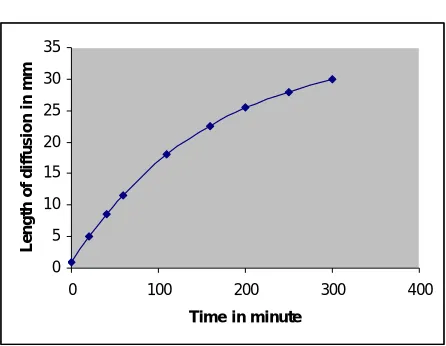
Table 1 shows The nature of halo with the depth of diffusion and Fig. 5 shows the change of depth of diffusion with time between the liquids; acetone and CS2 (vol. 1:1) . Interesting is that this is analogous to the curves as
shown in Fig 2 which indicates that there is a definite co-relation between the change of shape of the diffraction halo and rate of diffusion. Table 2 indicates few liquid mixtures where it is shown that fringes are observed only when diffusion exists.
Table 1: The nature of halo pattern with the depth of diffusion
Time in minute Depth in diffusion in mm Shape of halo
0.03 1 Circular
20 5 Circular
40 8.5 Elliptical
60
12 Elliptical
110 18 Elliptical
160 23 Elliptical
200 25.5 Elliptical
250 28 Straight
Fig. 5: A plot of diffusion length with time between acetone and CS2(vol. 1:1). The length of experimental cell is 10 cm and thickness is 1 cm.
Table 2: Nature of boundary layers between two liquids
Sl no Liquid mixture Diffusion observed circular halo
observed
1 Acetone and CS2 Yes Yes
2 Water and acetone Yes Yes
3 CS2 and water No No
4 Benzene and water No No
5 Petroleum spirit and
water No No
6 Benzene and CS2 Yes Yes
V. CONCLUSIONS
The halo pattern, which is observed when a monochromatic and coherent beam of light is passed through the region of diffusion, gives sufficient information about the region separating two liquids, which are capable of mixing through diffusion. Since Christiansen effect utilizes this region so it is believed that these diffraction halo patterns will throw much needed light on the theory of the Christiansen effect. Further we have observed that the circular halo transformed to elliptical halos as time evolves. It is reasonable to believe that this observation will give quantitative information about the rate of diffusion between two liquids and hence it will be new optical metrological technique.
ACKNOWLEDGEMENT
One of the authors, Dr Rajib Mahanta, is thankful to UGC-NERO, Gauhati, India, for grating Minor Research Project entitled “Investigation of the dynamic fringe pattern associated with diffusion between two liquids in Christiansen effect. This work has been carried out under this Minor Research Project.
0 5 10 15 20 25 30 35
0 100 200 300 400
Time in minute
L
e
n
g
th
o
f
d
if
fu
s
io
n
i
n
m
REFERENCES
[1] C. V. Raman, “The theory of the Christiansen experiment”, Proc Indian Acad Sci, Vol.A29, pp.288-297, 1949. [2] C. V. Raman and M R Bhat, “The Christiansen experiment”, Curr Sci, Vol. 22 , pp.312-315, 1955.
[3] C V Raman and K S Viswanathan, “A generalized theory of the Christiansen experiment”, Proc Indian Acad Sci, Vol.A41, pp.337-341, 1955. [4] U. Wajak, U. Czarnetzkiand H.F. Dobele, “Christiansen filters for the far ultraviolet”, Appl. Opt., Vol. 26, pp. 4788-4490, 1987.
[5] L Xiao-Dong, L. Hou and H. wang, “Investigations into the mid-infrared Christiansen effect of the dispersive materials”, Infrared Phys and Tech.”, Vol. 43, pp.401-405, 2002.
[6] Hoffmann, H.J. and Steinhar, “Determination of glass in homogeneities from the spectral transmittance of Christiansen filters”, Glass Sci.Techn., vol.71, 319-322, 1998.
[7] Gounot and Caltagirone, “Stability and natural convection in a non-homogeneous porous layer” Int .J. Heat Mass Transfer, Vol.32, pp.1131-33, 1989.
[8] H. R. Carlon, “Christiansen effect in IR spectra of soil-derived atmospheric dusts”, Appl Opt, Vol. 18, pp.3610-3614, 1968.
[9] W. P. Arnott, Y. Dong and J. Hallett, “Extinction efficiency in the infrared (2–18 μm) of laboratory ice clouds: observations of scattering minima in the Christiansen bands of ice” Appl. Opt., 34, pp. 541-551, 1995.
[10] G. L. Fischer, W. Boyd and T. R. Moore., “Nonlinear-optical Christiansen filter as an optical power limiter”, Optics Letter, Vol. 21, pp.1643-45, 1996.
[11] J P Lenney, Goddard, Morley, Snook and Fielden“An electro-osmotic flow system with integrated planar optical waveguide sensing “Sensors and actuators B”, Vol. 39, pp. 212-217,1997.
[12] K. Okoshi, N Sano, T.O., A. Tagaya., J. M., Y. Koike, M.F. and J. Watanaba, “The Christiansen effect of brightly colored colloidal dispersion with an amphiphilic polymer”, J Colliod Interface Sci.,Vol.263 , pp.473-477, 2003.
[13] M. Trohr, K. Roth and B. Jahne, “Measurement of 3D pore-scale flow in index match porous media”, Experiments in Fluids, vol. 35, pp. 159-166,2003.
[14] R.Mahanta,C Siam,M. Konwar and G D Baruah, “ The role of diffusion on the chromatic pattern associated with the Christiansen effect” Indian J. of Phys,Vol.79,1065-1068, 2005.
[15] R.Mahanta C Siam,M. Konwar and G D Baruah, “ Time evolution of diffusion fringes in the Christiansen effect”, Optik , Vol.120, pp. 427-430, 2009.
[16] V. K. Chhaniwal, A. Anand, S. Girhe, D. Patil, N. Subrahmanyam and C.Narayanamurthy, “New optical techniques for diffusion studies in transparent liquid solutions”, JPureAppl. Opt., Vol.5, S329-334, 2003.
![Fig. 3: Change in refractive index with concentration. [16]](https://thumb-us.123doks.com/thumbv2/123dok_us/1580292.1194551/4.595.209.383.186.348/fig-change-refractive-index-concentration.webp)