Pathloss Modelling In MATLAB to Generate
Physically Accurate Simulation
Er. Daljeet Kaur1, Er. Harpreet Singh Gill2
Assistant Professor, Dept. of Electrical Engineering, GZSCCET, Bathinda, India 1
Academic Manager, Advanced Education Australia, Sydney, Australia2
ABSTRACT: Wireless communication in vehicle to vehicle (V2V) network and vehicle to infrastructure (V2I) network has grown requirement with advancement in the field of Intelligent Transport Systems and Vehicular Ad-hoc Networks (VANETs). A particular difference in V2V and V2I communication is the difference in Doppler Shift that occurs in two cases. This difference is pronounced more when the vehicles are moving in opposite direction to each other. This necessitates a requirement to study different metrics relation to signal distortion, path loss and power-delay profile in order to develop a more robust standard for V2V and V2I communication both under line or sight condition and under multipath condition. In this paper, we have modelled a simulation to gather these metrics along with other metrics like signal scattering in near field scenario due to moving vehicles and their effects on path loss and Doppler Shift and presented the findings. The advantages of performing a computer simulation over real experiment are high control over different parameters of wireless channel and devices, quick re-change in scenario and or testing over speeds which are not possible to get in real experiment scenarios and cheap solution to real experiment. The limitations are to be counted as well but once a satisfactory result is obtained via simulation, one can setup a real experiment to verify the results or collecting results over lesser granularity.
KEYWORDS: Wireless communication, Signal Distortion, Pathloss, Power Delay Profile, Dopller Shift.
I. INTRODUCTION
The unprecedented advancement in the wireless applications and the ever increasing need for the safety and non-safety applications of vehicle communications on the road, vehicle to vehicle (V2V) and vehicle to infrastructure (V2I) communication here and afterward refer to as V2X, has necessitated the ongoing research development of Intelligent Transportation Systems over Dedicated Short Range Communications.
In V2X communication, when vehicles are moving in same direction, the resulting Doppler shift is less when compared to Doppler shift while communication with ground infrastructure. This Doppler shift is pronounced more when the communication occurs between two vehicles moving in opposite directions [9]. This results due to direct relation of Doppler shift with the relative velocity of two moving vehicles. The shift can be summarized in following equations:
′= +
− (1)
And,
′= −
+ (2)
Where, (1) is applicable when vehicles move towards each other and (2) is applicable when vehicles move away from each other.
Similarly,
′= −
− (3)
′= +
+ (4)
Where, (3) and (4) is applicable when a vehicle approaches a stationary object (infrastructure) and moves away from it, respectively.
In [6], the radio channel is investigated at 2.4 GHz. In [10], a complete work on radio channel measurement for V2X communication is performed using an on ground experiment with two transporters and measure equipments on a highway with an infrastructure nearby. They presented the findings in terms of path loss, power-delay profiles and delay-Doppler spectra. They observed a Doppler shift of more than 1000 Hz and an average delay spread of 250 ns. The promising finding of their work is that metrics matched exactly with theoretical calculations which inspired this work also.
Herman Fernandez et al. (2013) [2] presented work based on a narrowband V2X path loss modelling of the link budget between Tx and Rx in vehicular communication at 5.9Ghz band in terms of Tx and Rx separation and fading parameters in urban, sub-urban and expressway environments. The path loss parameters are evaluated in terms of path loss exponent and standard fading deviation with the help of linear slope method. The path loss exponent is lower for expressway than urban area mainly due to low density of scatterers in the expressway environment. The experimental set-up used is simple SISO narrowband with measurements taken in both directions of motion of TX and Rx.
In this paper, we have developed a simulation of path loss channel, power-delay profiles and Doppler shift based delay-Doppler spectra and presented the findings. The most crucial factor in realistic evaluation of propagation channel is the measurement of channel parameters in varying environments of traffic density in real life scenarios. The main objective of this research is to analyze the research gaps of previous studies in the light of multipath fading and varying traffic conditions through the simulation of empirical data with MATLAB programming. Channel performance parameters of path loss in terms of path loss exponent, net received power, free space path loss profile varies with transmitter-receiver antenna gain (Gt, Gr) , actual path loss (PL) , power delay profile and delay Doppler spectrum are to be evaluated and analyzed.
II. RELATED WORK
Cheng-Xiang Wang et al (2009) [6] summarizes the research methods, models and clearly identifies the research gaps in the previous research studies in the field of vehicle to vehicle channel modelling. It concludes that the critical challenge of research in this field is to characterize the V2X communication channel by evaluating the channel statistics.
Mate Boban et al. (2013) [3] advocates the use of two ray ground path loss model in the purely LOS propagation channels in VANETs due to the evaluated better channel performance in terms of packet delivery rate, throughput, latency and jitter on the condition of equal antenna heights at both Tx & Rx. Additionally, antenna elevation is restricted to 15º at both Tx and Rx in order to improve SNR and to minimize the scattering effect.
With the implementation of effective reflection coefficient range, two ray ground reflection is well suited in LOS channel modelling than free space path loss modelling, which is over-simplistic model considering only the LOS ray discarding the ground reflected, diffracted and scattered rays at the receiver. Nevertheless, Two Ray model is also only better with least traffic density or scatterers i.e. in rural or expressway environments, and the improved channel parameters becoming more comparable to free space model in urban environments. The reflection coefficient 1.003 which is significantly less than the normal value range for asphalt at 1.5-6, which can be accounted for because of the incidence angles of antennas limited at not more than 15º [3].
In this paper, we have used the previous researches and found few more metrics like scattering parameters in near field vehicle to vehicle scenarios, and developed a very accurate MATLAB simulation to accurately simulate such V2X scenarios.
The benefits of developing a simulation is that we can simulate complex scenarios where real experimental setup is either not feasible or highly error prone. Some of the examples include V2X experiments in very high traffic scenarios or V2X experiments in natural calamity scenarios.
Most of the simulators do not provide very realistic simulation scenarios out of the box. They often trade the realism for ease of computation. Such simulations are good to get a basic simulation but when we need high precision results, we have to model the scenarios all by ourselves.
III. WIRELESS PATH LOSS MODELLING
Wireless path loss model is a relation between the signal power and distance of propagation in wireless channel. Following the inverse square law, the signal power drops exponentially as it moves away from its source. Wave scatters and disperses as it moves toward the receiver, so only a fraction of signal is received at the receiver end.
To formulate this path loss, the received power is measured by the method of taking an averaging magnitude which is squared over 40 wavelengths in order to account the small scale fading, and therefore taking the sum over the delay domain and 16 channels [7]
( ) =1 ℎ( , ∆ ,
( )
(5)
With this equation, we have modelled a mathematical model for our simulation of path loss in wireless channel.
Forty wavelengths are equal to 2.3 m and thus yield at a relative speed of 180 Km/h and averaging time of = 46 , i.e. L = 150 snapshots. [7]. A thresholding is provided to set channel noise to zero when it’s power fall below -60 dB. This is our noise channel. Finally, to obtain path loss, we have to take the difference of transmitted power and the power received at receiver end.
= − (6)
To account for multipath fading channel, we have to model the wireless channel and its properties also to take into account for fading and propagation. We have used a simple two ray ground model to model for that scenario. It is given by equation (7) as follow.
( ) = ℎ ℎ (7)
Where, , ℎ and ,ℎ are antenna gains and heights of transmitter and receiver, respectively. “ ” is the distance between TX and Rx.
IV. POWER-DELAY PROFILE
Power delay profile (PDP) is a function of time delay and results in the average intensity of the received signal received through a multipath fading channel. Time delay is the difference between multipath signal arrival times. For small scale channel modelling, the short time power delay profile of the channel is found by taking the spatial average baseband impulse response of a multipath channel.
( , ∆ ) =1 ℎ( , ∆ , )
( )
(8)
thereafter (showing a Doppler Shift scenario), these paths are formed by a nearby infrastructure like a building which is stationary and has a comparable width.
V. DOPPLER SHIFT OF LOS PATH
Doppler Shift of Line of Sight can be theoretically computed using the equation,
( ) =− cos( ( )) (9)
Where, is relative velocity between the transmitter and receiver, is the wavelength of the signal and for 5 GHz signal, it is 58 mm, and ( ) is the angle between driving direction and LOS path direction. [7]
VI. METHODOLOGY
We started by collecting all the equations to model the step 1 wireless channel. To model such channel, we took into account the required parameters and used Rayleigh model given by,
( ) =2 / , ≥0 (10)
Where, = ( )
In step 2, we modelled the LOS path signal propagation using Two-ray ground Eq. (7).
In step 3, after modelling all the aspects of Signal propagation through wave, we used Eq. (5) to model the path loss. Since, this equation gives us the total path loss and Eq. (7) gives us path loss with LOS, we used these two equations to compute path loss through multipath fading.
In step 4, we modelled the wave scattering parameters in near field scenarios where there are many vehicles moving around and we have to transmit the signal to a nearby vehicle. This scenario is very common in multi-hop transmission routing. We used ray tracing based scenario with LOS fading and scattering effects to model at max 50 rays scattered in the simulation region. To make it computationally efficient, we made these calculation using parallel computing methods.
In step 5, we developed the model to simulate the scenario where humidity is present as humidity affects the 2.4 GHz due to known resonance at that frequency.
In step 6, we developed the short-time power-delay profile using Eq. (8) and, we developed the Doppler shift scenario and delay-Doppler spectrum using,
( ∆ , ∆ ) = (ℎ , ∆ , ) (11)
Finally, we developed a wrapper to setup a simulation scenario like environment, number of vehicles, nearby infrastructures, vehicle velocities etc. to simulate the results.
A. General Path Loss Models
Assume there are no obstructions between the transmitter and receiver and the signal propagates along a straight line between the two. The channel model associated with this transmission is called a line-of-sight (LOS) channel, and the corresponding received signal is called the LOS signal or ray.
If there is a clear unobstructed line-of-sight path between the transmitter and receiver, then we resort to the free-space propagation model. Pr (d), the received power as a function of the separation distance d between Transmitter & Receiver(m), is expressed by the well-known Friis equation (10), given as
Where;
Ptis the transmitted power (W), Pris received power (W) Gt is the transmit antenna gain, Gr is the receive antenna gain,
L is the system loss factor which is independent of propagation environment.
λ is the wavelength in meters
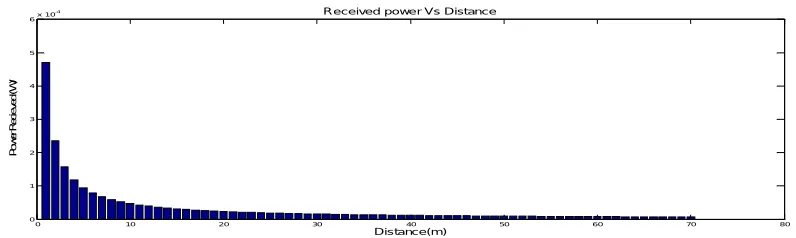
Figure 2- Received power as a function of Distance between Transmitter & Receiver.
Specifically, we can calculate the pathloss by subtracting the received power from the transmitted power.
The system loss factor L represents overall attenuation or loss in the actual system hardware, including transmission line, filter, and antennas. In general, L > 1, but L=1 if we assume that there is no loss in the system hardware. It is obvious from Equation (12) that the received power attenuates exponentially with the distance d.
In this model, the power is presumed to decay with distance from the transmitter according to some power law, usually as square of the distance from the transmitter. The free-space power received by an antenna at a distance d from the transmitter is given by (12), but received power with values as following is shown in figure-2 using equation (12).
Pt= 27dBm = 500Mw = 0.5 W Gt = Gr = 6.7
= 0.0575 (as 1 wavelength equal to 0.0575m) L= 1 , for LOS
Distance between Transmitter and Receiver = 70m
We can calculate free-space path loss, PLF (d), by putting L=1 in the equation (12)
PLF (d) = 10 log (Pt / Pr ) = 20 log (4 d/ λ) (13)
Equation (13) gives free path loss model without antenna gains i.e. Gt and Gr both are equal to one, as shown in Figure-3
0 10 20 30 40 50 60 70 80
0 1 2 3 4 5 6x 10
-4
Distance(m)
P
o
w
e
r
R
e
c
ie
v
e
d
(
W
)
Received power Vs Distance
Figure 3- Free space path loss model without antenna gains and without considering noise threshold
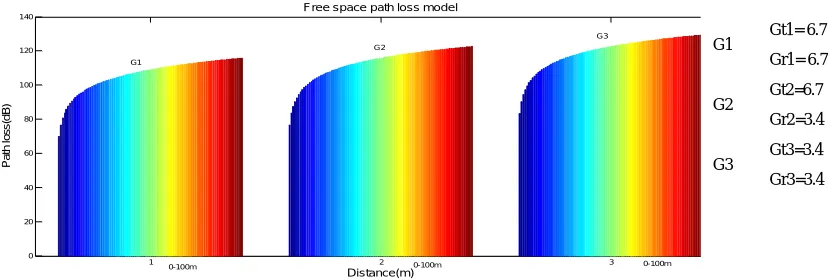
Fig.4 shows the free-space path loss at and path loss for different antenna gains as distance varies using equation for path loss, PLF (d) = 10 log ( Pt / Pr ) = - 10 log ((Gt Grλ2)/(16 2 d2) (14)
Figure 4- Free space path loss model with different antenna gains and without noise threshold
It can be easily deduced from Figure 4, that path loss is inversely proportional to the function of antenna gain. The path loss exponent is incorporated in the path loss model in order to account for the varying wireless parameters in different environments and can be illustrated by the following equation:
PLLD (d) = PLF(d0) + 10 n log (d/ d0) (15)
where d0 = reference distance
This aforementioned equation is the basis of the log-distance path loss model.
According to the Table2 data on the path loss exponent, it is quite evident that the range of the path loss values is 2-6, which is crucially dependent on the wireless propagation scenario chosen. It is also noteworthy that path loss exponent (n) for the free space is : n=2. As the obstructions in any given scenario keep on increasing, the value of path loss exponent in that propagation environment also starts increasing depicting the complexity to accurately model the wireless channel.
1 2 3
0 20 40 60 80 100 120 140
G1
G2
G3
Distance(m)
P
a
th
l
o
s
s
(d
B
)
Free space path loss model
0-100m 0-100m 0-100m
G1 Gt1= 6.7
Gr1= 6.7
G2 Gt2=6.7
Gr2=3.4
G3 Gt3=3.4
Table 2- Path loss exponent [4].
Figure 5- Log-Distance path loss model without noise threshold
Similarly, Figure 5 depicts that the log-distance path loss given in Equation (15) varies directly proportional to the path loss exponent n.
B. Power Delay Profile
Multipath propagation is the inevitable phenomenon in any wireless propagation channel which have several implications on the different parameters of the wireless channel. Although, it is quite dominant in the NLOS(non-line of sight) conditions, but it could be equally encountered in the LOS (line of sight)conditions as well due to presence of different scatterers. As a result of this, delay and attenuation experienced by the electromagnetic rays induces the frequency selectivity in the channel. Therefore, in light of this, wireless channel parameter- PDP (power delay profile) is used to measure the relative amplitude strength of the received electromagnetic ray signal associated with a given multipath delay.
PPDP(itav, k∆) = ∑ ∑ |ℎ(
( )
rep , k∆ , p)|2 (16)
1 2 3
-200 -150 -100 -50 0 50 100 150 200 250 300
Distance(m)
p
a
th
l
o
s
s
(
d
B
)
log-distance path loss model
n=2 n=3
n=6
0-100m 0-100m 0-100m
Environment Path loss exponent (n)
Free space 2
Urban area cellular radio 2.7–3.5 Shadowed urban cellular radio 3–5
Indoor line-of-sight 1.6–1.8
Obstructed ( building) 4–6
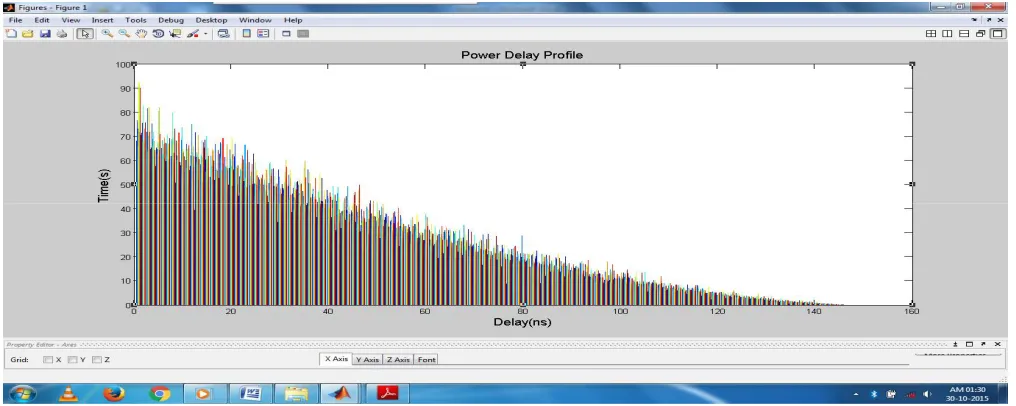
Figure 6(a) shows the average power delay profile for 70s
Using equation (16) we obtained average PDP for 70s and 100s measurement run. Figure 6(a) & (b) shows the delay decreasing until vehicle passing.
Table 3: This table lists all the simulation parameters required for simulation of a scenario
In the above table no.3, we have defined the required parameters which are needed by the equations we mentioned earlier. All these parameters will help model the scenario very realistic physical environment and will help generate a realistic results as evident by further results mentioned ahead. We used a 5.2 GHz carrier wave because 2.4 GHz wave has resonance with water molecules and thus it has a high attenuation factor affected by humidity. This is done only to help us with the computation.
VII. RESULTS AND DISCUSSIONS
In this section we will discuss about the results obtained by our simulation and we will find the implications of the same.
Fig.7 This figure shows the Path loss with distance generated based on our simulation model.
Sr. No. Parameter Value
1 Centre frequency 5.2 GHz
2 Measurement bandwidth, BW 240 MHz
3 Delay resolution, ∆ = 1/BW 4.17 ns
4 Transmit power, PTx 27 dBm = 500mW = 0.5W
5 Test signal length, max 3.2 s
6 Number of Tx antenna elements, NTx 4
7 Number of Rx antenna elements, NRx 4
8 Snapshot time, tsnap 102.4 s
9 Snapshot repetition time, trep 307.2 s
10 Number of snapshots in time, Nt 32500
11 Recording time, trec 10s
12 File size, FS 1GB
13 Tx antenna height, hTx 2.4 m
14 Rx antenna height, hRx 2.4 m
15 No. Of Samples in frequency Nf 769
16 Average Tx-Rx Antenna gain 6.7 dB
17 No. Of Wavelengths 40
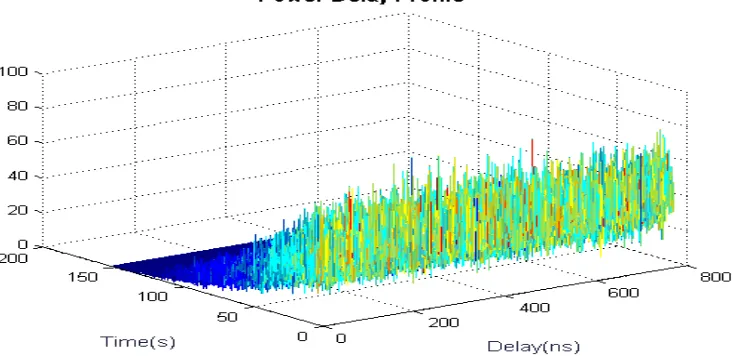
We have setup our simulation using the parameters presented in the Table 3. The results of our simulation are shown in the graphs that follow in Fig 7 and Fig 8.
Fig 8: The 3D plot shows the Power-Delay Profiles for 16 paths.
The path loss model shows a very realistic result if compared to the previous work presented in [10]. This graph implicate that due to very high precision of simulation, we have generated very realistic results of a path loss that occurs in a very complex wireless scenerio. Of course, some limitations are there when compared to a real plot and this accounts for some reflective surfaces that were not taken into account in simulation scenarios.
This power delay profile is generated for 16 simultaneous paths and is shown as a 3D graph also known as a spectrum. This spectrum has three parameters, the simulation time and delay in nanosecond and the attenuation in dBm. This result shows a very similar prediction as mentioned previously. We can see few high power signals which are quite parallel to the LOS path signal (spikes). These are paths reflected from vehicles having same velocity as the receiver’s. A few very high spikes are the paths reflected from nearby infrastructure.
VIII. CONCLUSION
In this paper, we have presented a MATLAB based simulation of the path loss model in V2X network used in Intelligent Traffic System. The presented simulation uses real life physics modelling using advanced 3D computations of path loss model, power-delay profile (PDP), Doppler-delay spectrum, and environment scenario etc. The resulting computations generate a simulation of path loss in V2X network with accuracies comparable to real experimental results presented in [10]. The advantage of providing such simulation is easy setup of a complicated simulation scenario or scenarios wherein real experimental setup is not feasible like a natural calamity, and be ensured about the accuracy of the results comparable to real experiment within experimental errors.
REFERENCES
1. Cheng-Xiang Wang, Xiang Cheng & David I. Laurenson. 2009, ‘Vehicle-to-vehicle channel modeling and measurements: Recent advances
and future challenges’, IEEE Communications Magazine, vol. 47, no. 11, pp. 96{103, November 2009.
2. Herman Fernández et al. 2013,” Path Loss Modeling for Vehicular System Performance and Communication Protocols Evaluation” Journal Mobile Networks and Applications, vol. 18 Issue 6,Pages 755-765, December 2013.
3. Mate Boban et al. 2013,” Modeling vehicle-to-vehicle line of sight channels and its impact on application-layer performance” ISBN: 978-1-4503-2073-3
4. Yong cho soo, Jaekwon Kim, Won Young Yang, Chung-Gu Kang, MIMI –OFDM Wireless Communication with MATLAB, John Wiley &
Sons Publications book.
6. A. G. Zajic et al., “Wideband MIMO mobile-to-mobile Channels: Geometry-Based Statistical Modeling with Experimental Verification,”
IEEE Trans. Vehic. Tech., vol.58, no. 2, pp. 517–34, Feb. 2009.
7. I. Sen and D. W. Matolak, “Vehicle-Vehicle Channel Models for the 5-GHz Band,” IEEE Trans. Intelligent Transportation System., vol. 9, no. 2, pp. 235–45, June 2008.
8. L. Cheng et al., “Mobile Vehicle-to-Vehicle Narrowband Channel Measurement and Characterization of the 5.9 GHz Dedicated Short Range Communication (DSRC) Frequency Band,” IEEE JSAC, vol. 25, no. 8, pp. 1501–16, Oct. 2007.
9. A. Paier et al., “Characterization of Vehicle-to-Vehicle Radio Channels from Measurements at 5.2 GHz,” Wireless Personal Commun., June 2008.
10. G. Acosta and M. A. Ingram, “Six Time-and Frequency-Selective Empirical Channel Models for Vehicular Wireless LANs,” IEEE Vehic. Tech. Mag., vol. 2, no. 4, pp. 4–11, Dec.2007.
11. Taimoor Abbas, Andreas Thiel, Thomas Zemen, Christoph F. And Fredrik Tufvesson,” Validation of a non-line-of-sight for V2V Communications at street intersections”.
12. Paier Alexander, Johan Karedal, et al.,” Car-to-Car radio channel measurements at 5GHz: Pathloss, power-delay profile, and delay-Doppler spectrum” IEEE,2007.
13. Friis, H.T. (1946) A note on a simple transmission formula. Proc. IRE, 34(5), 254–256.
14. Henry Leung, Nour-Eddin El Faouzi and Ajeesh Kurian, ―Intelligent Transportation System (ITS), Information Fusion 12 (2011) 2–3, ELSEVIER, January, 2008..
![Table 2- Path loss exponent [4].](https://thumb-us.123doks.com/thumbv2/123dok_us/1645003.1205732/7.595.83.451.196.522/table-path-loss-exponent.webp)