Power Distribution Fault Cause Identification With
Imbalanced Data Using the Data Mining-Based
Fuzzy Classification
E
-Algorithm
Le Xu
, Student Member, IEEE
, Mo-Yuen Chow
, Senior Member, IEEE
, and Leroy S. Taylor
, Member, IEEE
Abstract—Power distribution systems have been significantly af-fected by many outage-causing events. Good fault cause identifica-tion can help expedite the restoraidentifica-tion procedure and improve the system reliability. However, the data imbalance issue in many real-world data sets often degrades the fault cause identification per-formance. In this paper, the -algorithm, which is extended from the fuzzy classification algorithm by Ishibuchiet al.to alleviate the effect of imbalanced data constitution, is applied to Duke Energy outage data for distribution fault cause identification. Three major outage causes (tree, animal, and lightning) are used as prototypes. The performance of -algorithm on real-world imbalanced data is compared with artificial neural network. The results show that the -algorithm can greatly improve the performance when the data are imbalanced.
Index Terms—Data imbalance, data mining, fault cause identifi-cation, fuzzy classifiidentifi-cation, g-mean, neural network, power distri-bution systems.
I. INTRODUCTION
P
OWER distribution systems are one vital lifeline of the modern society for maintaining adequate and reliable flows of energy. The geographically dispersed power distribution systems are under various dynamic operating environments; they have been significantly affected by various outage-causing events such as equipment failures, animal contacts, trees, lightning strikes, etc. It is important to diagnose the faults and restore the systems in a timely manner in order to maintain their vitality.In order to enhance the reliability as well as the availability of power distribution systems, their management systems need to have proper and speedy responses to outages. However, many utilities, for safety reasons, do not restore the faulty sections until they have found the outage causes. The whole restoration process may take from tens of minutes to hours. Linemen may often need to walk along the power distribution lines, which can be miles, in an attempt to find the outage evidences (e.g., burn marks on the pole for possible lightning faults, dead an-imal bodies for possible anan-imal faults) and to ensure safety (e.g., no down distribution lines) prior to re-energizing the system.
Manuscript received May 26, 2006; revised August 5, 2006. This work is supported by the National Science Foundation under Grant ECS-0245383. Paper no. TPWRS-00311-2006.
L. Xu and M.-Y. Chow are with the Department of Electrical and Computer Engineering, North Carolina State University, Raleigh, NC 27695 USA (e-mail: [email protected]; [email protected]).
L. S. Taylor is with Duke Energy, Distribution Standard, Charlotte, NC 28201 USA (e-mail: [email protected]).
Digital Object Identifier 10.1109/TPWRS.2006.888990
Sometimes, linemen need to call the dispatch center for appro-priate crews to execute specific advanced tasks. For instance, tree crews may be requested to remove fallen trees in order to restore the system.
Many different methods have been investigated to locate the fault [1], [2]; on the other hand, effective fault cause identifica-tion can also provide valuable informaidentifica-tion to narrow down the areas that have to be searched so as to speed up the restoration and improve the system reliability and availability. For example, the dispatch center can inform the linemen to focus on cer-tain types of outage causes or even dispatch appropriate crews earlier to restore the system. Power distribution systems fault cause identification can be viewed as a classification problem in the sense that operators try to categorize a reported outage into one of the existing fault cause classes that have been care-fully arranged by domain experts. Various works make use of the measured currents and voltages to gain fault cause informa-tion [3], [4]. With the development of data mining techniques, a large number of researches have studied the applications of data mining approaches to power systems [5], [6]; some researches [7], [8] have utilized the historical power distribution outage data (which usually contain additional information such as en-vironmental factors) to extract fault patterns. However, many real-world outage data are imbalanced [9], i.e., at least one of the classes significantly outnumbers other classes. Since most com-monly used classification methods aim to minimize the overall error rate, imbalanced data may cause a biased classification performance [10]: a high accuracy on the majority class but a very low accuracy on the minority class.
The -algorithm has been extended from the fuzzy classifi-cation algorithm proposed by Ishibuchiet al.[11] to alleviate the effect of data imbalance [12]. In this paper, the -algorithm is applied to Duke Energy distribution outage data to illustrate its effectiveness for power distribution system fault cause iden-tification with imbalanced data. Three top customer interruption causes in Duke Energy (and in most utilities [13]) are used as prototypes: tree, animal contact, and lightning strike; the data constitution is imbalanced with respect to each prototyping fault cause. The performance of the -algorithm is compared with ar-tificial neural network (ANN) that has been studied in our pre-vious works [14], [15] and extensively applied in power systems studies [16], [17].
Section II introduces the data mining-based fuzzy classifica-tion -algorithm. Section III briefly describes power distribu-tion fault cause identificadistribu-tion using Duke Energy outage data. Section IV presents the performance of the -algorithm on fault cause identification and compares it with that of ANN.
II. E-ALGORITHM
Ishibuchi et al. have proposed an elegant fuzzy classifica-tion algorithm that demonstrates great capabilities to classify well-preprocessed data sets (e.g., little data noises, balanced data, and no outliers); however, it may not achieve a compa-rably good performance on imbalanced data. Its modification and extension, -algorithm, is able to effectively alleviate the influence of data imbalance.
A. Fuzzy Sets and Fuzzy Rules
A fuzzy classification system has two key elements: fuzzy sets and fuzzy rules. A fuzzy set can be fully defined by its membership function. Fuzzy rules offer human-like reasoning capabilities and provide transparent inference mechanisms.
Fuzzy rules are usually expressed as an if-then form. As-suming a fuzzy classification system with rules, inputs, and outputs (in this paper, we only consider the case with single output attribute, so ), the th rule is expressed as
(1) where is the fuzzy set for input attribute in rule , and is the fuzzy set for output at-tribute in rule . Fuzzy rules can also be expressed in vector forms
where (2)
The determination of both fuzzy membership functions and fuzzy rules usually requires sufficient domain knowledge from experts. It can be a challenging task to develop a good fuzzy classification system without adequate domain knowledge. However, the -algorithm extracts both fuzzy set membership functions and fuzzy rules from data by utilizing the statistical information revealed by the normalized fuzzy versions of data mining measures supportand confidenceso that an effective fuzzy classification system can be developed even in short of domain knowledge [12].
B. Support and Confidence
The association analysis in data mining discovers meaningful relationships among attributes in the form of association rules [18] (only one consequent attribute is considered in this paper). Association rules have the same format as fuzzy rules; they indicate that the data satisfying the antecedent part are also likely to satisfy the consequent part .
Support measures how often the antecedent attributes ( is the number of association rules) and the consequent attribute occur together.Confidence measures how likely it is that the consequent attribute occurs when the antecedent attributesX have occurred
support (3)
confidence
(4) where is the probability operator.
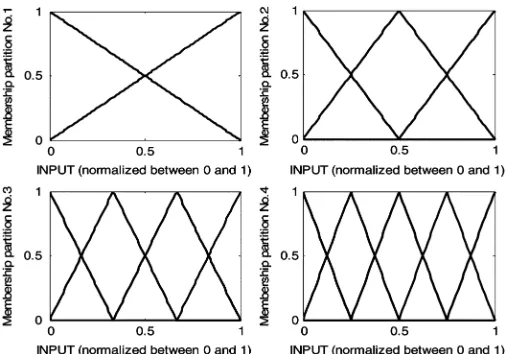
Fig. 1. Four fuzzy partitions for each attribute membership function.
These two measures are extended into fuzzy versions using the compatibility grade [19] of a data sample with a rule. Thecompatibility gradeof with the th rule is denoted as
(5) where is the th data sample, , where is the total number of data sam-ples, is the number of attributes in each data sample, and represents the membership of the attribute in relation to the antecedent fuzzy set of the rule .
The normalized fuzzy version ofsupport, , is defined as the ratio of the normalized sum of the compatibility grades of class data with the th rule to the number of data samples
(6) The normalized fuzzy version ofconfidence, , is defined as the percentage of the normalized sum of compat-ibility grades of class data with the th rule to the sum of compatibility grades of all data samples with the th rule
(7)
C. Membership Functions
Since the appropriate fuzzy set partitions for each attribute is unknowna priori, the -algorithm simultaneously uses four fuzzy set partitions for each attribute, as shown in Fig. 1. As a result, each antecedent attribute is initially associated with 14 fuzzy sets generated by these four partitions as well as a special “do not care” set (i.e., 15 in total).
D. Fuzzy Rules
The -algorithm first enumerates all the possible tions of antecedent fuzzy sets and then assigns each combina-tion a consequent part to generate a rule; all these rules form an initial rule population. Since each antecedent attribute corre-sponds to 15 possible fuzzy sets, the total number of possible combinations of antecedent fuzzy sets for attributes is , which increases exponentially with . In order to reduce the computational demand, only the rules with less than or equal to three antecedent attributes are generated in this paper; it is also a common practice in Ishibuchiet al.’s work [11]. As shown in (5), the compatibility grade is the product of several member-ship values. Since membermember-ship values are always no larger than one, the longer the rule is, the more membership values are in-cluded to calculate the compatibility grade of a data sample with the rule, and then the smaller the compatibility grade usually is. Thus, only short rules are logically included to reduce the com-puting requirement while keeping the reasonable performance. Each antecedent fuzzy set’s combination corresponds to one fuzzy rule once its consequence is specified. The consequence is determined by (8): the class that gets the maximum confi-dence value given the antecedent fuzzy sets combination is assigned as the rule consequence
(8) where is the total number of classes.
The -algorithm further assigns each rule a certainty grade as the rule weight. The certainty grade is the difference between the maximum confidence value and the second largest confidence value given
(9)
where .
Using the product of and as the measure, a user-defined number rules for each class are chosen by trial and error from the initial rule population (in this paper, ). These winning rules form the fuzzy classifi-cation rule base extracted from the data and are responsible to make decisions in classification tasks.
E. Fuzzy Classification
When implementing fuzzy classification tasks on test data, the single winner rule method [19] is employed. For any test data , the single winner rule method chooses from the fuzzy classification rule base a rule that yields the maximum product of the compatibility grade with the test data and the certainty grade . This winner rule determines the class to which belongs.
III. POWERDISTRIBUTION SYSTEM FAULT
CAUSEIDENTIFICATION
A. Data Selection
In this paper, Duke Energy distribution outage data are used to illustrate the fault cause identification. Every time an outage
TABLE I
OVERVIEW OFELEMENTS OFEACHINFLUENTIALFACTOR
in Duke Energy distribution systems is detected as a result of the activation of protective devices (e.g., a circuit breaker, a fuse), the relative information is recorded into the data col-lection system. Each outage record consists of 33 information fields, of which six are considered as the most essential and influential factors based on the suggestions from Duke Energy senior distribution engineers and statistical significance test [20]. These six fields are: circuit ID, weather, season, time of day, phases affected,andprotective devices activated. The attribute cause entered by the crew during the restoration process records the actual root cause of the outage; it is used as the class label. Three major customer interruption causes (tree, animal contact, and lightning strike) are used in this paper for illustration purposes.
Based on domain experts’ suggestions and considerations of different geographical features and system status, seven of Duke Energy’s 32 service regions in North Carolina and South Carolina are selected as reasonable service area representations:
Chapel Hill (CH), Clemson (CS), Durham (DH), Greenville (GV), Hickory (HC), Lancaster (LC),andWinston-Salem (WS). These seven regions cover metropolitan areas, cities, towns, rural areas, and wooded areas; these regions also embody both old systems and new systems.
B. Fault Cause Identification Scheme
All the six selected factors are categorical variables as shown in Table I. The categorical variables are transformed into numer-ical variables using the likelihood measure [21] so that they can be used in the -algorithm, which requires numerical inputs in order to determine attributes’ fuzzy memberships in relation to different antecedent fuzzy sets.
The likelihood measure as shown in (10) represents the con-ditional probability of the occurring of an outage caused by a specific fault given a certain condition (e.g., the likelihood of an observed outage caused by tree given icy weather condition)
(10) where refers to fault cause (e.g., tree, lightning), refers to fault-related event or condition (e.g., windy weather, fuse acti-vated), is the number of outages caused by fault under condition is the number of outages under condition , and
Fig. 2. Power distribution fault cause identification schematic diagram.
TABLE II
PROPORTIONS OFTREE-CAUSED, ANIMAL-CAUSED,ANDLIGHTNING-CAUSED
FAULTS INDIFFERENCEREGIONS
mapped to different sets of likelihood measures for different fault causes, even under the same influential condition. It means that the likelihood measures change along with fault causes. As a result, the power distribution fault cause identification scheme shown in Fig. 2 consists of three identical branches in parallel: the tree branch, the animal branch, and the lightning branch. Each branch identifies its designated fault cause. It can be ex-panded to identify more fault causes.
Within each branch, the outage data are first transformed by the likelihood calculation module. The generated likelihood measures are then passed to the classification module, where the -algorithm is applied to determine the class of the inputted outages. Since each branch is only responsible for its designated fault cause, it faces a binary classification task. For instance, the tree branch categorizes the cause of an inputted outage as either tree or nontree, which can be animal contact, lightning strike, or others. The number of the outages by one particular fault cause may only account for a small percentage of the total outages due to the diversity of fault causes (the proportions of tree-caused faults, animal-caused faults, and lightning-caused faults are shown in Table II). Thus, the classifiers always face imbalanced data classification tasks.
The decision fusion module combines the results from different branches into a final classification decision. When different branches reach consistent outage cause estimations, the decision fusion model can make a straightforward decision. When conflicting results happen occasionally, this module
TABLE III CONFUSIONMATRIX
compares the compatibility grades of the test data with the winner rule from each branch chosen by the single winner rule method to determine the outage cause.
IV. RESULTS ANDDISCUSSIONS
The Duke Energy outage data from 1994 to 2002 are used in this paper. In each representative region, the data are divided into training data and test data by year: the outage data from 1994 to 1999 are used as the training set and the remaining data (2000 to 2002) form the test set.
Table II shows proportions of tree-caused, animal-caused, and lightning-caused faults in each region. Lightning-caused faults account for an average proportion of 9.97% in training data and 4.36% in test data. The region of DH only has 1.89% lightning-caused faults in its test dataset. Animal-caused faults have an average proportion of 15.25% in training data and 14.83% in test data. Tree-caused fault is one of the largest outage categories: tree-caused faults have an average proportion of 25.52% in training data and 28.88% in test data. Comparing with the lightning fault and animal fault, it is relatively balanced between tree-caused outage and nontree-caused outage.
The performance of the -algorithm for outage cause iden-tification is compared with a three-layer feed-forward ANN using back-propagation algorithm as investigated in our pre-vious works. The ANN-based fault cause identification employs the same scheme as the one in Fig. 2. Due to its randomness property, ANN is run 30 times for each case in order to generate statistically representative results. In this paper, only the results from individual branches are presented in order to demonstrate the performance of two methods on imbalanced data.
A. Performance Measure
When the data are imbalanced, the conventional performance measure of the overall classification accuracy can be misleading. Take a two-class imbalanced data set as an example. Assume that 95% of the data are from the majority class , while only 5% of the data are from the minority class . If a classifier blindly categorizes every case into class , it can still achieve an overall accuracy as high as 95% without even processing the data, which is certainly undesirable. Kubatet al.have proposed the g-mean [22] to evaluate the classification performance on imbalanced data sets. The g-mean is developed from confusion matrix as shown in Table III (assuming the tree/animal/lightning faults are positive classes and nontree/nonanimal/nonlightning faults as negative classes).
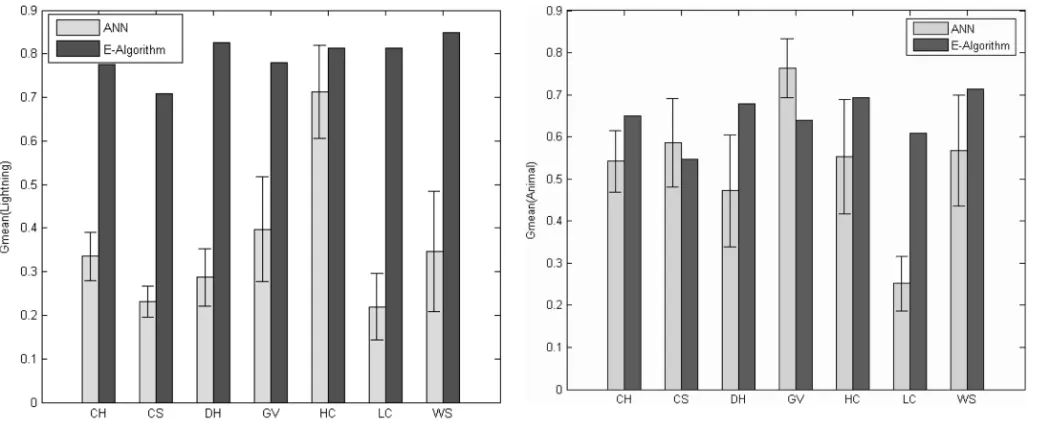
Fig. 3. G-means for lightning fault identification (test data).
and punishes large disparities between them; it is mathemati-cally described as
(11) The basic idea behind the g-mean is to maximize the accura-cies on both classes: the g-mean is large when both and are large and the difference between and is small, i.e., the classification accuracies on both positive and neg-ative classes are high and there is no large disparity between them, which represents a balanced performance.
B. Results
The g-means achieved by the -algorithm and ANN on test data for lightning/animal/tree fault are presented in Figs. 3–5, respectively. The performance of ANN is based on its 30-run results: the height of the vertical bars in the figures represents the mean value, and the “whisker” represents its 95% confidence intervals. The -algorithm has deterministic results once , the number of rules to be included in the fuzzy classification rule base , has been decided, so only the actual value is presented as the height of the corresponding vertical bar. The region names have been defined in Section III-A.
One-sample tests of hypothesis are also performed on the ex-perimental data to determine whether the -algorithm provides higher g-means statistically than ANN does. That is
(12) is tested against
(13) The decision is made based on P-values of the tests that show the probability of obtaining the existing experimental data given the null hypothesis [23]; so a low P-value leads to the rejection
Fig. 4. G-means for animal fault identification (test data).
Fig. 5. G-means for tree fault identification (test data).
TABLE IV
P-VALUES OFONE-SAMPLETESTS OFHYPOTHESIS ONG-MEANS
of the null hypothesis. The commonly used level of significance 0.95 is chosen in this paper; so a P-value under 0.05 will re-ject the null hypothesis in favor of the alternative hypothesis. Table IV presents the P-values of the one-sample tests of hy-pothesis on g-means achieved by the -algorithm and ANN.
much as 271%. In Table IV, the P-values of the one-sample tests of hypothesis for lightning-caused faults are smaller than 0.05 in all seven regions. Thus, the null hypothesis is rejected in favor of the alter-native hypothesis ; in another words, it can be concluded that the g-mean by the -algorithm is larger than the average g-mean by ANN.
Although the -algorithm consistently achieves higher per-formance than ANN for lightning-caused faults in all the seven selected regions, the similar clear-cut conclusions cannot be drawn for the other two fault causes.
As shown in Fig. 4, the g-means by the -algorithm for an-imal-caused fault are larger than the average g-means by ANN in five regions but are smaller in two regions: CS and GV. The one-sample tests of hypothesis also indicate that the -algo-rithm outperforms ANN in five regions and ANN actually has a larger g-mean value than the -algorithm in the region of GV; the conclusion cannot be drawn for the remaining region CS at the significance level of 0.95.
Similarly, the -algorithm for tree-caused faults has larger g-means in four regions but smaller g-means in CH, CS, and WS comparing with ANN, as shown in Fig. 5. The results of one-sample tests of hypothesis in Table IV show that the -algorithm outperforms ANN in four regions and gets smaller g-means in CS and WS. The conclusion cannot be made for the region of CH at the significance level of 0.95.
C. Discussions
When implementing classification tasks, a standard ANN with back-propagation algorithm aims to minimize the overall error rate. For an imbalanced data set, the majority class has dominant influence on the overall error since ANN tends to prioritize the different classes in favor of the class with more training data examples in order to achieve a high overall ac-curacy. This biased favor may sacrifice the performance on classifying minority class and achieves a high accuracy on the majority class but a very low, sometimes unacceptable, accuracy on the minority class.
The -algorithm extracted qualified classification rules from the data based on the statistical information revealed by two normalized fuzzy versions of data mining concepts: support
andconfidence ; the normalization of these measures, as shown in (6) and (7), alleviates the effect of data imbalanced constitution [12].
Based on the comparisons, the -algorithm achieves larger g-mean values than ANN in most of the cases. It is also noticed that with the increase of outage proportion, the dominance of the -algorithm over ANN is weakened: the average propor-tion of lightning faults, animal faults, and tree faults is in an ascending order as shown in Table II, while -algorithm out-performs ANN in all the seven regions for lightning faults, five regions for animal faults, and only four regions for tree faults.
We further examine the individual cases in Table II. It is ob-served that animal faults do not necessarily account for more percentage than lightning faults; neither do tree faults with imal faults. For example, the region of LC only has 7.46% an-imal faults, while the region of WS has 9.72% lightning faults; the region of WS only has 21.90% tree faults, while the region of
Fig. 6. Relationship between the increase of g-means and the percentage of positive classes.
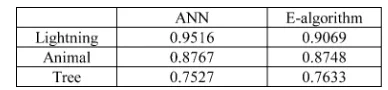
TABLE V
CAUSE-AVERAGEDOVERALLACCURACY BYANNANDE-ALGORITHM
CS has 22.56% of animal faults. Therefore, we disregard the cat-egories of fault causes to further investigate the relationship be-tween the increase of g-mean values and the percentage of pos-itive classes (lightning/animal/tree faults), as shown in Fig. 6.
A simple linear regression model in Fig. 6 demonstrates the relationship between the percentage of positive classes (which can be animal fault, tree fault, or lightning fault) and the increase of g-mean values of the -algorithm over ANN. This straight-line function in the figure is expressed as
(14) As the percentage of positive classes gets larger, the increase of the g-mean values gets smaller. It means that when the data balance issue gets less severe (i.e., the data are more balanced), the improvement of the -algorithm over ANN gets smaller; when the data constitution is relatively balanced, the -algo-rithm does not show significant superiority over ANN.
Comparing with lightning strike and animal contact, tree fault diagnosis is more complicated: the tree fault category in Duke Energy outage database includes a few subcategories such as trees, danger trees, and vines, which diversifies the fault patterns; tree faults are closely related with many influential factors (such as weather condition, geographic information, tree trimming cycle, and human activities), many of which are not captured by the measurements or not presented in the outage database. As we can see in Table V, the accuracy of tree-caused outage identification is lower than the other two outage causes. Considering that the results are based on real-world data, the -algorithm does achieve a satisfactory performance. Dispatchers can use the algorithm with more confidence on lightning-caused faults, followed by animal-caused faults, and then tree-caused faults.
Other than its advantage in classifying imbalanced data, the -algorithm can extract fuzzy rules from the data to help ex-plain the inference mechanism of outage cause identification; this is the generally acknowledged advantage of a fuzzy clas-sification technique. A few rule examples for lightning-caused faults are as follows.
1) IF the likelihood measure of weather is medium (according to membership partition No. 4 in Fig. 1) AND the like-lihood measure of phases affected is high (according to membership partition No. 1 in Fig. 1), THEN the outage is likely to be caused by lightning.
2) IF the likelihood measure of weather is low (according to membership partition No. 1 in Fig. 1), THEN the outage is not likely to be caused by lightning.
As presented in Section II-C, the -algorithm simultaneously applies four membership partitions, as shown in Fig. 1, to each attribute and then chooses the antecedent fuzzy set combina-tions that have more statistical support to implement the clas-sification task. The attributes within a chosen combination do not have to follow the same partition. For example, the first an-tecedent attribute in rule example 1 uses membership partition No. 4 (as labeled in Fig. 1) while the second antecedent attribute uses membership partition No. 1.
V. CONCLUSION
Effective power outage cause identification can help expedite the restoration procedure and improve the distribution system reliability and availability. However, the data imbalance issue encountered in many real-world data sets often affects the per-formance of fault cause identification, especially for minority-class causes, since most commonly used methods aim to min-imize the overall error rate. In this paper, the -algorithm that is extended from the elegant fuzzy classification algorithm by Ishibuchiet al.for imbalanced data is applied to Duke Energy distribution outage data for cause identification. Its performance in terms of g-mean, the performance measure for imbalanced classification, is compared with ANN investigated in our pre-vious works. The results show that the -algorithm can achieve better performance when the data are imbalanced; the superi-ority is proportional to the severeness of the data imbalance.
REFERENCES
[1] C.-F. Chien, S.-L. Chen, and Y.-S. Lin, “Using Bayesian network for fault location on distribution feeder,”IEEE Trans. Power Del., vol. 17, no. 3, pp. 785–793, Jul. 2002.
[2] D. Thukaram, H. P. Khincha, and H. P. Vijaynarasimha, “Artificial neural network and support vector machine approach for locating faults in radial distribution systems,”IEEE Trans. Power Del., vol. 20, no. 2, pp. 710–721, Apr. 2005.
[3] O. Dag and C. Ucak, “Fault classification for power distribution systems via a combined wavelet-neural approach,” inProc. Int. Conf. Power System Technology, 2004, pp. 1309–1314.
[4] K. L. Butler and J. A. Momoh, “A neural net based approach for fault diagnosis in distribution networks,” inProc. IEEE Power Eng. Soc. Winter Meeting, 2000, pp. 1275–1278.
[5] S. Santoso and J. D. Lamoree, “Power quality data analysis: From raw data to knowledge using knowledge discovery approach,” inProc. IEEE Power Eng. Soc. Summer Meeting, 2000, vol. 1, pp. 172–177. [6] H. M. Dola and B. H. Chowdhury, “Data mining for distribution system
fault classification,” inProc. Annu. North Amer. Power Symp., 2005, pp. 457–462.
[7] J. T. Peng, C. F. Chien, and T. L. B. Tseng, “Rough set theory for data mining for fault diagnosis on distribution feeder,”Proc. Inst. Elect. Eng., Gen., Transm., Distrib., vol. 151, no. 6, pp. 689–697, Nov. 2004.
[8] L. Xu, M.-Y. Chow, and X. Z. Gao, “Comparisons of logistic regres-sion and artificial neural network on power distribution systems fault cause identification,” inProc. IEEE Mid-Summer Workshop Soft Com-puting Industrial Applications, 2005, pp. 128–131.
[9] L. Xu and M.-Y. Chow, “Power distribution systems fault cause identi-fication using logistic regression and artificial neural network,” inProc. Int. Conf. Intelligent Systems Application Power Systems, 2005, pp. 163–168.
[10] C. Chen, A. Liaw, and L. Breiman, Using Random Forest to Learn Imbalanced Data. [Online]. Available: www.stat.berkeley.edu/users/ chenchao/666.pdf.
[11] H. Ishibuchi and T. Yamamoto, “Comparison of heuristic rule weight specification methods,” inProc. IEEE Int. Conf. Fuzzy Systems, 2002, pp. 908–913.
[12] L. Xu, M.-Y. Chow, and L. S. Taylor, “Data mining based fuzzy clas-sification algorithm for imbalanced data,” inProc. IEEE World Congr. Computational Intelligence, 2006, pp. 4216–4221.
[13] R. E. Brown, Electric Power Distribution Reliability. Boca Raton, FL: CRC, 2002.
[14] L. Xu and M.-Y. Chow, “A classification approach for power distribu-tion systems fault cause identificadistribu-tion,”IEEE Trans. Power Syst., vol. 21, no. 1, pp. 53–60, Feb. 2006.
[15] M.-Y. Chow, S. O. Yee, and L. S. Taylor, “Recognizing animal-caused faults in power distribution systems using artificial neural networks,”
IEEE Trans. Power Del., vol. 8, no. 3, pp. 1268–1274, Jul. 1993. [16] D. Niebur and A. J. Germond, “Power flow classification for static
se-curity assessment,” inProc. Int. Forum Applications Neural Networks Power Systems, 1991, pp. 83–88.
[17] Y. Hayashi, S. Iwamoto, S. Furuya, and C.-C. Liu, “Efficient determi-nation of optimal radial power system structure using Hopfield neural network with constrained noise,”IEEE Trans. Power Del., vol. 11, no. 3, pp. 1529–1535, Jul. 1996.
[18] J. Han and M. Kamber, Data Mining: Concepts and Techniques. San Francisco, CA: Morgan Kaufmann, 2001.
[19] H. Ishibuchi, T. Nakashima, and T. Murata, “Voting in fuzzy rule-based systems for pattern classification problems,”Fuzzy Sets Syst., vol. 103, no. 2, pp. 223–238, 1999.
[20] L. Xu, M.-Y. Chow, and L. S. Taylor, “Analysis of tree-caused faults in power distribution systems,” inProc. North Amer. Power Symp., Oct. 20–21, 2003.
[21] M.-Y. Chow and L. S. Taylor, “Analysis and prevention of animal-caused faults in power distribution systems,”IEEE Trans. Power Del., vol. 10, no. 2, pp. 995–1001, Apr. 1995.
Le Xu(S’01) received the B.Eng. degree in automa-tion from Tsinghua University, Beijing, China, in 2001 and the M.S. degree in electrical engineering from North Carolina State University, Raleigh, in 2003. He is currently pursuing the Ph.D. degree with the Advanced Diagnosis Automation and Control Laboratory at North Carolina State University, Raleigh.
His research interests include intelligent health monitoring of power distribution systems.
Mo-Yuen Chow(S’81–M’82–SM’93) received the B.S. degree in electrical and computer engineering from the University of Wisconsin, Madison, in 1982 and the M.Eng. and Ph.D. degrees from Cornell Uni-versity, Ithaca, NY, in 1983 and 1987, respectively.
Upon completion of the Ph.D. degree, he joined the Department of Electrical and Computer Engi-neering, North Carolina State University, Raleigh, and has held the rank of Professor since 1999. His core technology is diagnosis and control, artificial neural network, and fuzzy logic with applications to areas, including motors, process control, power systems, and communication systems. He has established the Advanced Diagnosis Automation and Control (ADAC) Laboratory at North Carolina State University.
Leroy S. Taylor(M’93) was born in 1949 in Greenville, NC. He received the B.A. degree in physics from the University of North Carolina in 1971
He is a Senior Distribution Engineer for Duke Energy, Charlotte, NC. Joining Duke Power in 1977, he acquired extensive experience in distribution system engineering, operation, and construction. Since 1987, he has conducted inten-sive investigation on the cause of power quality disturbances that originate in the distribution system. He has also redesigned several Duke Power mainframe reporting systems used to evaluate and improve distribution system reliability and power quality.