DOI: 10.1534/genetics.110.116319
Analysis of Multiple Ethyl Methanesulfonate-Mutagenized
Caenorhabditis
elegans
Strains by Whole-Genome Sequencing
Sumeet Sarin
,*
Vincent Bertrand
,*
Henry Bigelow
,*
,†Alexander Boyanov
,*
Maria Doitsidou
,*
Richard J. Poole
,*
Surinder Narula
* and
Oliver Hobert
*
,1*Department of Biochemistry and Molecular Biophysics, Howard Hughes Medical Institute, Columbia University Medical Center, New York, New York 10032 and†Broad Institute, Cambridge, Massachusetts 02141
Manuscript received March 3, 2010 Accepted for publication April 28, 2010
ABSTRACT
Whole-genome sequencing (WGS) of organisms displaying a specific mutant phenotype is a powerful approach to identify the genetic determinants of a plethora of biological processes. We have previously validated the feasibility of this approach by identifying a point-mutated locus responsible for a specific
phenotype, observed in an ethyl methanesulfonate (EMS)-mutagenizedCaenorhabditis elegansstrain. Here
we describe the genome-wide mutational profile of 17 EMS-mutagenized genomes as assessed with a bioinformatic pipeline, called MAQGene. Surprisingly, we find that while outcrossing mutagenized strains does reduce the total number of mutations, a striking mutational load is still observed even in outcrossed strains. Such genetic complexity has to be taken into account when establishing a causative relationship between genotype and phenotype. Even though unintentional, the 17 sequenced strains described here provide a resource of allelic variants in almost 1000 genes, including 62 premature stop codons, which
represent candidate knockout alleles that will be of further use for theC. eleganscommunity to study gene
function.
I
NDUCING molecular lesions in a genome is an effective approach to interrogate the genome for its functional elements. Molecular lesions can be induced using a variety of methods. Because of their efficiency and their ability to generate alleles with various different alterations in gene activity (e.g., amorphic, antimorphic, hypomorphic, and hypermorphic), chemical mutagens, such as ethyl methanesulfonate (EMS), are frequently used in genetic mutant screens (Anderson 1995). However, due to mutagen efficiency, a mutant animal selected for a single-locus phenotype invariably contains EMS-induced ‘‘background mutations’’ in its genome. Experimenters try to minimize the potential impact of background mutations through outcrossing to animals with a wild-type genome. Yet no full snapshots of genome sequences right after EMS mutagenesis and after outcrossing have so far been provided to illustrate the extent of background mutations and the extent to which they can indeed be eliminated.Another caveat of using base-changing chemical mutagens is the relative difficulty associated with iden-tifying the phenotype-causing molecular lesion. In
multicellular genetic model organisms, mutant identi-fication involves time-consuming positional cloning approaches, usually involving breeding with genetically marked strains that allow pinpointing of the location of a molecular lesion. Even with rapid, SNP-based mapping approaches in animals with short generation times, such asCaenorhabditis elegans, substantial time hurdles, partic-ularly in the final, fine-mapping stages, still exist. Con-ceptually similar problems in defining the location of a molecular lesion are encountered by human geneticists who attempt to identify disease-causing genetic lesions. Whole-genome sequencing (WGS) is beginning to emerge as an efficient and cost-effective tool to shortcut time-consuming mapping and positional cloning efforts (Hobert 2010). The sequencing of an entire genome and its ensuing comparison to a wild-type reference genome can potentially directly pinpoint the molecular lesion that results in the mutant phenotype the animal has been selected for. Proof-of-concept studies in bacte-ria, yeast, plants, worms, and flies have validated the applicability of this approach (Sarinet al. 2008; Smith et al. 2008; Srivatsan et al. 2008; Blumenstiel et al. 2009; Irvineet al. 2009; Flowerset al. 2010).
Present-day deep sequencing platforms used for WGS generate relatively short sequence reads, thereby posing the bioinformatic challenge to align those reads to a reference genome. We previously described a software pipeline, MAQGene, which is based on the standard alignment program MAQ (Liet al. 2008) and facilitates Supporting information is available online athttp://www.genetics.org/
cgi/content/full/genetics.110.116319/DC1.
1Corresponding author: Department of Biochemistry and Molecular
Biophysics, Howard Hughes Medical Institute, Columbia University Medical Center, New York, New York 10032.
E-mail: [email protected]
this bioinformatic step by providing the end user with an extensively curated list of sequence variants from a WGS run of a mutated genome compared to a reference genome (Bigelowet al. 2009). This pipeline can be used for well-annotated, assembled genomes, such asC. elegans or Drosophila. In this article, we describe that this pipeline can identify not only point mutations but also deletions. We then use this pipeline to analyze a total of 17 EMS-mutagenized genomes. We find that EMS-mutagen-ized genomes carry a significant mutational load in-cluding presumptive loss-of-function alleles in several protein-coding genes that can lead to synthetic genetic interactions, one of which we describe here in more detail. We show that outcrossing to wild-type animals can lighten the mutational load; however, a substantial number of sequence variants are also introduced during outcrossing. Even though background mutations un-covered by WGS may complicate the interpretation of mutant phenotypes, they do provide a potentially useful source for functional studies of the affected genes.
MATERIALS AND METHODS
Strains used in this study:Several strains whose sequence we
analyzed on a genome-wide level were previously described:
lsy-12(ot177), lsy-5(ot240), and lsy-22(ot114) (Sarin et al. 2008;
Flowerset al. 2010). Other strains were isolated by screens
for neuronal specification defects in ASE, dopaminergic
neurons,AIY, orOLL. With the exception ofttx-3(ot358), we do not describe here the variant that causes the respective mutant phenotype that we selected for. All strains were
mutagenized with 50 mm EMS, as described (Brenner
1974). F2animals (from the mutagenized P0) displaying the
mutant phenotype of interest were singled out from the population.
Genetic screen for ot358:The genetic screen forAIYcell
fate mutants was done as first described in (Bertrandand
Hobert2009). Briefly, animals containing the chromosomally
integratedttx-3prom::gfpreportermgIs18orotIs173(anAIYcell
fate marker) were mutagenized with EMS and the F2
gener-ation was screened for defects in gfp expression under a
standard dissecting microscope or using a worm sorting machine. We isolated 19 mutant alleles from screening
200,000 haploid genomes. One allele was the previously
describedref-2 allele (Bertrand and Hobert 2009) and 6
alleles failed to complement ttx-3. One of them wasot358,
described here as an enhancer deletion allele, and 5 others
were missense, nonsense, or splice site mutations in thettx-3
coding region (Figure 1C). Other alleles isolated from this screen will be described elsewhere.
WGS procedure: All runs were done in-house on an Illumina Genome Analyzer II platform, with the exception of ot177, ot114, and ot340, which were done by Illumina’s sequence service. For genomic DNA preparation, four 15-cm plates of a confluent population of worms were washed two times in M9 and then incubated in M9 for 30 min at room
temperature to purge the worms’intestines. The worms were
then washed twice with M9. One of two methods was used to isolate the genomic DNA, both of which worked equally well. The first requires the Qiagen Gentra Puregene Kit (cat. nos. 158622, 158667, and 158689) and instructions therein. The
second method uses the following steps: wash with 13NTE,
and lyse worms for 1 hr at 65°with 2 mL proteinase K solution.
Perform three phenol/chloroform extractions, always
keep-ing the aqueous phase. Add 1/10 vol 3mNaOAC, pH 5.2, and
2.5 vol 100% EtOH and spool DNA with a glass pipette. Dissolve in 400 ul TE, add RNAse, and then perform another phenol/chloroform extraction. Precipitate DNA with 1/10 vol
3mNaOAC, pH 5.2, and 2.5 vol20°EtOH. Pellet DNA by
centrifugation at full speed for 15 min. Redissolve in 200ml
TE.
Sequencing outputs (qseq format) were converted to fastq
and directly put into the MAQGene pipeline (Bigelowet al.
2009).
Validation of variants: We validated variants for two pur-poses: first, to gauge the reliability of the WGS bioinformatic
pipeline (see below) and second, to provide the C. elegans
community with validated putative loss-of-function alleles for further functional analysis. We validated variants called by different filtering criteria, a low filter and a stringent filter. The
low filter included variants supported by$2 reads on either
strand, but,60 reads (to exclude highly repetitive regions
that are prone to mismapping). The stringent filter included
variants supported by $3 reads on either strand, but,60
reads. Both filtering criteria used a consensus score.2, loci
multiplicity score,2, and variant read:total read ratio.0.86.
The consensus score is the probability of the consensus base
being correct but expressed in the Phred form (Liet al. 2008;
Bigelowet al. 2009). Validation involved creating 200- to
500-bp amplicons surrounding the variant and then Sanger sequencing. We found the highly stringent criteria to be a good measure for accurately called variants (those that could be confirmed by manual resequencing). Sanger sequencing confirmed 83/90 variants called with the stringent filter while 0/23 variants called with the low filter were confirmed.
Finding variants in conserved coding sequences: We
pre-viously described the incorporation into MAQGene (Bigelow
et al. 2009) of the six-way PhastCons score that identifies conserved elements between multiply aligned species. For nematodes, Phastcons gives a conservation score for each nucleotide, a numerical value (0–1) based on sequence
similarities of sliding 20-bp windows betweenC. elegansand
five related nematode species. The score is weighted on the
basis of best-fit models to phylogenetic data (Siepel et al.
2005). As the MAQGene output includes conservation score, we assessed the ability of this score to predict conservation
betweenC. elegansand human sequences. We used the UCSC
genome browser and manually inputted each position with
conservation score .0 in the C. elegans genome bearing a
missense variant, searching for a homologous human gene in which the affected amino acid was also conserved between the two species. Seventeen of 400 of the variant positions unique to
one data set tested met these criteria (Table S6). We found that
the conservation score did not predict homology betweenC.
elegansand human coding sequences. Specifically, nucleotides
with low conservation scores,i.e., not well conserved between
all nematode species, may indeed be conserved in the corresponding human homologs. Similarly, high conservation
scores (.0.9) did not ensure sequence similarity between
worms and humans.
MAQGene: Update: We implemented a series of improve-ments to the previously published MAQGene platform
(avail-able athttp://maqweb.sourceforge.net). As described in the
original article (Bigelow et al. 2009), the core MAQGene
misleading log messages. Now, the pipeline dependencies are expressed as GNU make rules.
The old pipeline exposed the host machine to the risk of becoming overloaded if users submitted more than one run at a time or if other unrelated processes were running. The new pipeline automatically detects total CPU load and keeps any submitted runs on hold until the machine’s CPU usage falls to the requested level.
The old pipeline implemented parallelism in a fragile way involving monitoring of shell processes. This design was liable to be misled by any other unrelated processes running MAQ. The new pipeline automatically detects any processes that can be run in parallel and uses as many CPUs as the user specifies. Because each link in the dependency graph is expressed as a standalone rule, new links may be added, rearranged, and con-nected without damaging the existing structure. This will greatly facilitate incorporation of new components to MAQGene, for example, the addition of a new aligner or a new annotation category. Robustness to change is of great importance for software in general, since it is time consuming for authors and users to find bugs that may creep in. Incidentally, the Illumina pipeline is also based on GNU make.
Besides these code design changes, a few bugs have been found and repaired. First, a bug in the supporting CisOrtho
software (Bigelow et al. 2004) prevented the reporting of
variants occurring in the first exon of any gene. Second, the
gene relations ‘‘59’’, ‘‘genic’’, ‘‘39’’, have been replaced by
‘‘upstream’’, ‘‘into’’, and ‘‘downstream’’, respectively. The offset field now complies with convention, such that it is the negative of the distance from gene start for ‘‘upstream’’, the positive of the distance from gene start for ‘‘into’’, and the positive of the distance from transcription stop for ‘‘downstream’’.
The installation procedure now automates a few previously required manual steps. The required versions of MAQ, CisOrtho, and samtools binaries are now automatically retrieved, compiled, and tested. While the mysql server must still be configured by hand, the MAQGene installation script now tests to make sure it is correctly configured before proceeding or alerts the user in case requirements are not met. This greatly reduces confusion for users who have not yet met the requirements. For users wanting to update their existing copy, note that the installation script preserves existing results files, although it may overwrite locally configured settings. Once the MAQGene code is updated, build_annotation_tables.sh must also be run for each species previously installed for MAQGene. Typically, this is just the
C. elegansgenome, but this may change in the future.
As a postinstall test, MAQGene now comes with a set of real
reads from theot340mutant previously known to localize to
chromosome I at 11–12 M. Once installation and the building of annotation tables is complete, a folder called ot340 will appear on the web page and the user may immediately test the installation by selecting these and launching a run. Previously, a much smaller set of reads came with the distribution, which was insufficient to do a real test, but provided only a placeholder for the location where new reads data should be placed. This led to confusion as new users attempted to perform actual runs with this prepackaged data.
We added to the MAQGene distribution a new tool for comparing pileup lines for loci of interest across multiple MAQGene runs. The script, pileup_loci_comparison, takes a list of pileup files (each generated by a separate MAQGene run
on a different mutant) and a list of loci as,chromosome.
,position., one entry per line, and then produces a list of the
pileup lines at these specific loci sorted by chromosome, locus, and mutant. This facilitates at-a-glance detection of common background mutations.
Now, in addition to exonic and intronic annotations,
MAQGene associates sequenced variants with 59- and 39-UTRs,
known SNPs, and the noncoding RNA types miRNA, rRNA, scRNA, snoRNA, snRNA, and tRNA. This extra annotation is
available forC. elegansonly, but may be augmented to support
other species if the demand is sufficient and time allows. Finally, we have taken initial steps to port MAQGene to MAC OS X; however, this is still pending. Updates will be
available athttp://maqweb.sourceforge.net.
All of the above improvements and bug fixes have been submitted to the MAQGene sourceforge code repository and are the default current version for new users. Users who have the original version are urged to update. In either case, a fresh install is recommended. Note that existing MAQGene output data or input reads will not be touched by the installation process. To install, run the following commands (assuming a
prompt of ‘$’):
—This will download the MAQGene source into a directory called ‘‘MAQGene’’ (or whatever word you choose at the end of this command)
—The destination directory, MAQGene, in this case, should not exist. If it remains from a previous download, rename it or choose a different name.
$ svn checkout https://maqweb.svn.sourceforge.net/svnroot/
maqweb/trunk MAQGene
$cd MAQGene
Next edit the settings in scr/config.sh:
$su root
$./install.sh
After the prompt, cut-and-paste lines into the Apache httpd.conf file.
If the identical cut-and-paste lines already existed in your httpd.conf file, there is no need to restart httpd. Otherwise, type the following:
$/sbin/service httpd restart
Also, the install.sh script will note the following:
$cd /usr/bin; ./build_annotation_tables.sh
Note that it cannot be run like this:
$/usr/bin/build_annotation_tables.sh
During the running of build_annotation_tables.sh, in C.
elegans, choose ‘‘ce8’’ for genome and ‘‘wormbase’’ for data source.
How to find deletions with MAQGene:To identify deletions in WGS data sets we used the ‘‘uncovered.txt’’ output file. This file reports any noncovered region larger than a chosen threshold. Noncovered regions can reflect true deletions, regions difficult to sequence/map (like repetitive sequences), or missampling due to low coverage. Regions noncovered due to difficulty in sequencing/mapping are removed by compar-ing with another independent WGS data set. The ‘uncover-ed.txt’ file in previous versions of MAQGene is now integrated in the final output as class ‘‘uncovered’’ and description ‘‘codons FIRST to LAST of TOTAL (LENGTH%)’’ for affected protein-coding genes. As usual, the parent_feature column will contain the name of the gene affected. For example, ‘‘codons 5 to 27 of 130 (17%)’’ means that codons 5 through 27 were in an uncovered region of a 130 codon gene, comprising 17% of the total. Uncovered regions entirely within introns of genes are also reported. The original uncovered.txt file is still available for referencing non-genic uncovered regions.’’
RESULTS
ABISolid platform, provides a large amount of short DNA sequence reads (Shendureand Ji 2008). These reads require extensive bioinformatic processing and analysis to identify ‘‘variants,’’i.e., sequence alterations relative to a reference genome. We previously described a software pipeline, MAQGene, that ‘‘wraps’’ the stan-dard alignment program MAQ (Li et al. 2008) into a user-friendly platform and provides simple customized mining of WGS data (Bigelowet al. 2009). One feature of MAQ—and WGS in general—that we aimed to subject to ‘‘real life,’’ proof-of-principle validation is the ability to reliably identify larger deletions, introduced by various mutagens, including EMS or irradiation. In principle, such deletions should appear as ‘‘lack of coverage’’ for genomic intervals; i.e., there should be regions in the genome to which no sequencer-generated reads align. We tested the ability of the WGS approach to reliably identify deletions through sequencing the entire genome of a strain,OH9331, which carries the
ot358allele. This allele was identified in a screen for EMS-induced mutants in which the fate of the AIY interneuron pair is not appropriately executed, as assessed by the expression of agfp-taggedAIYcell fate marker (seematerials and methods) (Bertrandand Hobert 2009) (Figure 1, A and B). The ot358 allele mapped onto the X chromosome within a 0.6-map-unit interval. WGS (single 75 nucleotide reads) of ot358
animals revealed only one, noncoding point variant in this interval (Figure 1C). As EMS can also generate deletions of up to many kilobases, albeit at a lower frequency than base transitions (Anderson1995), we used an output file of MAQGene, which lists regions that are not covered by the short sequencing reads produced by the sequencer (seematerials and methods). We found five noncovered regions of .100 bp in the interval to which we had mapped ot358 (Figure 1D). Three of them are also present in a different mutant strain independently isolated in the same screen (ot354) (Figure 1D); they likely reflect either regions difficult to sequence/map (e.g., repetitive sequences) or deletions initially present in the starting strain for the screen. We analyzed the remaining twoot358-specific noncovered regions by PCR and Sanger sequencing. While the smaller one (103 bp) could not be confirmed, the larger one corresponds to a real deletion of 1888 bp located just a few hundred base pairs upstream of the ttx-3
gene, a homeobox gene known to be involved inAIY development (Hobert et al. 1997). This deletion re-moves acis-regulatory element that we recently identi-fied as regulating ttx-3 expression in the AIY lineage (Bertrandand Hobert2009) (blue box in Figure 1C). Consistent with the possibility that this variant is indeed phenotype causing and affecting thettx-3locus, ot358
fails to complement the canonical ttx-3 allele ot22
and was rescued by a 40-kb piece of genomic DNA (fosmid) containing a wild-type copy ofttx-3(Figure 1, B and C).
To further investigate the reliability with which deletions can be accurately discovered by WGS, we examined the entireot358mutant genome for deletions. The ot358 WGS data set contains a high number of noncovered regions of,500 bp (Figure 1E) likely re-flecting missampling due to the low coverage [11.43; note that in theory such fold coverage is sufficient to reliably identify missense variants (Shen et al. 2008)]. Consistent with this hypothesis, we find that a previously published WGS data set (ot177allele) (Sarinet al. 2008), which has a much higher coverage (28.83), displays far fewer noncovered regions (Figure 1E). Apart from these small noncovered regions, the ot358 WGS data set contains 17 noncovered regions of.500 bp. Fifteen of them are also present in the WGS data set from another mutant,ot354, which was retrieved by the same screen (and therefore has the same genetic starting back-ground). Lack of coverage in these 15 common regions reflects either difficult regions to sequence or deletions initially present in the screening strain (Figure 1E). The
ot358 WGS data set therefore contains only 2 unique noncovered regions of .500 bp, one of them corre-sponding to the 1888-bp deletion responsible for the phenotype and the other to a true deletion of 475 bp located on another chromosome (true deletion sizes are usually smaller than the ‘‘uncovered regions’’ output of MAQGene because of the difficulty to obtain coverage in the immediate flanking sequences of a deletion). This illustrates that this approach can be efficiently used at the whole-genome scale to identify deletions of.500 bp for a genome with coverage of103, even if one only employs single read WGS.
Can one reliably call deletions of ,500 bp if the sequence coverage is higher? To answer this question, we again turned to theot177WGS data set (28.83 cover-age). This data set contains four noncovered regions of 100–500 bp (Figure 1E). We tested two of them by Sanger sequencing and found that one corresponds to a true deletion of 418 bp while the other reflects missam-pling (the last two regions are too repetitive to be amplified by PCR). This suggests that at303coverage, the background is low enough to allow the use of this simple approach to identify deletions of as little as 100 bp at the whole-genome scale level.
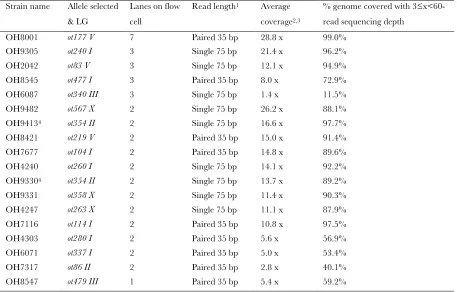
of specific phenotypic features (Table 1) (materials and methods). Some genomes had been outcrossed several times before being subjected to WGS; others were not outcrossed at all. The parameters for all 17 genome sequence runs (read length, coverage, and number of lanes used on a flow cell) are shown in
supporting information, Table S1. After MAQGene identified sequence variants relative to the reference genome using standard filtering criteria (Bigelowet al. 2009), we validated a subset of the variants by manual Sanger resequencing. We focused on 113 detected variants from all data sets that resulted in premature stops or
Figure1.—WGS identifies a cis-regulatory deletion in ot358 animals. (A) Expression of a GFP-based AIY cell fate marker
(otIs173) in wild-type orot358adults (red: AIY interneuron). (B) Percentage of adults showing expression of the AIY GFP reporter
otIs173(array[fosmid WRM064cD04]is a chromosomally integrated array containing attx-3rescuing genomic fragment in the
con-text of the fosmid shown in C, kindly provided by V. Reinke). (C)ttx-3genomic locus. Theot358deletion removes acis-regulatory
element regulatingttx-3expression (enhancer in blue). Our screen and previous screens have also identified strains bearing
mutations in splice sites or coding regions of thettx-3locus (in green are mutations reported here for the first time). (D)
Num-ber of noncovered regions inot358in the 0.6-cM mapping region. Left, noncovered inot358; right, noncovered inot358but
covered inot354. Tested and confirmed deletions are denoted in parentheses. (E) Number of noncovered regions inot358
orot177in the whole genome.ot358left, noncovered inot358;ot358right, noncovered inot358but covered inot354.ot177left,
noncovered inot177; ot177right, noncovered inot177but covered inot358. Tested and confirmed deletions are denoted in
splice site mutations. Seventy-nine of 113 variants were confirmed to be ‘‘true’’ variants by Sanger sequencing. All confirmed variants were supported by three or more reads. This validation therefore allowed us to further sharpen our criteria for variant calling with MAQGene by raising the minimum number of reads required to call a variant from two to three (seematerials and methods for the recommended complete parameter set). In other words, this new parameter set reliably identifies all true, spot-checked 79 variants and was then used to assess genome-wide mutation signatures (see below).
Variants relative to the wild-type reference genome can be attributed to three different sources: (1) variants that already existed in ourN2 wild-type strain or are sequencing errors in the reference genome; (2) variants that existed in our transgenic reporter strain, which was generated through chromosomal integration into our N2 wild-type strain (the radiation-mediated ‘‘chromo-somal integration’’ is itself mutagenic); and (3) variants caused by the EMS mutagenesis that produced the specific mutant strain. To distinguish between these possibilities, we compared variants between individual data sets. Variants found in all data sets were considered to be present in ourN2starting strain (totaling.600 variants); variants found in a subset (particularly those found in strains with the same transgenic marker) were also considered to be unrelated to the EMS mutagenesis, even though we cannot completely rule out the possi-bility that they may be independent EMS hits.
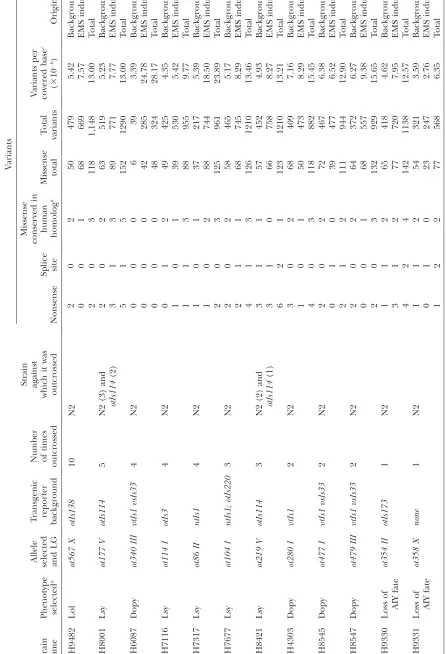
After filtering out the variants that were found in multiple data sets (‘‘background’’ rows in Table 1), we examined the molecular identity of the remaining individual variants, present uniquely in only 1 strain. We found that each sequenced genome displayed not only a large number of noncoding sequence variants, but also a large number of predicted protein-coding single-nucleotide variants, between 24 and 96 per ge-nome (Table 1). This substantial number of protein-affecting background mutations was surprising because some of the sequenced genomes were outcrossed several times (Table 1), but they nevertheless maintained a high mutational load. Intriguingly, the number of outcrosses did not correlate significantly with the number of variants (Figure 2; see legend for how we dealt with issues such as linkage). For example, a 5-fold outcrossed strain, OH8001, selected for a single-neuron-specific differentiation defect, still contains a mutational load of .90 protein-coding allelic variants and 682 non-protein-coding variants (Table 1). Similarly, the 10-fold out-crossed strain OH9482, selected for another neuron specification defect, also still contains 68 protein-coding allelic variants and 601 non-protein-coding variants (Table 1). Several possibilities may explain this lack of correlation. Below, we provide evidence for two specific scenarios that may contribute to the retention of a high mutational load. These are (1) linkage disequilibrium between unlinked chromosomes that may select for
viability (or other phenotypes) and (2), surprisingly, the introduction of novel variants through outcrossing, rather than a retention of the initial, EMS-induced mutational load.
Balancing selection may retain variants The EMS-mutagenized strainOH7677was isolated for a specifi-cation defect of gustatory neurons (Lsy phenotype) (Sarin et al. 2007), subjected to WGS, and found to contain a premature stop codon in an essential gene, lin-59(Figure 3). This was curious as theOH7677strain is viable and fertile (note that thelin-59allele,ot104, re-sides in a position between two previously character-ized, lethality-causing nonsense alleles oflin-59; Figure 3). Upon outcrossingOH7677animals, we noted that even thoughot104resides on chromosome I, we could not unlink it as a viable allele from a gfp reporter transgene integrated on chromosome V. We therefore surmised that chromosome V may contain a locus, linked to the reporter gene, that when mutated allows
ot104 homozygous animals to live. We examined se-quence variants on chromosome V in the OH7677 genome sequence data set and noted the presence of a missense mutation (E106K) in thelsy-12/R07B5.9locus. To test whether lsy-12 is indeed causative for the
lin-59(ot104)lethality suppression, we combined other
lin-59nonsense alleles,n3168andn3192, with another
lsy-12allele,ot170,and found thatot170also suppressed the lethality exhibited by the otherlin-59alleles (Figure 3). We have therefore uncovered through WGS a genetic interaction that would have been much harder to molecularly elucidate through conventional mapping schemes. Importantly, this example makes a case for a scenario in which a mutational load is retained through balancing selection. During outcrossing, which selected for thelin-59(ot104) Lsy phenotype, inadvertently, chro-mosome V was ‘‘carried along’’ as it contained thelsy-12
suppressor of theot104lethality. Variants linked tolsy-12
on chromosome V are therefore more difficult to out-cross and a larger mutational load remains. However, this can still not fully explain why a 33 outcrossed
lin-59(ot104)strain holds a substantial mutational load that is equivalent to other strains backcrossed fewer times (Figure 2). Furthermore, a high mutational load is still present after disregarding variants on chromosome V (data not shown).
Outcrossing EMS-mutagenized strains relieves initial mutational load but introduces new variants:To pursue the matter of mutational load further, we sequenced two strains carrying theot354allele that causes a differenti-ation defect of theAIYinterneuron similar to theot358
allele shown in Figure 1. Oneot354-containing strain was backcrossed once againstN2wild type, and the other was backcrossed an additional six times to a total of seven times. We found that the 13 outcrossed ot354 strain contained a total of 730 unique variants (Figure 4). We analyzed each variant position in the 73 outcrossed
T ABLE 1 Mutational pro file of strains analyzed by WGS V ariants Strain name Phenotype selected a
Allele selected and
LG T ransgenic reporter background Number of times outcrossed Strain against which it was outcrossed Nonsense Splice site Missense conser ved in human homolog b Missense total T otal variants V ariants per covered base c ( 3 10 6) Origin OH9482 Lol ot567 X otIs138 10 N2 2 0 2 50 479 5.42 Background 0 0 1 68 669 7.57 EMS induced 2 0 3 118 1,148 13.00 T otal OH8001 Lsy ot177 V otIs114 5 N2 (3) and otIs114 (2) 2 0 2 63 519 5.23 Background 3 1 3 89 771 7.77 EMS induced 5 1 5 152 1290 13.00 T otal OH6087 Dopy ot340 III vtIs1 vsIs33 4 N2 0 0 0 6 39 3.39 Background 0 0 0 42 285 24.78 EMS induced 0 0 0 48 324 28.17 T otal OH7116 Lsy ot114 I otIs3 4 N2 0 1 2 49 425 4.35 Background 1 0 1 39 530 5.42 EMS induced 1 1 3 88 955 9.77 T otal OH7317 Lsy ot86 II ntIs1 4 N2 1 0 1 37 217 5.39 Background 1 0 2 88 744 18.50 EMS induced 2 0 3 125 961 23.89 T otal OH7677 Lsy ot104 I ntIs1; otIs220 3 N2 2 0 2 58 465 5.17 Background 2 1 1 68 745 8.29 EMS induced 4 1 3 126 1210 13.46 T otal OH8421 Lsy ot219 V otIs114 3 N2 (2) and otIs114 (1) 3 1 1 57 452 4.93 Background 3 1 0 66 758 8.27 EMS induced 6 2 1 123 1210 13.21 T otal OH4303 Dopy ot280 I vtIs1 2 N2 3 0 2 68 409 7.16 Background 1 0 1 50 473 8.29 EMS induced 4 0 3 118 882 15.45 T otal OH8545 Dopy ot477 I vtIs1 vsIs33 2 N2 2 0 2 72 467 6.38 Background 0 1 0 39 477 6.52 EMS induced 2 1 2 111 944 12.90 T otal OH8547 Dopy ot479 III vtIs1 vsIs33 2 N2 2 0 2 64 372 6.27 Background 0 0 1 68 557 9.38 EMS induced 2 0 3 132 929 15.65 T otal OH9330 Loss of AIY fate ot354 II otIs173 1 N2 1 1 2 65 418 4.62 Background 3 1 2 77 720 7.95 EMS induced 4 2 4 142 1138 12.57 T otal OH9331 Loss of AIY fate ot358 X none 1 N2 1 1 2 54 321 3.59 Background 0 1 0 23 247 2.76 EMS induced 1 2 2 77 568 6.35 T
otal (continued
T ABLE 1 (Continued) V ariants Strain name Phenotype selected a
Allele selected and
(549/730) had been replaced, through outcrossing, by the wild-type, reference genome base. One hundred thirty-four existed in a heterozygous state while 30 re-mained homozygous variants,i.e., were maintained after 6 outcrosses (Figure 4) (the remaining 17 were in areas of low coverage and therefore a reliable consensus base could not be obtained). As expected, most of these retained homozygous variants, 24/30, were linked to the
chromosomes harboring either the phenotype-causing mutant allele (II:ot354) or the integrated gfpreporter used to assess this phenotype (III:otIs173). Thus, con-sidering only unlinked chromosomes, 6 outcrosses reduced the observed variant number from 428 to 6. After the first outcross, the number of variants that are predicted to exist in the homozygous state should be 25% of the original load (note that variants are not detected by our filtering criteria in their heterozygous state), and then each subsequent outcross would reduce this number by 50%. Our observed number of variants unlinked to the phenotype-causing mutation or re-porter (6) is comparable to the predicted number (3). Thus, outcrossing to a wild-type strain indeed has the intended effect of removing background variants.
However, we noted that outcrossing against our wild-typeN2strain also had unintended effects: although a total of 30 variants were common between the 13and 73outcrossed ot354-strains, we were surprised to note thatot354(73outcrossed) carried 202 unique variants of its own, i.e., those not found in any other strain (several of which were outcrossed with our N2strain, too) (Figure 4). One hundred twelve of 202 of these variants were sufficiently covered in the 13outcrossed data set for further analysis: a closer inspection revealed that 69 of these variant positions were in fact wild type in the 13 outcrossed strains, implying that new variants had been introduced by outcrossing. These new variants are likely the result of previously observed, substantial genetic drift in theN2population (Denveret al. 2009; Flibotteet al. 2010, accompanying article in this issue) to which the mutagenized strain was outcrossed or in the
ot354 population that was grown for several months during the outcrossing. Such drift could, at least in part, explain the surprising lack of correlation observed between fold outcross and variant number (Figure 2) (seediscussion).
Identifying putative loss of protein function alleles:
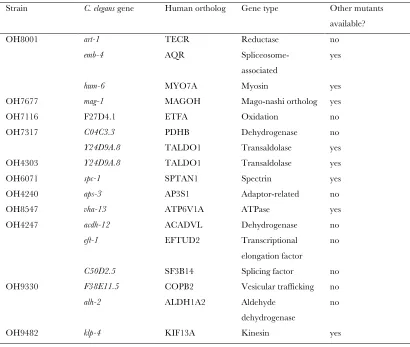
Summing up all 17 strains whose genome we sequenced, our analysis identified unique allelic variants in.1000 genes. With the exception oflsy-22, all sequenced strains are completely viable even though a substantial number of the many mutations in the sequenced strains are supposed to have deleterious effects on protein func-tion (Table 1). Such a deleterious effect is assumed if one of four criteria is fulfilled:
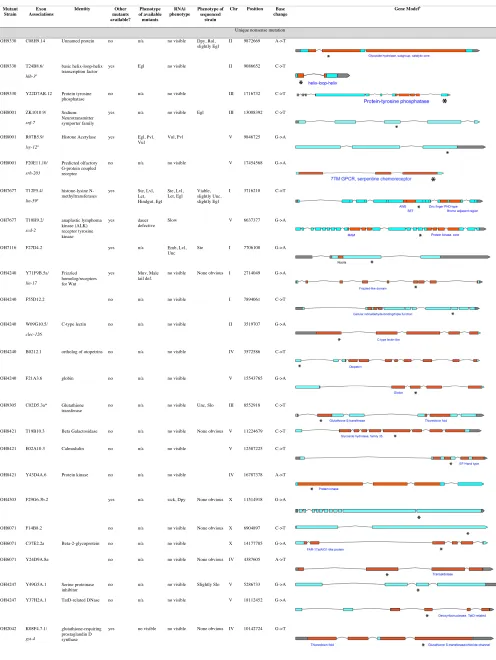
1. Premature stop codons, which truncate a protein: We surmise likely loss (either complete or partial) of protein function if the premature stop codon occurs before a conserved protein domain or in an exon before the last exon, which presumably subjects the message to nonsense-mediated mRNA decay. All allelic variants of this type are shown inTable S2. 2. Splice site mutations: Even though their effect on
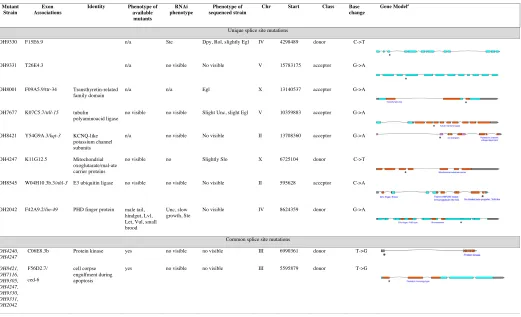
protein function is more difficult to predict as alternate, cryptic splice sites may be used, many cases
Figure2.—Lack of correlation between fold outcross and
variant number. (A)y-axis represents unique variant numbers
divided by total number of sequenced bases (those with at
least 33and at most 603sequencing depth) for each data
set. This accounts for differences in coverage between differ-ent data sets. Unique variants exclude those shared between two or more data sets. (B) This graph presents unique variants per analyzed chromosome, excluding those linked to the mu-tation or transgene reporter. To deal with linkage, we did not include variants on chromosomes that contained (a) the phe-notype-causing mutation isolated for, (b) the integrated fluo-rescent transgene used to score the mutant phenotype, and (c) the X chromosome, which is subject to fewer
recombina-tion events due to method of outcrossing: F1males from the
first outcross (which are XO for this chromosome and there-fore do not undergo meiotic recombination) are mated with
the wild-type strain. F2progeny from this second outcross
in the literature show highly deleterious effects of splice site mutations, usually because aberrant splic-ing generates readsplic-ing frame changes. All allelic variants of this type are shown inTable S3.
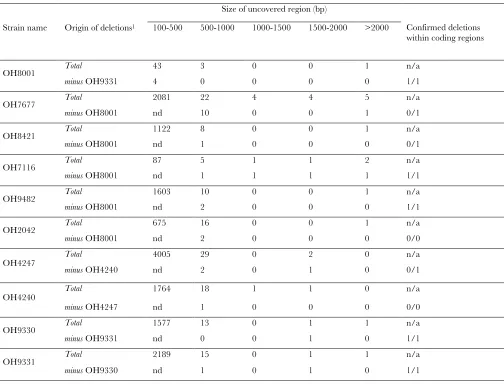
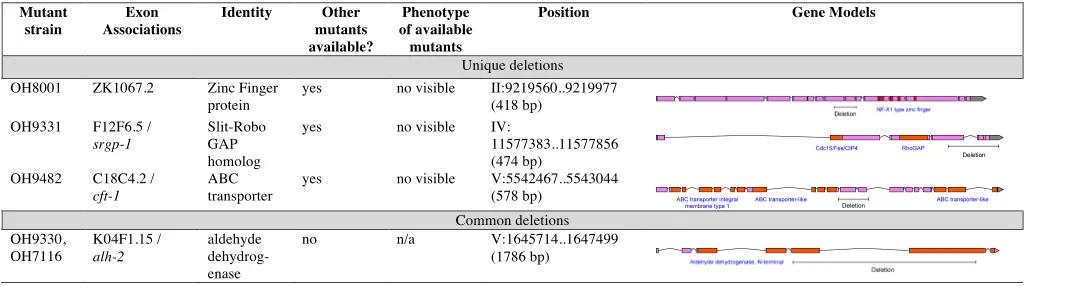
3. Deletions usually have the most obvious effects on protein function. As described above, extracting de-letions from WGS data requires an analysis of the genomic regions with lack of coverage. For reasons described above in the section on thettx-3(ot358) de-letion allele, we consider only such regions that are .500 bp and excluded those regions that are sim-ilarly noncovered between data sets sharing the same transgenic background. All allelic variants of this type are shown in Table S4 and Table S5. We manually confirmed the boundaries of these deletions (Table S5).
4. Finally, we considered missense mutations, whose impact on protein function is difficult to assess. We used the criteria of phylogenetic conservation as an indicator of potential impact of an allele on protein function. We first used the six-way PhastCons score integrated into the MAQGene platform, which com-pares successive 20-bpC. eleganssequence windows to five closely related species and weights homology
using phylogenetic criteria (Siepelet al. 2005;Bigelow et al. 2009). Amino acids found to be conserved by these criteria were then assessed for whether they are conserved in human homologs as well (seematerials and methods). All allelic variants of this type are shown inTable S6.
The total number of alleles from all 17 strains falling into these four categories is 57. Sixty-two percent of the genes had no allelic variant described before. The number of protein-altering allelic variants doubles to .120 if one takes into account variants that were already present in the starting strain, before mutagenesis (Table 1). In sum, each mutant strain that we genome sequenced contains, on average, four premature stop codons and one splice site mutation.
As mentioned above, premature stop codons and deletions are excellent candidates for genetic loss-of-function alleles. The strains that contain these alleles are therefore a valuable resource that complements the efforts of theC. elegansknockout consortia (Moerman and Barstead 2008; Mitani 2009). Because of this value, we confirmed all premature stop codon variants shown in Table 1 by Sanger resequencing. All strains with
Figure3.—lin-59lethality is suppressed bylsy-12.(A)lin-59gene structure. The table at the bottom displays viability of each
lin-59() strain. (B) Outcrossing of OH7677 reveals a modifier locus on chromosome V that suppresses the observed lethality
likely due tolin-59(ot104). (C) Variants discovered on chromosome V in OH7677. Variants were processed and filtered with
MAQGene (Bigelowet al.2009). One of the missense variants resides within thelsy-12locus. (D)lsy-12gene structure. This
sche-matic shows an incomplete version of thelsy-12locus per the last release of WormBase. Transcript mapping shows that thelsy-12
locus extends in the more upstream locatedmys-3gene, a histone acetyltransferase (M. M. O’Mearaand O. Hobert, unpublished
results). (E) A second independently isolated allele oflsy-12(Sarinet al.2007) suppresses two other independently isolatedlin-59
these alleles have been submitted to the Caenorhabditis Genetics Center (CGC) and the sequence information has been submitted to WormBase (www.wormbase.org) for annotation.
WGS reveals bias in variant distribution within C. elegans autosomes: Examination of the genome-wide distribution of variants uncovered by WGS reveals that the distribution of these variants is not completely uniform. Variants appear slightly more concentrated on the arms of each chromosome (Figure S1A), away from gene-rich regions (Barneset al. 1995). Quantifi-cation of variant rates inside and outside such regions revealed that indeed variants were more likely to be retrieved on the arms of the chromosomes by an average factor of 1.53among all five autosomes (Figure S1B). This trend remained even when variants on chromo-somes bearing the phenotype-causing mutations and transgenes were removed from this analysis (Figure S1 C). Such an analysis could not be conducted on the X chromosome as it does not hold a similar gene-rich region (Barnes et al. 1995). The fact that the strains analyzed by WGS display fewer variants in gene-rich regions than in gene-poor ones may result from the negative selection of lethal or sterile mutations. A
mutation in a gene-rich region is more likely to affect an essential gene and result in the death or sterility of the animal, which introduces a bias against its isolation. In support of this idea, synonymous changes, which should not be under negative selection, were more randomly distributed across the autosomes (Figure S1D).
Specificity and efficiency of the EMS mutagen: We also considered the efficiency and specificity with which EMS induces mutations. A previous study analyzed 245 mutations in coding regions and reported a frequency of 92% G/C . A/T transitions (Anderson 1995). Through sequencing five EMS-mutagenized strains, a similar mutational spectrum of EMS is also reported by Flibotte et al. (2010). In our three unbackcrossed strains we find a broader range of specificity as 66% are G/C.A/T transitions (considering 649 supported by more than five reads). The rest are G/C.T/A (5%), G/C . C/G (2%), T/A . G/C (9%), T/A . C/G (12%), or T/A . A/T (5%) mutations. Not all these variants are necessarily EMS induced, considering the genetic drift that we discussed above.
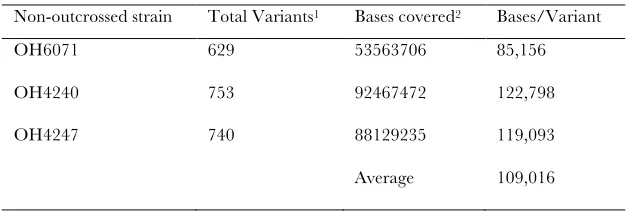
To assess EMS efficiency, we considered three non-outcrossed strains that we sequenced. At the doses that we use (50 mm), we find that EMS induces roughly one change per 100,000 nucleotides (Table S7). This num-ber refers only to variants in a homozygous state. To get a rough idea for the number of heterozygous variants in the background, we needed to take into consideration the reliability with which MAQGene can assess a ‘‘mixed’’ position. To optimize the chances of correctly calling such a mixed state, we considered only those positions that are covered .103 and for which40– 60% of the bases are called by the software as a mutant. Such positions may be either true heterozygotes or sequencing errors resulting from base calling and/or mapping of highly repetitive regions differing at only a few positions. Three of 10 were manually validated from the original genomic sample used for genome rese-quencing. For one such strain,OH9482, we find 2067 variants that fit these criteria among 65,165,624 bases covered by at least 10 reads. If 0.3 of these are true heterozygotes, this means 1 heterozygous mutation per 94,581 bases. Previous predictions of the frequency of G/C to A/T transitions induced by standard concen-trations of EMS (50 mm) are 73106per mutagenized G/C base (Anderson1995). We find the frequency to be quite close, 13105per mutagenized G/C base. Given
that26% of the genome is protein coding (Spiethand Lawson, 2006), this number is also not far off from Brenner’s original estimate of the forward mutation rate of 53104per gene (Brenner1974).
These numbers have to be taken with caution due to founder effects and the drive for homozygosity of selfing strains. Invariably, upon picking individuals during strain maintenance one generates a founder effect, with a 25% probability for each variant initially induced by EMS to have been lost.
Figure4.—Outcrossing reduces total variant number but
introduces new variants. Variant numbers that are unique
to theot354data set,i.e., not found in any other of the 16
se-quenced mutant genomes, are considered.ot354; otIs173was
outcrossed against the laboratory wild-type N2 BristolC.
ele-gansstrain and F2homozygousmutant; reporteranimals were
singled out after each outcross. x/x are numbers that indi-cate the state of each unique variant position (wild type, het-erozygous, etc.) in the other strain’s genome, revealing both the loss and the gain of variants after six additional outcross-ing events. Homozygous mutations were defined by those po-sitions covered by more than ten reads holding a variant:total
read ratiox.0.86. Heterozygous mutations were defined by
those positions covered by more than two reads holding a
var-iant:total read ratio 0.4.x$0.86. Seematerials and
DISCUSSION
Our key results can be summarized as follows: 1. Through deep sequencing of multiple genomes,
followed by validation of selected variants, we have further optimized our parameter set and bioinfor-matic pipeline (MAQGene) for application of WGS for mutation identification, an approach that we expect to become routine in the model system com-munity (Hobert2010).
2. We provide two additional examples for the use of WGS to identify phenotype-causing mutations in an organism; one particular example shows that WGS can be used to detect deletions, while another ex-ample demonstrates the use of WGS to identify a ge-netic interaction between two chromatin-modifying loci (lin-59;lsy-12interaction).
3. We show that even though outcrossing removes many EMS-induced variants, mutagenized genomes are still littered with protein-coding sequence variants. The variant landscape that we describe here also provide a first pass estimate for how many variants to expect in a genetic interval in which a genetic trait has been mapped to [Table 1; (1.610.5162.4)/6 which equals about 11 protein-altering variants per chromosome].
4. The fortuitously identified allelic variants de-scribed here are potentially useful tools for further studies on the respective genes. On the basis of this observation, it can be anticipated that more and more allelic variants of all sorts of genetic loci will be identified in future WGS data sets of mutagen-ized genomes.
Our most unanticipated finding is the mutational load (‘‘dirtiness’’) even of backcrossed strains. This is a somewhat troubling finding as a basic premise of genetic mutant analysis is that one compares a strain that differs in its genetic makeup from the wild-type control strain onlyin the single locus under investigation. Our analysis shows that this is very far from being the case; in reality, even backcrossed strains contain multiple, likely pro-tein-changing sequence variants. We do not believe that this is due to some unusual laboratory-specific strain problem with ourN2wild-type strain since some strains were also backcrossed with nonmutagenized trans-genic starter strains, which are different for different WGS data sets (Table 1). We also examined WGS data sets that we produced for several other laboratories, which provided us with strains of varying degrees of outcrossing. We made the same observations in those data sets,i.e., a high mutational load observed even after outcrossing.
One explanation for this mutational load is genetic drift. WGS studies on mutation-accumulation lines indicate that independently isolated animals from a parental wild-type N2 strain acquire, on average, 40
unique spontaneous mutations over 200 generations (Denveret al. 2009). The consequence of genetic drift may be that the wild-type N2 strain, considered to be isogenic, is in fact quite heterogeneous, containing perhaps many heterozygous mutations that became fixed in unique combinations after outcrossing and selection for the mutant phenotype. In support of this idea is the observation that many variants are present in only a subset of our 17 sequenced strains (despite the variant position being covered by sufficient reads in all). As this subset does not correlate with strain history (i.e., onevs. another transgenic starter strain), this suggests that they may have been present in a fraction of ourN2 worms and became homozygous in a random subset of manipulated populations after outcrossing. Further-more, a 1.4-kb deletion was found to be common between only two strains,OH7116andOH9330, which do not share the same original transgenic background (Table S5). No other sequenced strain carried this deletion, which was likely present in our wild-typeN2 strain as a heterozygote, introduced by outcrossing, and randomly driven to homozygosity in only these two strains. Similarly, genetic drift likely also acts on the mutant strain itself, introducing spontaneous variants that are unique to its genome.
Some of the mutational load may also be due to instances of linkage disequilibrium between alleles. Extensive linkage disequilibrium, extending to unlinked chromosomes, has been observed in recombinant in-bredC. elegans wild isolates (Rockmanand Kruglyak 2009). Our reportedlin-59;lsy-12interaction provides an extreme example of linkage, or balanced selection, of two physically unlinked variants. The presence of
lin-59fixeslsy-12(and variants physically linked tolsy-12) in the population. Another potential reason for the lack of correlation that we observe between outcross number and variant number may be variable efficiency of the EMS mutagenesis procedure that may result in vari-able initial mutational loads between strains before outcrossing.
to complement one another, and (4) RNAi phenocopy of the mutant phenotype [all those four criteria were applied to pinpoint the molecular identity of
lsy-12(ot177) in our initial WGS study (Sarin et al. 2008)]. Even though quite good, none of these ap-proaches alone deals perfectly well with the possibility of modifier mutations in the background. Mapping may just identify one component of the trait, and a modifier locus contained in the background may easily go un-detected; this holds particularly for the commonly used rapid SNP mapping approaches in which mapping to a specific interval is not necessarily absolute. Transforma-tion rescue also does not exclude a modifier effect for the simple technical reason that copy number issues of transgenic arrays do not allow an experimenter to in-terpret the extent of rescue. The availability of multiple, independently isolated alleles is also not a sure way to exclude the possibility that due to selective pressure, the retrieval of multigenic loci may be favored. Even the very simple approach of checking whether a specific, re-cessive trait segregates in a 1/4 Mendelian ratio can be misleading as there may be selective pressure on main-taining the modifier mutation in the background. Finally, phenocopy by RNAi against a candidate gene also leaves open the possibility of modifier effects. The bottom line is that ideally the experimenter wants to have not one, but several pieces of independent lines of evidence that one deals indeed with a single-locus effect.
Background variants have the following practical impact on cloning a gene by WGS. In principle, se-quencing a single mutant genome can identify the phenotype-causing mutation of interest [as shown in our proof-of-principle study (Sarinet al. 2008)]. How-ever, due to the amount of background variants, some rough mapping is recommended to hone in on a smaller number of candidate variants that may be responsible for the mutant phenotype (Sarinet al. 2008). Preferably, one has sequenced multiple, independently isolated mutant strains that originated from the same starting strain, which allows one to eliminate all strain back-ground variants (this study and Flowers et al. 2010). Such data set comparisons are more cost effective than sequencing the starting strain, which will yield no other information than background variants, while sequenc-ing another nonallelic mutant strain may also lead to the identification of another phenotype-causing mutation. Most preferably, one undertakes WGS of two alleles of the same locus. Comparing these data sets will eliminate all EMS/outcrossing-induced random variants that will affect distinct sets of genes; only those variants that affect the same locus are candidates for the phenotype-causing mutation. In such a case, at least in theory, minimal to no mapping is required before undertaking WGS. Yet, even though several scenarios can be envisioned in which WGS does not require any previous, classic mapping, we still recommend coarse (and therefore fast) classic mapping through simple linkage analysis. Such analysis
not only helps in analyzing WGS data, but also implicitly validates genetic complementation data (i.e., alleles that fail to complement should map to the same interval) and assesses whether a trait is mono- or polygenic.
We thank Stephen Nurrish and Iva Greenwald for extensive discussions on the subject and Qi Chen for expert DNA injection. We thank Iva Greenwald, Eric Alani, Don Moerman and members of the Hobert lab for comments on the manuscript. We acknowledge funding by the National Institutes of Health to O.H. (R01NS039996-05 and R01NS050266-03) and to S.S. (NS054540-01) V.B. was funded by postdoctoral fellowships by the European Molecular Biology Organi-zation and Human Frontier Science Program OrganiOrgani-zation. O.H. is an Investigator of the Howard Hughes Medical Institute.
LITERATURE CITED
Anderson, P., 1995 Mutagenesis, pp. 31–58 in Caenorhabditis
elegans—Modern Biological Analysis of an Organism, edited by H.
F. Epsteinand D. Shakes. Academic Press, New York/London/ San Diego.
Barnes, T. M., Y. Kohara, A. Coulsonand S. Hekimi, 1995 Meiotic recombination, noncoding DNA and genomic organization in
Caenorhabditis elegans. Genetics141:159–179.
Bertrand, V., and O. Hobert, 2009 Linking asymmetric cell divi-sion to the terminal differentiation program of postmitotic neu-rons in C. elegans. Dev. Cell16:563–575.
Bigelow, H., M. Doitsidou, S. Sarin and O. Hobert, 2009 MAQGene: software to facilitate C. elegans mutant ge-nome sequence analysis. Nat. Methods6:549.
Bigelow, H. R., A. S. Wenick, A. Wong and O. Hobert, 2004 CisOrtho: a program pipeline for genome-wide identifica-tion of transcripidentifica-tion factor target genes using phylogenetic footprinting. BMC Bioinformatics5:27.
Blumenstiel, J. P., A. C. Noll, J. A. Griffiths, A. G. Perera, K. N. Waltonet al., 2009 Identification of EMS-induced mutations
inDrosophila melanogasterby whole-genome sequencing. Genetics
182:25–32.
Brenner, S., 1974 The genetics ofCaenorhabditis elegans. Genetics 77:71–94.
Denver, D. R., P. C. Dolan, L. J. Wilhelm, W. Sung, J. I. Lucas-Lledo
et al., 2009 A genome-wide view of Caenorhabditis elegans
base-substitution mutation processes. Proc. Natl. Acad. Sci. USA106: 16310–16314.
Flibotte, S., M. L. Edgley, I. Chaudhry, J. Taylor, S. E. Neilet al., 2010 Whole-genome profiling of mutagenesis inCaenorhabditis
elegans. Genetics185:431–441.
Flowers, E. B., R. J. Poole, B. Tursun, E. Bashllari, I. Pe’eret al., 2010 The Groucho ortholog UNC-37 interacts with the short Groucho-like protein LSY-22 to control developmental decisions in C. elegans. Development137:1799–1805.
Hobert, O., 2010 The impact of whole genome sequencing on model system genetics: get ready for the ride. Genetics 184: 317–319.
Hobert, O., I. Mori, Y. Yamashita, H. Honda, Y. Ohshimaet al., 1997 Regulation of interneuron function in the C. elegans ther-moregulatory pathway by the ttx-3 LIM homeobox gene. Neuron 19:345–357.
Irvine, D. V., D. B. Goto, M. W. Vaughn, Y. Nakaseko, W. R. McCombie
et al., 2009 Mapping epigenetic mutations in fission yeast using
whole-genome next-generation sequencing. Genome Res. 19: 1077–1083.
Li, H., J. Ruanand R. Durbin, 2008 Mapping short DNA sequenc-ing reads and callsequenc-ing variants ussequenc-ing mappsequenc-ing quality scores. Genome Res.18:1851–1858.
Mitani, S., 2009 Nematode, an experimental animal in the national BioResource project. Exp. Anim.58:351–356.
Potts, M. B., D. P. Wangand S. Cameron, 2009 Trithorax, Hox, and TALE-class homeodomain proteins ensure cell survival through repression of the BH3-only gene egl-1. Dev. Biol.329:374–385. Rockman, M. V., and L. Kruglyak, 2009 Recombinational
land-scape and population genomics of Caenorhabditis elegans. PLoS Genet.5:e1000419.
Sarin, S., M.O’Meara, E. B. Flowers, C. Antonio, R. J. Pooleet al., 2007 Genetic screens forCaenorhabditis elegansmutants defec-tive in left/right asymmetric neuronal fate specification. Genet-ics176:2109–2130.
Sarin, S., S. Prabhu, M. M. O’Meara, I. Pe’er and O. Hobert, 2008 Caenorhabditis elegans mutant allele identification by whole-genome sequencing. Nat. Methods5:865–867.
Shen, Y., S. Sarin, Y. Liu, O. Hobertand I. Pe’er, 2008 Comparing platforms for C. elegans mutant identification using high-throughput whole-genome sequencing. PLoS ONE3:e4012. Shendure, J., and H. Ji, 2008 Next-generation DNA sequencing.
Nat. Biotechnol.26:1135–1145.
Siepel, A., G. Bejerano, J. S. Pedersen, A. S. Hinrichs, M. Houet al., 2005 Evolutionarily conserved elements in vertebrate, insect, worm, and yeast genomes. Genome Res.15:1034–1050. Smith, D. R., A. R. Quinlan, H. E. Peckham, K. Makowsky, W. Tao
et al., 2008 Rapid whole-genome mutational profiling using
next-generation sequencing technologies. Genome Res. 18: 1638–1642.
Spieth, J., and D. Lawson, 2006 Overview of gene structure (Janu-ary 18, 2006), WormBook, edited by The C. elegans Research Community, WormBook, doi/10.1895/wormbook.1.65.1,http:// www.wormbook.org.
Srivatsan, A., Y. Han, J. Peng, A. K. Tehranchi, R. Gibbset al., 2008 High-precision, whole-genome sequencing of laboratory strains facilitates genetic studies. PLoS Genet.4:e1000139.
Supporting Information
http://www.genetics.org/cgi/content/full/genetics.110.116319/DC1
Analysis of Multiple Ethyl Methanesulfonate-Mutagenized
Caenorhabditis elegans
Strains by Whole-Genome Sequencing
Sumeet Sarin, Vincent Bertrand, Henry Bigelow, Alexander Boyanov,
Maria Doitsidou, Richard J. Poole, Surinder Narula and Oliver Hobert
Copyright © 2010 by the Genetics Society of America
S. Sarin et al.
2 SI
!" !#$"
0 2000000 4000000 6000000 8000000 10000000 12000000 14000000 16000000 18000000
!" !#$"
0 2000000 4000000 6000000 8000000 10000000 12000000 14000000 16000000 18000000 Chromosome I
Chromosome II
!"
0 2000000 4000000 6000000 8000000 10000000 12000000 14000000 16000000 18000000 Chromosome III
!"
0 2000000 4000000 6000000 8000000 10000000 12000000 14000000 16000000 18000000 Chromosome IV
!" !#$"
0 2000000 4000000 6000000 8000000 10000000 12000000 14000000 16000000 18000000 20000000 22000000 Chromosome V
!"
0 2000000 4000000 6000000 8000000 10000000 12000000 14000000 16000000 18000000 Chromosome X
Gene rich regions
A
B
C
D
Supp.Fig.1
0 2 e-6 4 e-6 6 e-6 8 e-6 1.0 e-5 1.2 e-5
LG V LG IV LG III LG II LG I
Normalized variant rate
Normalized variant rate
Normalized variant rate
0 3 e-9 6 e-9 9 e-9 1.2 e-8 1.5 e-8 0 3 e-9 6 e-9 1.2 e-8 1.5 e-8 1.8 e-8
Outside dense gene cluster Inside dense gene cluster
FIGURE S1.—Total variant distribution of 16 sequenced mutant strains. (A) Accumulated representation of all variants from 16 genome sequenced strains (excluding OH9305 which was outcrossed against HA). Each hash mark represents a single variant position. Red lines indicate gene rich regions found on chromosomes I-V, but not on X. (B) Rate of retrieved variants is higher among non-gene rich regions than gene rich regions across all five autosomes. Variants on each chromosome for each strain were normalized to total variant number/strain to account for differences in coverage between strains. Variant rates inside and outside gene rich regions were then averaged between 16 sequenced genomes for each chromosome. Standard error of mean is shown. p-values (t-test) for each chromosome are as follows, I: 4 x 10⁻⁵, II: 0.02, III: 0.06, IV: 0.5, V: 8 x 10⁻³. (C) Same analysis as (B) with the following exception: variants linked to
chromosomes harboring either the phenotype-causing mutant selected for, or the integrated transgene used to score phenotype, were excluded. Standard error of mean is shown. p-values (t-test) for each chromosome are as follows, I: 3 x 10⁻⁹, II: 4 x 10⁻⁴, III: 3 x 10⁻³, IV:
0.3, V: 3 x 10⁻⁴. (D) Rate of synonymous changes inside and outside gene rich regions. As synonymous variants are relatively infrequent
S. Sarin et al. 3 SI
TABLE S1
WGS RUN STATISTICS
Strain name Allele selected & LG
Lanes on flow cell
Read length1 Average
coverage2,3
% genome covered with 3≤ x<60-read sequencing depth
OH8001 ot177 V 7 Paired 35 bp 28.8 x 99.0% OH9305 ot240 I 3 Single 75 bp 21.4 x 96.2% OH2042 ot83 V 3 Single 75 bp 12.1 x 94.9% OH8545 ot477 I 3 Paired 35 bp 8.0 x 72.9% OH6087 ot340 III 3 Single 75 bp 1.4 x 11.5% OH9482 ot567 X 2 Single 75 bp 26.2 x 88.1% OH94134 ot354 II 2 Single 75 bp 16.6 x 97.7%
OH8421 ot219 V 2 Paired 35 bp 15.0 x 91.4% OH7677 ot104 I 2 Paired 35 bp 14.8 x 89.6% OH4240 ot260 I 2 Single 75 bp 14.1 x 92.2% OH93304 ot354 II 2 Single 75 bp 13.7 x 89.2%
OH9331 ot358 X 2 Single 75 bp 11.4 x 90.3% OH4247 ot263 X 2 Single 75 bp 11.1 x 87.9% OH7116 ot114 I 2 Paired 35 bp 10.8 x 97.5% OH4303 ot280 I 2 Paired 35 bp 5.6 x 56.9% OH6071 ot337 I 2 Paired 35 bp 5.0 x 53.4% OH7317 ot86 II 2 Paired 35 bp 2.8 x 40.1% OH8547 ot479 III 1 Paired 35 bp 5.4 x 59.2%
1We find paired 35bp runs and single 75bp runs produce equally reliable data.
2Note that coverage of >8x is recommended to identify single base variants with high reliability (SHENet al., 2008). We found
that as little as 1 lane in a flow cell produced all the data we needed to identify the phenotype-causing mutation.
3The range of sequencing depths observed (among samples run on the same number of lanes) is the result of a number of
variables including sample DNA purity, ability to accurately assess DNA concentration and individual machine-based sequencing run peculiarities.
4OH9413 is derived from OH9330. OH9330 was backcrossed 1x (see Table 1) against our wild-type N2 and analyzed. This
S. Sarin et al.
4 SI
Table S2
Genes Containing Premature Stops Discovered in Sequenced Genomes
Mutant Strain
Exon Associations
Identity Other mutants available?
Phenotype of available mutants
RNAi phenotype
Phenotype of sequenced
strain
Chr Position Base change
Gene Modelb
Unique nonsense mutation OH9330 C08H9.14 Unnamed protein no n/a no visible II 9872669 A->T
OH9330 T24B8.6/
hlh-3a
basic helix-loop-helix transcription factor
yes Egl no visible II 9086652 C->T
OH9330 Y22D7AR.12 Protein tyrosine phosphatase
no n/a no visible Dpy, Rol, slightly Egl
III 1716732 C->T
OH8001 ZK1010.9/
snf-7
Sodium: Neurotransmitter symporter family
yes n/a no visible III 13008392 C->T
OH8001 R07B5.9/
lsy-12a
Histone Acetylase yes Egl, Pvl. Vul
Vul, Pvl V 9846725 G->A
OH8001 F20E11.10/
srh-203
Predicted olfactory G-protein coupled receptor
no n/a no visible Egl
V 17454568 G->A
OH7677 T12F5.4/
lin-59a
histone-lysine N-methyltransferases
yes Ste, Lvl, Let, Hindgut, Egl
Ste, Lvl, Let, Egl
I 3716210 C->T
OH7677 T10H9.2/
scd-2
anaplastic lymphoma kinase (ALK) receptor tyrosine kinase
yes dauer defective
Slow
Viable, slightly Unc, slightly Egl
V 6637377 G->A
OH7116 F27D4.2 yes n/a Emb, Lvl, Unc
Ste I 7706108 G->A
OH4240 Y71F9B.5a/
lin-17
Frizzled homolog/receptors for Wnt
yes Muv, Male tail def.
no visible I 2714049 G->A
OH4240 F55D12.2 no n/a no visible I 7894061 C->T
OH4240 W09G10.5/
clec-126
C-type lectin no n/a no visible II 3519707 G->A
OH4240 B0212.1 ortholog of otopetrins no n/a no visible IV 3572586 C->T
OH4240 F21A3.6 globin no n/a no visible
None obvious
V 15543765 G->A
OH9305 C02D5.3a* Glutathione transferase
no n/a no visible Unc, Slo III 8552918 C->T
OH8421 T19B10.3 Beta Galactosidase no n/a no visible None obvious V 11224679 C->T
OH8421 E02A10.3 Calmodulin no n/a no visible V 12587225 C->T
OH8421 Y43D4A.6 Protein kinase no n/a no visible IV 16787378 A->T
OH4303 F29G6.3b.2 yes n/a sick, Dpy None obvious X 11514918 G->A
OH6071 F14B8.2 no n/a no visible X 6904897 C->T
OH6071 C37E2.2a Beta-2-glycoprotein no n/a no visible
None obvious
X 14177785 G->A
OH6071 Y24D9A.8a no n/a no visible None obvious IV 4387605 A->T
OH4247 Y49G5A.1 Serine proteinase inhibitor
no n/a no visible V 5286733 G->A
OH4247 Y37H2A.1 TatD-related DNase no n/a no visible
Slightly Slo
V 18112452 G->A
OH2042 K08F4.7.1/
gst-4
glutathione-requiring prostaglandin D synthase
yes no visible no visible None obvious IV 10142724 G->T
TABLE S2
S. Sarin et al. 5 SI
OH2042 Y43C5B.3 Predicted mitochondrial carrier protein
no n/a no visible IV 10354287 G->A
OH7317 F21H12.1 WD40 repeat yes Egl Emb Egl II 6098987 G->A
Common nonsense mutations OH8001,
OH4240,
OH8421
Y48G8AL.11/h af-6
ATP-binding cassette (ABC) transporter
no n/a no visible see above I 1173997 A->T
OH8001,
OH8421
Y48G8AL.11/h af-6
ATP-binding cassette (ABC) transporter
no n/a no visible see above I 1174025 T->A
OH8001, OH7677, OH9305, OH8421, OH6071, OH4247, OH9331, OH8545, OH8547
Y16B4A.2 no n/a no visible see above X 14766617 G->T
OH7677,
OH4240
K09F6.3 Protein tyrosine phosphatase
no n/a no visible see above II 2259159 G->T
OH4240,
OH4247
Y97E10B.3/ srsx-6
7-transmembrane receptor
no n/a no visible see above V 7927902 G->A
OH4240,
OH4303, OH6071, OH4247, OH8545
T26H5.10 no n/a no visible see above V 15443743 T->A
OH4240,
OH8421, OH4303, OH6071, OH4247, OH8547
C23F12.2/ flnb-1
filament binding protein
yes wild-type Unc see above X 9407197 C->A
OH4240,
OH6071, OH4247, OH4303
F42E11.3 no n/a no visible see above X 11375072 G->A
OH9305, OH4247
C02D5.3a/ gsto-2
omega-class glutathione transferases
no n/a development variant
see above III 8552918 C->T
OH9305, OH7317, OH9330
F57A10.2 VAMP-associated protein involved in inositol metabolism
no n/a no visible see above V 15766878 C->G
aPhenotype-causing mutant selected for.
S. Sarin et al.
6 SI
Table S3.
Genes Containing Splice Site Variants in Sequenced Genomes
Mutant Strain
Exon Associations
Identity Phenotype of
available mutants
RNAi phenotype
Phenotype of sequenced strain
Chr Start Class Base
change
Gene Modela
Unique splice site mutations
OH9330 F15E6.9 n/a Ste Dpy, Rol, slightly Egl IV 4298489 donor C->T
OH9331 T26E4.3 n/a no visible No visible V 15783175 acceptor G->A
OH8001 F09A5.9/ttr-34 Transthyretin-related family domain
n/a n/a Egl X 13140537 acceptor G->A
OH7677 K07C5.7/ttll-15 tubulin polyaminoacid ligase
no visible no visible Slight Unc, slight Egl V 10359883 acceptor G->A
OH8421 Y54G9A.3/kqt-3 KCNQ-like potassium channel subunits
n/a no visible No visible II 13708360 acceptor G->A
OH4247 K11G12.5 Mitochondrial
oxoglutarate/mal-ate carrier proteins
no visible no Slightly Slo X 6725104 donor C->T
OH8545 W04H10.3b.3/nhl-3 E3 ubiquitin ligase no visible no visible No visible II 595628 acceptor C->A
OH2042 F42A9.2/lin-49 PHD finger protein male tail, hindgut, Lvl, Let, Vul, small brood
Unc, slow growth, Ste
No visible IV 8624359 donor G->A
Common splice site mutations
OH4240, OH4247
C06E8.3b Protein kinase yes no visible no visible III 6990361 donor T->G
OH8421, OH7116, OH9305, OH4247, OH9330, OH9331, OH2042
F56D2.7/
ced-6
cell corpse engulfment during apoptosis
yes no visible no visible III 5595879 donor T->G
a Blue boxes represent exons. Orange boxes represent coding regions corresponding to Interpro-annotated protein domains (www.wormbase.org). Stars indicate position of splice site alleles uncovered by WGS. TABLE S3