ISSN(Online): 2319-8753 ISSN (Print): 2347-6710
International Journal of Innovative Research in Science,
Engineering and Technology
(An ISO 3297: 2007 Certified Organization) Website: www.ijirset.com
Vol. 6, Issue 9, September 2017
Combined Analysis of Phase Resolved Partial
Discharge Patterns using Statistical
Techniques
Kajol Kothoke1, P. A. Ghonge2
P.G. Student, Department of Electrical Engineering, Yadavrao Tasgaonkar Institute of Engineering And Technology, Maharashtra, India1
Associate Professor, Department of Electrical Engineering, Yadavrao Tasgaonkar Institute of Engineering And Technology, Maharashtra, India2
ABSTRACT: Partial discharges (PDs) in high-voltage (HV) insulating systems originate from various local defects, which further results in degradation of insulation and reduction in life span of equipment. One of the most widely used representations is phase-resolved PD (PRPD) patterns. For reliable operation of HV equipment, it is important to observe statistical characteristics of PDs and identify the properties of defect to ultimately determine the type of the defect. In this work, we have obtained and analysed combined use of PRPD patterns (φ-q), (φ-n) and (n-q) using statistical parameters such as skewness and kurtosis for (φ-q) and (φ-n),and mean, standard deviation, variance, skewness and kurtosis for (n-q).
KEYWORDS: Kurtosis, Partial Discharge, Phase- Resolved, Skewness and Statistical Techniques I. INTRODUCTION
PD is an incomplete electrical discharge that occurs between insulation or insulation and a conductor. Partial discharges occur wherever the electrical field is higher than the breakdown field of an insulating medium. There are two necessary conditions for a partial discharge to occur in a cavity: first, presence of a starting electron to initiate an avalanche and second, the electrical field must be higher than the ionization inception field of the insulating medium [1]. In general, PDs are concerned with dielectric materials used, and partially bridging the electrodes between which the voltage is applied. The insulation may consist of solid, liquid, or gaseous materials, or any combination of them. PD is the main reason for the electrical ageing and insulation breakdown of high voltage electrical apparatus. Different sources of PD give different effect on insulation performance. The occurrence of sparks, arcs and electrical discharges is a sure indication that insulation problems exist. Therefore, PD classification is important in order to evaluate the harmfulness of the discharge [11]. PD classification aims at the recognition of discharges of unknown origin. For many years, the process was performed by investigating the pattern of the discharge using the well known ellipse on an oscilloscope screen, which was observed crudely by eye. Nowadays, there has been extensive published research to identify PD sources by using intelligent technique like artificial neural networks, fuzzy logic, and acoustic emission [11].
There seems to be an expectation that, with sufficiently sophisticated digital processing techniques, it should be possible not only to gain new insight into the physical and chemical basis of PD phenomena, but also to define PD ‘patterns’ that can be used for identifying the characteristics of the insulation ‘defects’ at which the observed PD occur [2]. Broadly, there are three different categories of PD pulse data patterns gathered from the digital PD detectors during the experiments. They are: phase-resolved data, time-resolved data and data having neither phase nor time information. The phase-resolved data consist of three-dimensional discharge epoch, φ charge transfer, q discharge rate,
ISSN(Online): 2319-8753 ISSN (Print): 2347-6710
International Journal of Innovative Research in Science,
Engineering and Technology
(An ISO 3297: 2007 Certified Organization) Website: www.ijirset.com
Vol. 6, Issue 9, September 2017
variations in discharge pulse magnitudes against the amplitude of the test voltage, V (for both increasing and decreasing levels), i.e., q~V data [3].
There are many types of patterns that can be used for PD source identification. If these differences can be presented in terms of statistical parameters, identification of the defect type from the observed PD pattern may be possible [4]. As each defect has its own particular degradation mechanism, it is important to know the correlation between discharge patterns and the kind of defect. Therefore, progress in the recognition of internal discharge and their correlation with the kind of defect is becoming increasingly important in the quality control in insulating systems [5]. Researches have been carried out in recognition of partial discharge sources using statistical techniques and neural network. In our study, we have tested various internal and external discharges like void, surface and corona using statistical parameters such as skewness and kurtosis for (φ-q) and (φ-n) and mean, standard deviation, variance, skewness and kurtosis for (n-q).
II. STATISTICAL PARAMETERS
The important parameters to characterize PDs are phase angle φ, PD charge magnitude q and PD number of pulses n.
PD distribution patterns are composed of these three parameters. Statistical parameters are obtained for phase resolved patterns (φ-q), (φ-n) and (n-q).
II.I. Processing of data
The data to be processed obtained from generator includes φ, q, n andvoltage V. From this data, phase resolved patterns are obtained.
II.I.A Analysis of Phase-Resolved (φ-q) and (φ-n) using Statistical Techniques
Fig.1 (a) Block diagram of discharge analysis for (φ-q) Fig.1 (a) Block diagram of discharge analysis for (φ-q) PD pulses are grouped by their phase angle with respect to 50 (± 5) Hz sine wave. Consequently, the voltage cycle is divided into phase windows representing the phase angle axis (0 to 360’). If the observations are made for several voltage cycles, the statistical distribution of individual PD events can be determined in each phase window. The mean values of these statistical distributions results in two dimensional patterns of the observed PD patterns throughout the whole phase angle axis [6]. A two-dimensional (2D) distribution φ-q and φ-n represents PD charge magnitude ‘q’ and
PD number of pulses ‘n’ as a function of the phase angle ‘φ’ [3].
The mean pulse height distribution Hqn(φ) is the average PD charge magnitude in each window as a function of the
phase angle φ. The pulse count distribution Hn(φ) is the number of PD pulses in each window as a function of phase
angle φ. These two quantity are further divided into two separate distributions of the negative and positive half cycle
resulting in four different distributions to appear: for the positive half of the voltage cycle Hqn+(φ) and Hn+(φ) and for
the negative half of the voltage cycle Hqn-(φ) and Hn-(φ) [5]. For a single defect, PD quantities can be described by the
normal distribution. The distribution profiles of Hqn(φ) and Hn(φ) have been modeled by the moments of the normal
ISSN(Online): 2319-8753 ISSN (Print): 2347-6710
International Journal of Innovative Research in Science,
Engineering and Technology
(An ISO 3297: 2007 Certified Organization) Website: www.ijirset.com
Vol. 6, Issue 9, September 2017
Skewness(S ) = ∑ (x −µ) f(x )
σ ∑ f(x ) … … … (1)
Kurtosis:(K ) = ∑ (x −µ) f(x )
σ ∑ f(x ) −3 … … … (2)
Skewness and Kurtosis are evaluated with respect to a reference normal distribution. Skewness is a measure of asymmetry or degree of tilt of the data with respect to normal distribution. If the distribution is symmetric, Sk=0; if it is asymmetric to the left, Sk>0; and if it is asymmetric to the right, Sk<0. Kurtosis is an indicator of sharpness of distribution. If the distribution has same sharpness as a normal distribution, then Ku=0. If it is sharper than normal, Ku>0, and if it is flatter, Ku<0 [3] [7].
II.I.B Analysis of Phase-Resolved (q-n) using Statistical Techniques
Fig. 2 Block diagram of discharge analysis for (n-q)
Statistical analysis is applied for the computation of several statistical operators. The definitions of most of these statistical operators are described below. The profile of all these discrete distribution functions can be put in a general function, i.e., yi=f(xi). The statistical operators can be computed as follows:
MeanValue:(μ) = ∑ (x )f(x )
∑ f(x ) … … … (3)
Variance:(σ ) = ∑ ( μ) ( )
∑ ( ) … … … (4)
Standard Deviation = √ … … … (5)
Skewness and Kurtosis are evaluated with respect to a reference normal distribution. Skewness is a measure of asymmetry or degree of tilt of the data with respect to normal distribution. If the distribution is symmetric, Sk=0; if it is asymmetric to the left, Sk>0; and if it is asymmetric to the right, Sk<0. Kurtosis is an indicator of sharpness of distribution. If the distribution has same sharpness as a normal distribution, then Ku=0. If it is sharper than normal, Ku>0, and if it is flatter, Ku<0 [3] [8].
III. RESULTS AND DISCUSSIONS
Analysis involves determining unknown PD patterns by comparing those with known PD patterns such as void, surface and corona. The comparison is done with respect to their statistical parameters [9] [10].
III.I Analysis for (φ-q)
ISSN(Online): 2319-8753 ISSN (Print): 2347-6710
International Journal of Innovative Research in Science,
Engineering and Technology
(An ISO 3297: 2007 Certified Organization) Website: www.ijirset.com
Vol. 6, Issue 9, September 2017
III.I.A 2D distribution of (φ-q) for known PD patterns
Fig.3 (a), Fig.3 (b) and Fig.3 (c) are the phase φ vs. charge q plot for void, surface and corona discharges respectively.
Fig.3(a).Phase plot (φ-q) of void discharge
Fig.3(b).Phase plot (φ-q) of surface discharge
Fig.3(c).Phase plot (φ-q) of corona discharge
III.I.B Parameters of known PD patterns
TABLE I. PARAMETERS OF KNOWN PD PATTERNS Parameter void surface corona Skewness Hqn+(φ) 1.0013 1.2134 0.3555
Skewness Hqn-(φ) 0.9901 1.8219 1.3659
Kurtosis Hqn+(φ) 2.9046 3.6064 2.4354
Kurtosis Hqn-(φ) 2.7872 5.4506 7.5947
III.I.C 2D distribution of (φ-q) for unknown PD patterns
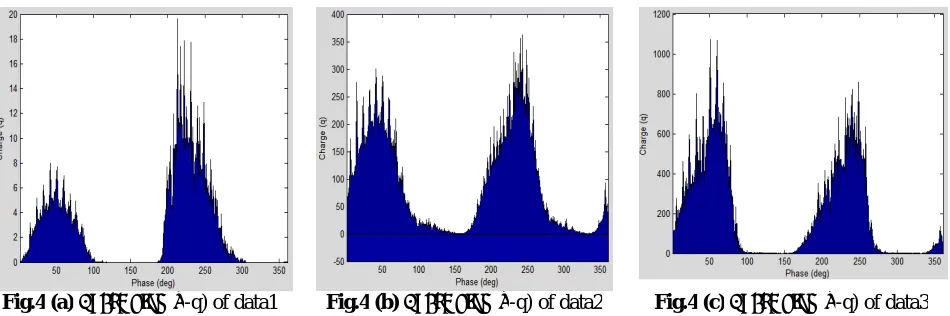
Fig.4 (a), Fig.4 (b) and Fig.4 (c) are the phase φ vs. charge q plot for data1, data2 and data3 respectively.
Fig.4 (a) Phase plot (φ-q) of data1 Fig.4 (b) Phase plot (φ-q) of data2 Fig.4 (c) Phase plot (φ-q) of data3
ISSN(Online): 2319-8753 ISSN (Print): 2347-6710
International Journal of Innovative Research in Science,
Engineering and Technology
(An ISO 3297: 2007 Certified Organization) Website: www.ijirset.com
Vol. 6, Issue 9, September 2017
III.I.D Parameters of unknown PD Patterns
TABLE II. PARAMETERS OF UNKNOWN PD PATTERNS Parameter data1 data2 data3
Skewness Hqn+(φ) 0.8991 0.7456 1.0013
Skewness Hqn-(φ) 1.1833 0.8509 0.9901
Kurtosis Hqn+(φ) 2.5719 2.1814 2.9046
Kurtosis Hqn-(φ) 3.7467 2.6512 2.7872
III.II Analysis for (φ-n)
The phase resolved (φ-n) patterns consist of three known PD patterns: void, surface and corona (as discussed in 3.2.1) and three unknown PD patterns: data1, data2 and data3 (as discussed in 3.2.3) [9]. The plots are discussed below:
III.II.A Phase resolved plot (φ-n) of known PD patterns
Fig.5 (a), Fig.5 (b) and Fig.5 (c) are the phase φ vs. number of pulses n for void, surface and corona discharges respectively.
Fig.5(a).Phase plot (φ-n) of void discharge
Fig.5(b).Phase plot (φ-n) of surface discharge
Fig.5(c).Phase plot (φ-n) of corona discharge
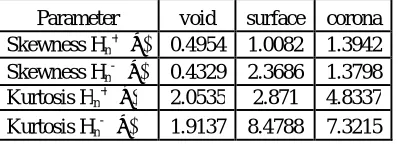
III.II.B Parameters of unknown PD Patterns
TABLE III. PARAMETERS OF KNOWN PD PATTERNS Parameter void surface corona Skewness Hn+(φ) 0.4954 1.0082 1.3942
Skewness Hn-(φ) 0.4329 2.3686 1.3798
Kurtosis Hn+(φ) 2.0535 2.871 4.8337
Kurtosis Hn-(φ) 1.9137 8.4788 7.3215
ISSN(Online): 2319-8753 ISSN (Print): 2347-6710
International Journal of Innovative Research in Science,
Engineering and Technology
(An ISO 3297: 2007 Certified Organization) Website: www.ijirset.com
Vol. 6, Issue 9, September 2017
III.II.C. Phase resolved plot (φ-n) of unknown PD patterns
Fig.6 (a), Fig.6 (b) and Fig.6 (c) are the phase φ vs. number of pulses n plot for data1, data2 and data3 respectively.
Fig.6(a).Phase plot (φ-n) of data1 Fig.6(b).Phase plot (φ-n) of data2 Fig.6(c).Phase plot (φ-n) of data3 From Fig.6 (a), it is seen that the following plot is similar to void and surface discharge. Fig.6 (b), is similar to void discharge and Fig.6 (c), is also similar to void discharge
III.II.D Parameters of unknown PD patterns
TABLE IV. PARAMETERS OF UNKNOWN PD PATTERNS Parameter data1 data2 data3
Skewness Hn+(φ) 0.8016 0.574 0.4954
Skewness Hn-(φ) 1.0169 0.42 0.4329
Kurtosis Hn+(φ) 2.3724 2.1091 2.0535
Kurtosis Hn-(φ) 3.2011 1.8003 1.9137
III.III Analysis for (n-q)
The phase resolved patterns n-q are obtained for three known PD patterns: void, surface and corona (as discussed in 3.3.1) and three unknown PD patterns: data1, data2 and data3 (as discussed in 3.3.3) [10].
III.III.A 2D distribution of n-q for known PD patterns
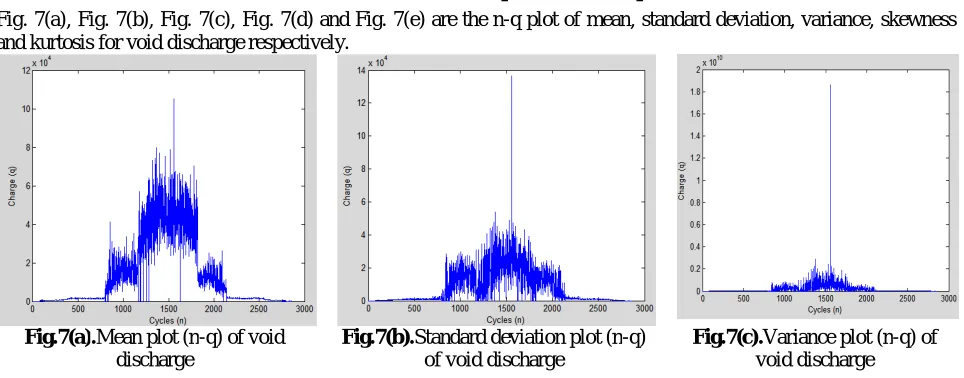
Fig. 7(a), Fig. 7(b), Fig. 7(c), Fig. 7(d) and Fig. 7(e) are the n-q plot of mean, standard deviation, variance, skewness and kurtosis for void discharge respectively.
Fig.7(a).Mean plot (n-q) of void discharge
Fig.7(b).Standard deviation plot (n-q) of void discharge
ISSN(Online): 2319-8753 ISSN (Print): 2347-6710
International Journal of Innovative Research in Science,
Engineering and Technology
(An ISO 3297: 2007 Certified Organization) Website: www.ijirset.com
Vol. 6, Issue 9, September 2017
Fig.7 (d) Skewness plot (n-q) of void discharge Fig.7 (e) Kurtosis plot (n-q) of void discharge
Referring to Fig. 7 (a), Fig. 7 (b) and Fig. 7 (c) of void discharge, it can be seen there is a peak occurring somewhere after 1500 cycle, which is a void discharge and in Fig. 7 (d) and Fig. 7 (e) of skewness and kurtosis, the value decreases at that cycle where peak occurs.
Fig. 8(a), Fig. 8(b), Fig. 8(c), Fig. 8(d) and Fig. 8(e) are the n-q plot of mean, standard deviation, variance, skewness and kurtosis for surface discharge respectively.
Fig.8 (a) Mean plot (n-q) of surface discharge
Fig.8 (b) Standard deviation plot (n-q) of surface discharge
Fig.8 (c) Variance plot (n-q) of surface discharge
Fig.8 (d) Skewness plot (n-q) of surface discharge
Fig.8 (e) Kurtosis plot (n-q) of surface discharge
ISSN(Online): 2319-8753 ISSN (Print): 2347-6710
International Journal of Innovative Research in Science,
Engineering and Technology
(An ISO 3297: 2007 Certified Organization) Website: www.ijirset.com
Vol. 6, Issue 9, September 2017
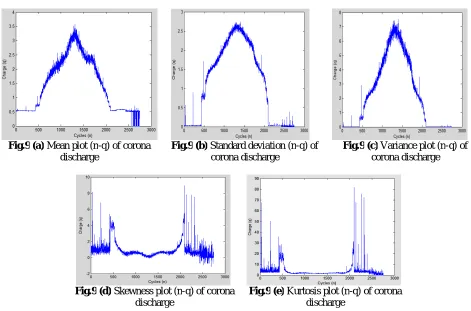
Fig. 9(a), Fig. 9(b), Fig. 9(c), Fig. 9(d) and Fig. 9(e) are the n-q plot of mean, standard deviation, variance, skewness and kurtosis for corona discharge respectively.
Fig.9 (a) Mean plot (n-q) of corona discharge
Fig.9 (b) Standard deviation (n-q) of corona discharge
Fig.9 (c) Variance plot (n-q) of corona discharge
Fig.9 (d) Skewness plot (n-q) of corona discharge
Fig.9 (e) Kurtosis plot (n-q) of corona discharge
Referring to Fig. 9(a), Fig. 9(b) and Fig. 9(c) of corona discharge, it can be seen the charges starts occurring after 500 cycle increasing somewhere upto 1200 cycle and then decreasing after 2000 cycle, and in Fig. 9(d) and Fig. 9(e) of skewness and kurtosis, the value decreases from 500 cycle till 2000 cycle.
III.III.B Parameters of known PD patterns
TABLE V. PARAMETERS OF KNOWN PD PATTERNS Parameters Void Surface Corona Mean 13320.32 145.706 1.426 Standard deviation 7553.716 126.009 1.139 Variance 1.64*108 17921.01 2.279 Skewness 3.66*10-17 0.809 0.26 Kurtosis 0.04878 2.442 0.966
III.III.C 2D distribution of (n-q) for unknown PD patterns
ISSN(Online): 2319-8753 ISSN (Print): 2347-6710
International Journal of Innovative Research in Science,
Engineering and Technology
(An ISO 3297: 2007 Certified Organization) Website: www.ijirset.com
Vol. 6, Issue 9, September 2017
Fig.10 (a) Mean plot (n-q) of data1 Fig.10 (b) Standard deviation plot (n-q) of data1
Fig.10 (c) Variance plot (n-q) of data1
Fig.10 (d) Skewness plot (n-q) of data1 Fig.10 (e) Kurtosis plot (n-q) of data1
In Fig. 10(a), Fig. 10(b), Fig. 10(c), Fig. 10(d) and Fig. 10(e), the charges are uniformly distributed similar to surface discharge. Hence, it can be concluded that data1 is having surface discharge.Fig. 11(a), Fig.11(b), Fig. 11(c), Fig. 11(d) and Fig. 11(e) are the n-q plot of mean, standard deviation, variance, skewness and kurtosis for data2 respectively.
Fig.11 (a) Mean plot (n-q) of data2 Fig.11 (b) Standard deviation plot (n-q) of data2
ISSN(Online): 2319-8753 ISSN (Print): 2347-6710
International Journal of Innovative Research in Science,
Engineering and Technology
(An ISO 3297: 2007 Certified Organization) Website: www.ijirset.com
Vol. 6, Issue 9, September 2017
Fig.11 (d) Skewness plot (n-q) of data2 Fig.11 (e) Kurtosis plot (n-q) of data2
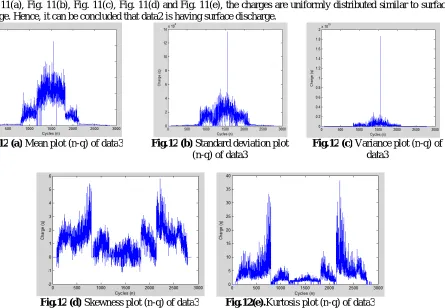
In Fig. 11(a), Fig. 11(b), Fig. 11(c), Fig. 11(d) and Fig. 11(e), the charges are uniformly distributed similar to surface discharge. Hence, it can be concluded that data2 is having surface discharge.
Fig.12 (a) Mean plot (n-q) of data3 Fig.12 (b) Standard deviation plot (n-q) of data3
Fig.12 (c) Variance plot (n-q) of data3
Fig.12 (d) Skewness plot (n-q) of data3 Fig.12(e).Kurtosis plot (n-q) of data3
ISSN(Online): 2319-8753 ISSN (Print): 2347-6710
International Journal of Innovative Research in Science,
Engineering and Technology
(An ISO 3297: 2007 Certified Organization) Website: www.ijirset.com
Vol. 6, Issue 9, September 2017
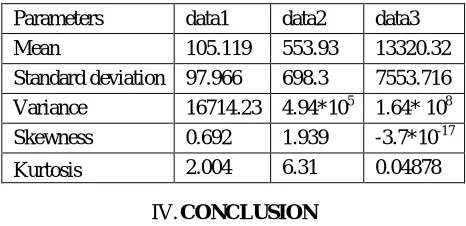
III.III.D Parameters of unknown PD patterns
TABLE VI. PARAMETERS OF UNKNOWN PD PATTERNS Parameters data1 data2 data3 Mean 105.119 553.93 13320.32 Standard deviation 97.966 698.3 7553.716 Variance 16714.23 4.94*105 1.64* 108 Skewness 0.692 1.939 -3.7*10-17 Kurtosis 2.004 6.31 0.04878
IV.CONCLUSION
From all the above observations using all the three phase-resolved patterns(φ-q), (φ-n) and (n-q), it can be concluded that, data1 is surface discharge in all the three phase-resolved patterns, data2 is surface discharge in (n-q) pattern and void discharge in (φ-q) and (φ-n), hence data2 is both void and surface discharge and data3 is void discharge in all the three phase-resolved patterns.
REFERENCES
[1] MICAMAXXTM plus – Partial Discharge Basics
[2] M. G. Danikas, “The Definitions Used for Partial Discharge Phenomena,” IEEE Trans. Elec. Insul., Vol. 28, pp. 1075-1081, 1993.
[3] N.C. Sahoo, M. M. A. Salama, R. Bartnikas, “Trends in Partial Discharge Pattern Classification: A Survey”, IEEE Transactions on Dielectrics and Electrical Insulation, Vol. 12, No. 2; April 2005.
[4] E. Gulski, J. Smith, R. Brooks, “Partial Discharge Databases for Diagnosis Support of HV Components”, IEEE Symposium on Electrical Insulation, pp. 424-427, 1998
[5] E. Gulski and F. H. Kreuger, “Computer-aided recognition of Discharge Sources,” IEEE Transactions on Electrical Insulation, Vol. 27 No. 1, February 1002.
[6] E. Gulski and A. Krivda, “Neural Networks as a Tool for Recognition of Partial Discharges”, IEEE Transactions on Electrical Insulation, Vol. 28 No.8, December 1993.
[7] F. H. Kreuger, E. Gulski and A. Krivda, “Classification of Partial Discharges”, IEEE Transactions on Electrical Insulation, Vol. 28 No. 6, December1993.
[8] C. Chang and Q. Su, “Statistical Characteristics of Partial Discharges from a Rod-Plane Arrangement”
[9] Namrata Bhosale, Priyanka Kothoke Amol Deshpande, Dr. Alice Cheeran, “Analysis of Partial Discharge using Phase-Resolved(φ-q) and (φ-n) Statistical Techniques”, International Journal of Engineering Research and Technology, Vol. 2 (05), 2013,ISSN2278-0181.
[10] Priyanka Kothoke, Namrata Bhosale, Amol Deshpande, Dr. Alice Cheeran, “Analysis of Partial Discharge using Phase-Resolved (n-q) Statistical Techniques”, International Journal of Engineering Research and Applications.
Proceedings papers: