ISSN(Online): 2319-8753 ISSN (Print) : 2347-6710
I
nternational
J
ournal of
I
nnovative
R
esearch in
S
cience,
E
ngineering and
T
echnology
(An ISO 3297: 2007 Certified Organization)
Vol. 5, Issue 6, June 2016
Design, Optimization and Stiffness Analysis of
De Adaptor for Alternator
Sneha A. Bramhankar1, P. N. Deshmukh2, Swapnil S. Barekar3
Department of Mechanical Engineering, RMD Sinhgad School of Engineering, Warje, Pune, India1, 2 Cummins India Ltd., Pune, India3
ABSTRACT: An alternator helps to converts mechanical energy to electrical energy. Adaptor is the part of alternator
which is mounted on the driving end side. Alternator is connected to engine’s flywheel housing through Drive End Adaptor. During operation of the alternator, DE adaptor undergoes various types of loads. There are several technical requirements for designing the DE adaptor. Stiffness and modal frequency are the main technical requirements for DE adaptor. These requirements depends on various geometrical parameters such as numbers of rib, dimension of rib, flange thickness(frame fixing), flange thickness(flywheel housing), flange PCD( SAE), flange PCD- Alternator side, number of hole, material. The intent of this paper is to investigate the effect of each parameter and therefore the combination of various parameters on stiffness and modal frequency. This paper will provide the guidelines to the designer for designing DE adaptor for different ratings.
KEYWORDS: DE Adaptor, Alternator, Stiffness, Finite Element Analysis, RSM
I. INTRODUCTION
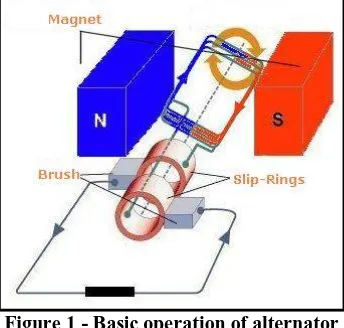
An alternator is an electrical generator that converts mechanical energy to electrical energy in the form of alternating current. For reasons of cost and simplicity, most alternators use a rotating magnetic field with a stationary armature. Occasionally, a linear alternator or a rotating armature with a stationary magnetic field is used. In principle, any AC electrical generator can be called an alternator, but usually the term refers to small rotating machines driven by automotive and other internal combustion engines. An alternator that uses a permanent magnet for its magnetic field is called a magneto. Alternators in power stations driven by steam turbines are called turbo-alternators.
Figure 1 - Basic operation of alternator
ISSN(Online): 2319-8753 ISSN (Print) : 2347-6710
I
nternational
J
ournal of
I
nnovative
R
esearch in
S
cience,
E
ngineering and
T
echnology
(An ISO 3297: 2007 Certified Organization)
Vol. 5, Issue 6, June 2016
moving relative to a magnetic field develops an electromotive force (EMF) in it, (Faraday's Law). This emf reverses its polarity when it moves under magnetic poles of opposite polarity. Typically, a rotating magnet, called the rotor turns within a stationary set of conductors wound in coils on an iron core, called the stator. The field cuts across the conductors, generating an induced EMF (electromotive force), as the mechanical input causes the rotor to turn. [14]The rotating magnetic field induces an AC voltage in the stator windings. Since the currents in the stator windings vary in step with the position of the rotor, an alternator is a synchronous generator [13].Alternator's generated voltage by varying the current in the rotor field winding. Permanent magnet machines avoid the loss due to magnetizing current in the rotor, but are restricted in size, due to the cost of the magnet material. Since the permanent magnet field is constant, the terminal voltage varies directly with the speed of the generator. Brushless AC generators are usually larger machines than those used in automotive applications. An automatic voltage control device controls the field current to keep output voltage constant. If the output voltage from the stationary armature coils drops due to an increase in demand, more current is fed into the rotating field coils through the voltage regulator (VR). This increases the magnetic field around the field coils which induces a greater voltage in the armature coils. Thus, the output voltage is brought back up to its original value.
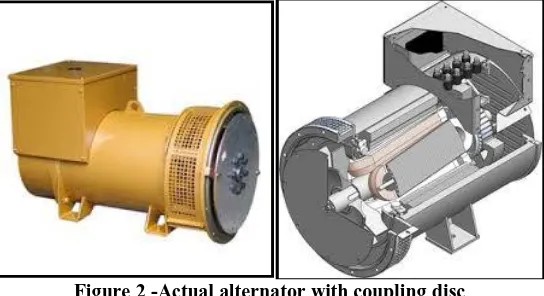
Figure 2 -Actual alternator with coupling disc
Practical case of the alternator in generator is as shown in figure. It contains different parts such as drive and non-drive end adaptor, stator, rotor, coupling disc, fan, terminal box, shaft, exciter assembly, permanent magnet regulator and frame. Rotor assembly on rotor shaft rotates since the coupling disc is mounted on the rotor shaft which takes the rotation from flywheel since flywheel is coupled with coupling disc. Generated electricity is taken at the terminal box which is at the top of the frame as shown in the fig no 1.2[14].
II. LITERATURE REVIEW
ISSN(Online): 2319-8753 ISSN (Print) : 2347-6710
I
nternational
J
ournal of
I
nnovative
R
esearch in
S
cience,
E
ngineering and
T
echnology
(An ISO 3297: 2007 Certified Organization)
Vol. 5, Issue 6, June 2016
by a statistical design of experiments known as central composite design (CCD). The analysis of variance (ANOVA) shows that the observed data fits well into the assumed second order RSM model [2].
G. Zeng and others studied “Optimization design of roll profiles for cold roll forming based on response surface method”. They have stated that based on the RSM, this paper presents the study on the optimization design for CRF of a channel section. Equiradial design method is used to create a second-order response surface model that represents the relationship between FAI, roll radius and MEMLS, and a first-order response surface model that capture the relationship between FAI, roll radius and spring back angle, respectively. In the optimization process the spring back angle and MEMLS at each stand are defined as the objective function and constraint condition, respectively [3].
N. Roussouly, F. Petitjean, M. Salaun in there paper “A new adaptive response surface method for reliability analysis” states that response surface method is a convenient tool to assess reliability for a wide range of structural mechanical problems. More specifically, adaptive schemes which consist in iteratively refine the experimental design close to the limit state have received much attention. However, it is generally difficult to take into account a lot of variables and to well handle approximation error. The method, proposed in this paper, addresses these points using sparse response surface and a relevant criterion for results accuracy. For this purpose, a response surface is built from an initial Latin Hypercube Sampling (LHS) where the most significant terms are chosen from statistical criteria and cross-validation method. At each step, LHS is refined in a region of interest defined with respect to an importance level on probability density in the design point. Two convergence criteria are used in the procedure: The first one concerns localization of the region and the second one the response surface quality. Finally, a bootstrap method is used to determine the influence of the response error on the estimated probability of failure. This method is applied to several examples and results are discussed. RS method is an interesting tool when relation between inputs and outputs is quite regular. But problems of computational time may arise even when a moderate number of input variables is taken into account. Also, although this method has been widely used, it is often difficult to be very confident in results because of the difficulty to quantify error due to approximation [4].
P.N.L.Pavani, B.K.Prafulla, R.PolaRao (2014) in their paper titled “Design, Modeling and Structural Analysis of Wave Springs” has stated that the property like stiffness of the spring was studied with finite element analysis. Structural analysis is done to validate the strength. Structural analysis has been conducted on the wave spring by varying the spring material such as Structural steel and Beryllium Copper. For this analysis, loads are considered as bike weight, single person and two persons. Structural analysis is done to validate the strength [5].
Rahul and Kaushik Kumar (2014) in their paper titled “Design and Optimization of Portable Foot Bridge” has stated that the basic emphasis has been given to minimize the total deformation of the structural member by optimizing the cross sections, material properties and weight. Six different cross sections (circular, rectangular and square with solid and hollow sections) of the beam with three different materials (Aluminium alloy, Structural steel and Titanium alloy) were analysed in ANSYS 11.0 with similar loading and support conditions. A three dimensional model developed in SolidWorks was imported to ANSYS and then mess generation and post processing was done. Maximum deformation was observed for aluminium material wherein it was minimum in case of structural steel [6].
ISSN(Online): 2319-8753 ISSN (Print) : 2347-6710
I
nternational
J
ournal of
I
nnovative
R
esearch in
S
cience,
E
ngineering and
T
echnology
(An ISO 3297: 2007 Certified Organization)
Vol. 5, Issue 6, June 2016
III. OBJECTIVE
1. Design of drive end adaptor for the alternator with high stiffness in various directions like horizontal, vertical, and axial with enough strength against various loads acting on it.
2. Modal analysis and Stress calculation of DE adaptor.
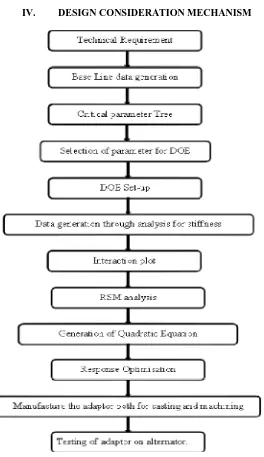
IV. DESIGN CONSIDERATION MECHANISM
ISSN(Online): 2319-8753 ISSN (Print) : 2347-6710
I
nternational
J
ournal of
I
nnovative
R
esearch in
S
cience,
E
ngineering and
T
echnology
(An ISO 3297: 2007 Certified Organization)
Vol. 5, Issue 6, June 2016
V. ANALYSIS APPROACH
It is difficult to find the stiffness in various directions for each iteration by experimentally. Finite element method is used to calculate the stiffness. Therefore Ansys Workbench16.0 software is used for analysis.For finding the stiffness in horizontal, vertical and axial direction; fix the surface of the adaptor from the frame side. The surface is created in such a way that the diameter at each hole has twice the diameter of the bolt size which is used for the bolting. In actual case the adaptor is fixed from both the sides but in analysis we cannot fix both the surfaces because it will give zero deflection. Therefore create a point mass with reference to the surface of the adaptor which is going to bolt with the flywheel side and make the behaviour of the point mass as rigid. The important thing while creating the point mass is that its value. Since stiffness is proportional to the mass; the value of point mass applied should be in the order of the 10-10kilogram which is very less. Now apply the force in various directions and measure the deflection in respective direction. By using certain formulas stiffness is calculated.From the structural stability point of view stiffness due to application of force and moment should be high enough. Therefore we need to check the stiffness in vertical, horizontal and axial direction. In tune with this moment in horizontal and vertical direction and torsional stiffness also need to check. If calculated values are less than the expected value then again changes are made in the model so as to get desirable values. For stress analysis of the drive end adaptor fix the back surface of the adaptor and apply the various loads acting on it. Check the deformation and stress depending on material selection. If necessary give convergence criteria for the stresses to be obtained. Make appropriate changes in the model till we get maximum stiffness and better stability against the various loads acting on it.
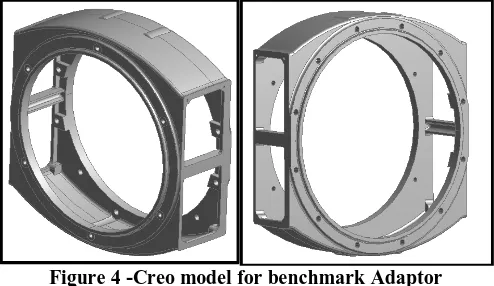
5.1. Stiffness Calculation for Benchmark
Stiffness of benchmark model is calculated using finite element method. For that modelling for drive end adaptor is done with Creo2.0. Stiffness in various directions due to force and moment are calculated using ansys workbench as followed.
Figure 4 -Creo model for benchmark Adaptor
5.2. Mesh Model
ISSN(Online): 2319-8753 ISSN (Print) : 2347-6710
I
nternational
J
ournal of
I
nnovative
R
esearch in
S
cience,
E
ngineering and
T
echnology
(An ISO 3297: 2007 Certified Organization)
Vol. 5, Issue 6, June 2016
Figure 5 - Mesh model
5.3. Boundary condition and setup
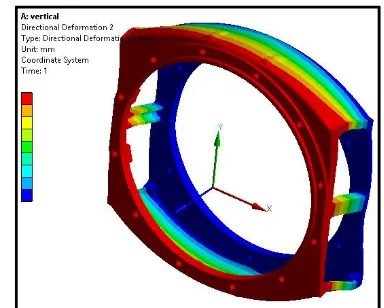
Frame side area is fixed by creating the circular surface at the hole position. Point mass is attached at the surface which is going to fix with the Flywheel housing. Force and moment in various directions like vertical horizontal and axial direction is applied in order to measure the deformation.
Results
Deformation in various direction due to force and moment is obtained as follows
Figure 6 - Deformation in vertical direction due to force
ISSN(Online): 2319-8753 ISSN (Print) : 2347-6710
I
nternational
J
ournal of
I
nnovative
R
esearch in
S
cience,
E
ngineering and
T
echnology
(An ISO 3297: 2007 Certified Organization)
Vol. 5, Issue 6, June 2016
Figure 8 - Deformation in axial direction due to force
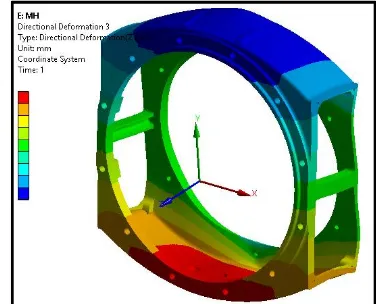
Figure 9 - Deformation due to moment about vertical
ISSN(Online): 2319-8753 ISSN (Print) : 2347-6710
I
nternational
J
ournal of
I
nnovative
R
esearch in
S
cience,
E
ngineering and
T
echnology
(An ISO 3297: 2007 Certified Organization)
Vol. 5, Issue 6, June 2016
Figure 11 - Deformation due to moment axial
Table 1 - Stiffness comparison for Different material
Sr.
No. Load Condition Point of Application Stiffness (steel) Stiffness (CI) Stiffness (Al)
1 F=1000 N Vertical 4.67E+05 2.57E+05 1.66E+05 2 F=1000 N Horizontal 4.67E+05 2.57E+05 1.66E+05 3 F=1000 N Axial 1.47E+06 8.01E+05 5.26E+05 4 Mt=1000 N-mm About Vertical 2.85E+08 1.60E+08 1.02E+08 5 Mt=1000 N-mm About Horizontal 2.58E+08 1.60E+08 1.02E+08 6 Mt=1000 N-mm Torsional 4.24E+10 2.35E+10 1.50E+10
5.4. Frequency calculation
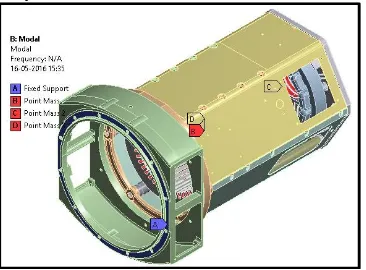
In order to calculate the bending frequency Alternator with drive end adaptor, frame, stator lamination, non-drive end adaptor is considered. Necessary point mass at centre of gravity of rotor is applied. Drive end adaptor face is fixed and natural frequency is calculated using ansys.
ISSN(Online): 2319-8753 ISSN (Print) : 2347-6710
I
nternational
J
ournal of
I
nnovative
R
esearch in
S
cience,
E
ngineering and
T
echnology
(An ISO 3297: 2007 Certified Organization)
Vol. 5, Issue 6, June 2016
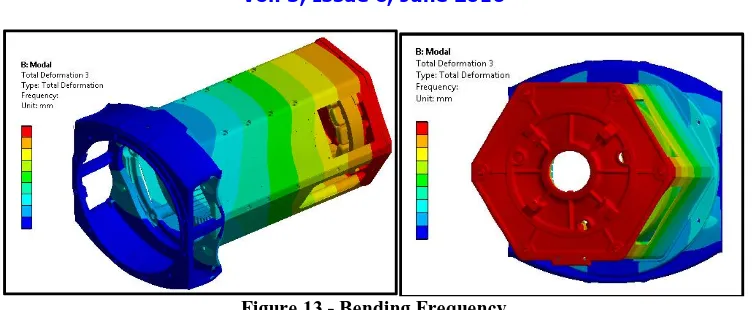
Figure 13 - Bending Frequency
Bending frequency is obtained as 79.32 Hz
5.5. Sample Calculation using Mathematical Formulae
Calculation using Mathematical Formulae are as follows
Stiffness Due To Force
……….. (1)
Stiffness Due To Moment
..………. (2)
Where, = Deflection
Geometry of the DE adaptor is complicated hence it is terribly difficult to calculate the precise deflection by victimization the mathematical formula and by hand calculations. Therefore the minimum cross sectional space is thought of to search out the deflection.
Bending Deformation
….…………... (3)
Axial Deformation
….…………... (4)
By performing different experiments it is finalised that the result obtained from the ansys are correct. Hence there is no need to do hand calculation each time.
VI. DRIVE END ADAPTOR OPTIMIZATION
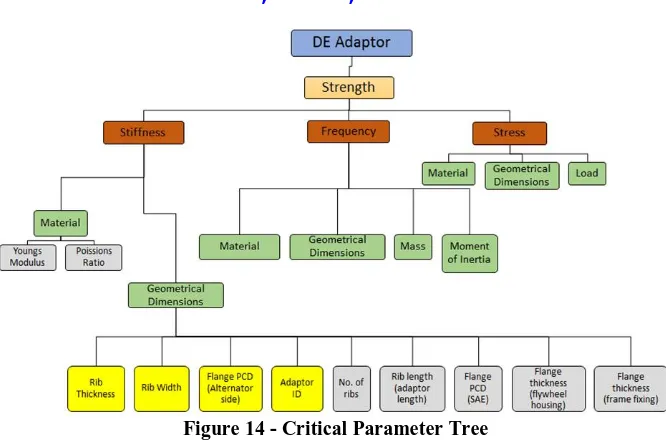
Stiffness is the basic criteria to pass the drive end adaptor. Stiffness of the adaptor is depends on the several factors like rib thickness, rib width, flange thickness, pitch circle diameter of the frame and adaptor width which are geometrical factor. Along with this other parameters like material type and hole position also affects the stiffness. Therefore Critical Parameter Tree is created for easy understanding of the affecting parameter.
=
=
Stiffness=
ISSN(Online): 2319-8753 ISSN (Print) : 2347-6710
I
nternational
J
ournal of
I
nnovative
R
esearch in
S
cience,
E
ngineering and
T
echnology
(An ISO 3297: 2007 Certified Organization)
Vol. 5, Issue 6, June 2016
Figure 14 - Critical Parameter Tree
It is very difficult to analyse the parameter which influence the stiffness value of the adaptor. It will be time consuming to do the analysis for every change in the affecting parameter. This problem is eliminated by using certain Design of Experiment technique called as Response Surface Technique. Critical parameters were taken in to consideration for carrying out the DOE. Minitab software is used to set up the table for which analysis is required by giving the certain range value for each variable. After inputting all the parameter there were total 31 combination obtained.Stiffness analysis of drive end adaptor is done for these 31 different combinations obtained from Minitab and stiffness values are obtained.
Figure 15 - DOE combination with analysis result Rib Thk Rib
Width Adaptor ID PCD (ALT) Vertical Stiffness Horizontal Stiffness Axial Stiffness M_Vertical Stiffness M_Horizontal Stiffness Torsional Stiffness
15 25 400 360 100.00% 100.00% 100.00% 100.00% 100.00% 100.00%
25 25 400 360 51.77% 52.03% 29.81% 15.30% 15.71% 53.45%
15 50 400 360 139.44% 138.74% 44.77% 39.23% 39.55% 195.85%
25 50 400 360 233.26% 233.45% 93.88% 45.71% 65.74% 345.51%
15 25 450 360 -2.66% -3.19% -63.82% -53.99% -53.79% 26.25%
25 25 450 360 46.12% 45.33% -50.88% -48.51% -49.70% 91.62%
15 50 450 360 119.64% 118.52% -53.41% -43.80% -44.58% 285.81% 25 50 450 360 193.59% 192.25% -33.46% -37.96% -34.66% 459.93%
15 25 400 380 11.26% 11.35% 59.95% 68.57% 67.55% 4.66%
25 25 400 380 75.77% 76.24% 113.33% 105.09% 105.92% 60.27%
15 50 400 380 176.36% 175.88% 151.35% 157.10% 156.50% 212.49% 25 50 400 380 294.68% 295.65% 229.95% 192.97% 209.81% 371.09%
15 25 450 380 7.07% 6.44% -42.11% -24.86% -24.45% 28.61%
25 25 450 380 67.63% 66.76% -24.56% -15.33% -16.80% 95.80%
15 50 450 380 156.59% 155.27% -24.28% -5.20% -4.82% 300.41%
25 50 450 380 252.25% 250.54% 6.04% 4.38% 8.67% 486.11%
15 37.5 425 370 87.95% 87.07% -7.46% 4.71% 5.15% 133.47%
25 37.5 425 370 166.96% 165.63% 24.18% 15.07% 19.16% 241.70%
20 25 425 370 43.41% 42.69% -10.98% -3.95% -3.65% 48.87%
20 50 425 370 222.51% 220.90% 25.95% 28.41% 30.13% 354.46%
20 37.5 400 370 126.36% 126.66% 96.89% 86.90% 87.68% 150.07% 20 37.5 450 370 109.30% 108.20% -35.13% -24.93% -26.11% 213.01% 20 37.5 425 360 107.85% 106.96% -17.62% -16.95% -16.66% 182.88% 20 37.5 425 380 143.31% 142.27% 37.81% 47.49% 48.10% 194.52%
20 37.5 425 370 129.95% 128.85% 8.44% 13.96% 14.31% 189.64%
20 37.5 425 370 129.95% 128.85% 8.44% 13.96% 14.31% 189.64%
20 37.5 425 370 129.95% 128.85% 8.44% 13.96% 14.31% 189.64%
20 37.5 425 370 129.95% 128.85% 8.44% 13.96% 14.31% 189.64%
20 37.5 425 370 129.95% 128.85% 8.44% 13.96% 14.31% 189.64%
20 37.5 425 370 129.95% 128.85% 8.44% 13.96% 14.31% 189.64%
ISSN(Online): 2319-8753 ISSN (Print) : 2347-6710
I
nternational
J
ournal of
I
nnovative
R
esearch in
S
cience,
E
ngineering and
T
echnology
(An ISO 3297: 2007 Certified Organization)
Vol. 5, Issue 6, June 2016
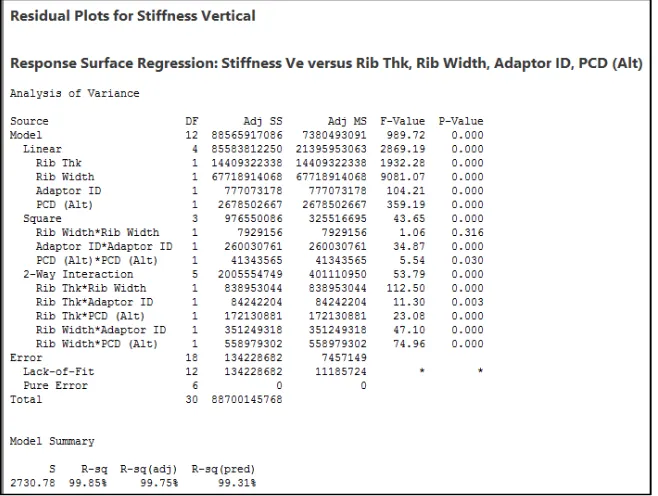
As shown in above figure stiffness values due to application of force and moment in vertical, horizontal and axial direction is done using ansys. The above data shown in figure is used for the optimization of the drive end adaptor.There are many methods through which we can do the optimization out of which response surface methodology is used for this case. A response surface design is a set of advanced design of experiments techniques that help to better understand and optimize response. Response surface design methodology is often used to refine models after determining important factors using factorial designs. Here there are four factors taken into account called rib thickness, rib width, adaptor inner diameter and pitch circle diameter of the frame. Certain limit for each parameter is given and table is obtained. After putting the values from the table residual plot for vertical, horizontal and axial stiffness due to force and moment is obtained. Residual plot with regression equation is obtained for each stiffness value as below.
ISSN(Online): 2319-8753 ISSN (Print) : 2347-6710
I
nternational
J
ournal of
I
nnovative
R
esearch in
S
cience,
E
ngineering and
T
echnology
(An ISO 3297: 2007 Certified Organization)
Vol. 5, Issue 6, June 2016
Figure 17 - Residual plot for Horizontal Stiffness
ISSN(Online): 2319-8753 ISSN (Print) : 2347-6710
I
nternational
J
ournal of
I
nnovative
R
esearch in
S
cience,
E
ngineering and
T
echnology
(An ISO 3297: 2007 Certified Organization)
Vol. 5, Issue 6, June 2016
Figure 19 - Residual plot for Stiffness due to Vertical Moment
ISSN(Online): 2319-8753 ISSN (Print) : 2347-6710
I
nternational
J
ournal of
I
nnovative
R
esearch in
S
cience,
E
ngineering and
T
echnology
(An ISO 3297: 2007 Certified Organization)
Vol. 5, Issue 6, June 2016
Figure 21 - Residual plot for Stiffness due to Torsional
As per the standard procedure p value greater than 0.5 is eliminated and further results are obtained. From above figures it is observed that R square value is greater than 90. Stiffness value is optimised by using Response Optimiser. Here certain limit for each parameter is given into the software. After that optimised result obtain is as shown as below figure.
ISSN(Online): 2319-8753 ISSN (Print) : 2347-6710
I
nternational
J
ournal of
I
nnovative
R
esearch in
S
cience,
E
ngineering and
T
echnology
(An ISO 3297: 2007 Certified Organization)
Vol. 5, Issue 6, June 2016
After the optimization the final empirical tool is designed in which by giving input values we directly get the final output values for the stiffness. The output obtained is 99.97% similar to the stiffness values obtained by the ansys. The results are tested and verified.
Figure 23 - Empirical Tool 6.1 Analysis of New Adaptor
ISSN(Online): 2319-8753 ISSN (Print) : 2347-6710
I
nternational
J
ournal of
I
nnovative
R
esearch in
S
cience,
E
ngineering and
T
echnology
(An ISO 3297: 2007 Certified Organization)
Vol. 5, Issue 6, June 2016
6.2 Boundary condition
Figure - 25 Boundary condition
As per shown in above figure fixed support is created at the holes by creating the surface of circular shape and force or moment is applied in another face that is flywheel side.
6.3 Deformation result:
ISSN(Online): 2319-8753 ISSN (Print) : 2347-6710
I
nternational
J
ournal of
I
nnovative
R
esearch in
S
cience,
E
ngineering and
T
echnology
(An ISO 3297: 2007 Certified Organization)
Vol. 5, Issue 6, June 2016
Figure - 27Deformation in horizontal direction due to force
ISSN(Online): 2319-8753 ISSN (Print) : 2347-6710
I
nternational
J
ournal of
I
nnovative
R
esearch in
S
cience,
E
ngineering and
T
echnology
(An ISO 3297: 2007 Certified Organization)
Vol. 5, Issue 6, June 2016
Figure - 29Deformation due to moment about vertical
ISSN(Online): 2319-8753 ISSN (Print) : 2347-6710
I
nternational
J
ournal of
I
nnovative
R
esearch in
S
cience,
E
ngineering and
T
echnology
(An ISO 3297: 2007 Certified Organization)
Vol. 5, Issue 6, June 2016
Figure - 31Deformation due to moment about axial Table - Stiffness comparison
6.4 Bending frequency for New Alternator
ISSN(Online): 2319-8753 ISSN (Print) : 2347-6710
I
nternational
J
ournal of
I
nnovative
R
esearch in
S
cience,
E
ngineering and
T
echnology
(An ISO 3297: 2007 Certified Organization)
Vol. 5, Issue 6, June 2016
Figure 33 - Bending Frequency of new adaptor
Obtained frequency is 112.87 Hz, greater than benchmark value therefore less torsional stiffness of new model compared to benchmark will not create any problem.
VII. CONCLUSION
Drive End Adaptor required for connecting the alternator and flywheel housing is modelled using creo. Stiffness in horizontal, vertical and axial direction due to force as well as moment are coming greater than benchmark value. Response surface optimization technique is used to optimise the drive end adaptor. The effect of four parameters such as rib thickness, rib width, adaptor ID and pitch circle diameter of alternator side are observed. Optimization plot and regression equation are generated. Design of new drive end adaptor is 20 percentage less than the bench mark value which saves the material cost. Hence the maximum weight is reduced and this improves the profit. Bending frequency of the designed adaptor with alternator is greater than the benchmark value. Therefore drive end adaptor against bending frequency is safe. Therefore from structural stability point of view design of drive end adaptor is safe.
REFRENCES
[1] CarmitaCamposeco-Negrete “Optimization of cutting parameters using Response Surface Methodfor minimizing energy consumption and maximizing cutting quality interning of AISI 6061 T6 aluminium” Journal of Cleaner Production 91 (2015) 109e117
[2] D. Chatterjee, B. Oraon, G. Sutradhar, P.K. Bose “Prediction of hardness for sintered HSS components using response surface method” Journal of Materials Processing Technology 190 (2007) 123–129
[3] G. Zeng, S.H. Li , Z.Q. Yu, X.M. Lai “Optimization design of roll profiles for cold roll forming based on response surface method “Materials and Design 30 (2009) 1930–1938”
[4] N. Roussouly, F.Petitjean, M.Salaun “A new adaptive response surface method for reliability analysis” Probabilistic Engineering Mechanics 32 (2013) 103–115
[5] P N L Pavani, B K Prafulla “Design, Modeling and Structural Analysis of Wave Springs” Procedia Materials Science 6 ( 2014 ) 988 – 995 [6] Rahul and Kaushik Kumar “Design and Optimization of Portable Foot Bridge” Procedia Engineering 97 ( 2014 ) 1041 – 1048
[7] Ramesh Singh “Applied Welding Engineering” Chapter 7
[8] SeidHajdarevic, Ibrahim Busuladzic“Stiffness Analysis of Wood Chair Frame” Procedia Engineering 100 ( 2015 ) 746 – 755