Copyright1998 by the Genetics Society of America
Rates of Spontaneous Mutation
John W. Drake,* Brian Charlesworth,
†Deborah Charlesworth
†and James F. Crow
‡*Laboratory of Molecular Genetics, National Institute of Environmental Health Sciences, Research Triangle Park,
North Carolina 27709-2233,†Institute of Cell, Animal and Population Biology, University of Edinburgh,
Edinburgh EH9 3JT, Scotland, United Kingdom, and‡Genetics Department, University of Wisconsin, Madison, Wisconsin 53706
ABSTRACT
Rates of spontaneous mutation per genome as measured in the laboratory are remarkably similar within broad groups of organisms but differ strikingly among groups. Mutation rates in RNA viruses, whose genomes contain ca. 104bases, are roughly 1 per genome per replication for lytic viruses and roughly 0.1 per genome per replication for retroviruses and a retrotransposon. Mutation rates in microbes with DNA-based chromosomes are close to 1/300 per genome per replication; in this group, therefore, rates per base pair vary inversely and hugely as genome sizes vary from 63 103 to 43 107bases or base pairs. Mutation rates in higher eukaryotes are roughly 0.1–100 per genome per sexual generation but are currently indistinguishable from 1/300 per cell division per effective genome (which excludes the fraction of the genome in which most mutations are neutral). It is now possible to specify some of the evolutionary forces that shape these diverse mutation rates.
R
ATES of spontaneous mutation per replication per that of a region that can be considered neutral, such as a pseudogene. Most newly arisen mutations in func-measured target vary by many orders of magnitudetional genes are deleterious, but the fraction may ap-depending on the mutational target size (from 1 to
proach zero for spacer DNAs such as introns and
in-.1010b, where b stands for base or base pair as
appro-tergenic regions. Of course, some protein evolution priate), the average mutability per b (from 1024to 10211
certainly results from favorable mutations, and to this per b per replication), and the specific mutability of a
extent the neutral fraction is overestimated. particular b (which can vary by.104-fold). A mutation
The existence of strong taxonomic patterns of muta-rate comprises all kinds of mutations in a mutational
bility implies that genomic mutation rates are close to target: base pair substitutions, base additions and
dele-an evolutionary equilibrium whose driving forces we tions (often producing frameshifting in exons), and
consider here. The evolution of those rates is likely to larger or more complex changes. Attempts to detect order
reflect their average effect over long periods, but this in these mutation rates have revealed certain underlying
effect is likely to have been insignificant for much of patterns. We describe these patterns, note some of their
the spacer DNA. consequences, and consider their evolutionary origins.
Among the mutations that affect a typical gene, differ-ent kinds produce differdiffer-ent impacts. A very few are at
THE MAGNITUDES OF MUTATION RATES least momentarily adaptive on an evolutionary scale.
Terminology:Table 1 describes the abbreviations and
Many are deleterious. Some are neutral, that is, they
parameters we will use to describe the mutation process. produce no effect strong enough to permit selection
Note that the effective genome size Geis similar to the
for or against; a mutation that is deleterious or
advanta-total genome size G in microbes, whereas Ge,G in higher
geous in a large population may be neutral in a small
eukaryotes. The most reliable estimates of mutational population, where random drift outweighs selection
co-parameters come from microbes whose genes are en-efficients. The impact of mutation is quite different in
coded by DNA (“DNA-based microbes”); as we discuss, different DNA sequences. It is maximal in a
conven-there are considerable uncertainties attached to esti-tional gene or exon, and at least transitorily less in a
mates from RNA viruses and higher eukaryotes. gene whose function is required rarely or is redundant.
Mutation rates in lytic RNA viruses:Few investigators
If adaptive mutations are rare, as seems to be the case,
of the genetics of RNA viruses have focused specifically then rates of DNA sequence evolution are driven mainly
on mutation rates, although mutant frequencies are often by mutation and random drift, asKimura(1983a) has
noted to be high compared with those observed in mi-argued. In this case, the proportion of neutral mutations
crobes with DNA chromosomes. In a recent survey at a site or locus is the ratio of its rate of evolution to
(Drake 1993a), most of the mutation rates that could
be calculated were necessarily based on results obtained with very small and thus potentially unrepresentative
Corresponding author: John W. Drake, Laboratory of Molecular
Genet-mutational targets, and contained other experimental
ics E3-01, National Institute of Environmental Health Sciences,
Re-search Triangle Park, NC 27709-2233. E-mail: [email protected] and calculational uncertainties. These uncertainties
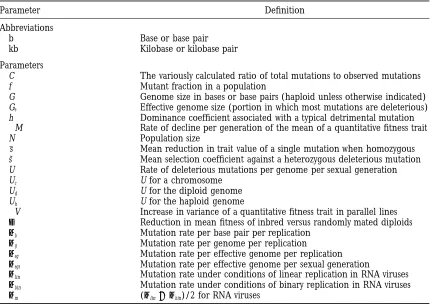
TABLE 1
Parameters used in describing the mutation process
Parameter Definition
Abbreviations
b Base or base pair
kb Kilobase or kilobase pair
Parameters
C The variously calculated ratio of total mutations to observed mutations
f Mutant fraction in a population
G Genome size in bases or base pairs (haploid unless otherwise indicated)
Ge Effective genome size (portion in which most mutations are deleterious) h Dominance coefficient associated with a typical detrimental mutation DM Rate of decline per generation of the mean of a quantitative fitness trait
N Population size
s Mean reduction in trait value of a single mutation when homozygous
s˜ Mean selection coefficient against a heterozygous deleterious mutation
U Rate of deleterious mutations per genome per sexual generation
Uc U for a chromosome
Ud U for the diploid genome
Uh U for the haploid genome
DV Increase in variance of a quantitative fitness trait in parallel lines d Reduction in mean fitness of inbred versus randomly mated diploids mb Mutation rate per base pair per replication
mg Mutation rate per genome per replication
meg Mutation rate per effective genome per replication
megs Mutation rate per effective genome per sexual generation
mlin Mutation rate under conditions of linear replication in RNA viruses
mbin Mutation rate under conditions of binary replication in RNA viruses
mm (mlin1 mbin)/2 for RNA viruses
cluded lack of information about what proportion of uncertainties were roughly similar in magnitude to the experimental uncertainties. The results from Drake
lytic virus replication is linear (repeated copying of the
(1993a) are summarized in Table 2. For the lytic RNA same template) and what is binary (as in most DNA
viruses, mg≈1 but with considerable scatter. Values of
replication), as well as lack of information about the
mg.2 are likely to be overestimates because such values
relative contributions of transcription and reverse
tran-would tend to extinguish the species. scription to retroviral mutation rates. ( J.W.D. wishes to
Because a lytic virus replicates repeatedly in each infec-correct a typographical error in his 1993a report: the
tive cycle, an infected cell yields virus carrying several minus signs do not belong in Equations 2 and 3.)
new mutations per particle. Most of these will be delete-Many (but not all) of the mutation-rate calculations
rious. The high mutation rate in these viruses may con-for these viruses were percon-formed by transcon-forming a
mu-tribute strongly to their characteristic low specific infectivi-tant frequency f into a mutation ratem, where f was
mea-ties (infectious particles per physical particle). (Another sured in large populations that had accumulated mutants
contributor to low specific activity is the inherent lability in the putative absence of selection. For linear replication,
of the RNA backbone.) Such viral populations are
ex-mlin 5 f regardless of the extent of growth. For binary
replication, mbin 5 ( f 2 f0)/ln(N/N0) where N0 is the
initial and N is the final population size. [This holds
TABLE 2 for N0 . 1/mbin; for N0 , 1/mbin, mbin 5 f/ln(Nmbin).]
Mutation rates per genome per replication Because the relative numbers of binary and linear
repli-in lytic RNA viruses cations are unknown,Drake (1993a) simply averaged
mlinandmbinto obtainmm.mlinwas at most about an order
Virus Medianmg
of magnitude greater thanmbinso thatmmwas a little less
Bacteriophage Qb 6.5
than mlin/2 and about sixfold larger than mbin (range
Poliovirus 0.8
2.2- to 9.6-fold). In addition to these uncertainties, the
Vesicular stomatitis virus 3.5 relative fidelities of binary and linear RNA replication
Influenza A $1.0
are yet to be determined, and differences of a few-fold
Values are medians fromDrake(1993a).
tremely vulnerable to increased mutation rates, even a number and order of linear and binary replication events, including the supra-binary component arising three-fold increase leading to extinction (Hollandet
al. 1990). from multiple cell cycles per passage.
Mutation rates in retro-elements: In contrast to the
In addition to the entries in Table 2, two reports have
appeared in which a mutational target of foreign origin lytic RNA viruses, a retrovirus or retrotransposon chro-mosome replicates precisely three times per infective was inserted into a lytic RNA virus that was then passaged
extensively and eventually screened for accumulated cycle. Transcription by the host RNA polymerase pro-duces an RNA genome. Reverse transcriptase then cata-mutations. In the first case (Kearneyet al. 1993), the
target resided in tobacco mosaic virus which was serially lyzes two replications to generate a DNA-based chromo-some that integrates into the host chromochromo-some (of a passed through plants ten times, each passage expanding
an inoculum of z103 infective units (iu) to z1015 iu. different cell in the case of a packaged retrovirus, or of the same cell in the case of a retrotransposon) and After the final passage, the target sequence was
reverse-transcribed and amplified by the polymerase chain reac- thereafter assumes a far lower mutation rate. The re-sulting mutant frequency is the sum of the mutation tion (PCR) from a number of isolates and then sequenced.
The mutant frequencies were 26/16158 b sequenced rates of the three steps, whose magnitudes have not yet been factored. Table 3 lists those rates described in (16.13 1024) after passage, and 8/82085 9.731024
before passage, the latter reasonably attributable to re- Drake(1993a) which were based on large mutational
targets, together with several measurements reported verse transcription (RT) and PCR errors. While this
difference is not significant, if taken at face value it since 1993, including one for a long-terminal-repeat retrotransposon. These retro-element rates are roughly yields a net f5 mlin≈6.331024per b. If the population
is considered to have expanded from 103 to 1015310iu, an order of magnitude lower than the RNA-virus rates listed in Table 2. Because of the large mutational target
mbin≈231026. Thenmm≈33 1024per b and, for G5
6395 b (Goeletet al. 1982),m
g≈2. This value is typical sizes employed, the rate differences among these viruses
may be real. (The rate does not correlate with the ret-of lytic RNA viruses. However, becausemlin/mbin. 300,
this calculation is not robust;mgcould approach 0.01 if roviral or artificial origin of the mutational target
se-quence.) Compared to the lytic viruses, the retroviral binary replications predominated. Another
confound-ing factor is the possibility of bottlenecks. A target size mutation rates may not appreciably reduce specific in-fectivity. Spleen necrosis virus is slightly more resistant of about 200 b, an inoculum of about 1000 and a
mo-mentary f of 1024 would ensure the transmission of to increased mutation rates than are lytic RNA viruses, being obliterated only after a roughly 13-fold increase about 20 pre-existing mutants at passage. However, if a
small fraction of the inoculum contributed heavily to (PathakandTemin1992).
Mutation rates in DNA-based microbes:Rates of
spon-the whole-plant yield, bottlenecks could still occur and
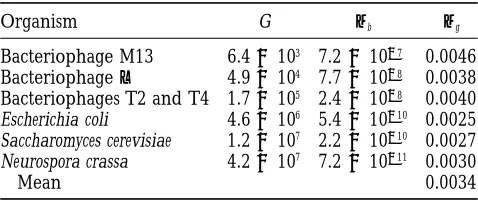
the mutation rate would be underestimated. taneous mutation in this class of organisms were last surveyed inDrake(1991) and are summarized in Table
In the second case (Schnellet al. 1996), the target
resided in vesicular stomatitis virus (VSV) which was 4 using a few updated values for genome sizes. Unlike the experimental and theoretical limits to the accuracy serially passaged through cultured cells 15 times. Each
inoculum of about 105plaque-forming units (pfu) (ap- of the RNA-virus values, the DNA-microbe values were determined in well-studied systems using robust calcula-plied to about 107cells) was expanded to about 1011pfu.
The target from six isolates was then reverse-transcribed, tions, and the individual values are likely to be accurate to within two-fold. Table 4 shows that mb and G vary
PCR-amplified, and sequenced. The mutant frequency
was 2/2400 b with no estimate of the contribution of inversely and smoothly over nearly four orders of magni-tude while mg remains constant. Given the paucity of
RT and PCR errors. Here f5 mlin≈8.331024and, with
N0 5 106 and N 5 101536,m
bin ≈4.3 3 1026; then mm ≈ general, constant values in evolutionary processes, this
particular constant is strikingly robust. 4.231024per b andm
g≈4.7, a result indistinguishable
from the values of 2.8 and 4.3 listed inDrake(1993a). Heat promotes a variety of base-loss and
base-modifi-cation reactions and can be strongly mutagenic. The However, becausemlin/mbin≈200, the calculation is again
not robust andmgcould approach 0.05 if binary replica- archeon Sulfobolus acidocaldarius growing at 758produces
pyrE and pyrF mutations at 2.8 6 0.7 and 1.5 6 0.6 tions predominated. Here, a target size of 400 b, an
inoculum of about 105 and an f of as little as 1024 per 107cell divisions, respectively (JacobsandGrogan 1997). Although genome size, mutational target size and would ensure the transmission of about 4000
pre-existing mutants at passage, thus preventing bottle- efficiency of mutation detection are not yet measured in this system, pyrE genes contain 600–720 b and pyrF necks. A more arcane possibility is that the target
se-quence, a bacterial gene encoding chloramphenicol genes contain 700–1200 b in several bacteria and eukary-otes, and G5(2–3) 3 106for related bacteria (D. W.
acetyltransferase, provided an unexpected selective
ad-vantage when functional; this could be easily measured. Grogan,personal communication). Using a typical C
value of 3.12 to correct for the efficiency of mutation In the end, however, a deeper understanding of these
TABLE 3
Mutation rates per genome per replication in retroelements
Element Target (b) mg References
Retroviruses
Spleen necrosis virus lacZa(288) 0.04a Drake(1993a)
Murine leukemia virus MLV (1380) $0.06 Drake(1993a)
tk ($1128) 0.26b Parthasarathiet al. (1995)
Rous sarcoma virus RSV (1125) 0.43 Drake(1993a)
Bovine leukemia virus lacZa(288) 0.027c ManskyandTemin(1994)
Human immunodeficiency virus type 1 lacZa(288) 0.16d ManskyandTemin(1995)
HIV-1 (9181) 0.22e
Retrotransposon
S. cerevisiae Ty1 Ty1 (173,043) 0.11f Gabrielet al. (1996)
aThe data underlying this value are in Table 1 of Pathak and Temin(1990). That table described six
mutations in the VP212-9 clone and added them to eight; in reality, there were seven mutations, which include F92 (described in their Table 2) (H. M. Temin, personal communication). The total of 37 mutations is correct. bOf 244 tk2mutants arising at f50.0882, 114 were of large extent and arose in a target of 2620 b and 130
were small and arose in a target of 1128 b. Among 49 sequenced small mutants, 28 contained non-BPS mutations and three contained nonsense mutations (B. D. Preston, personal communication). FollowingDrake(1993a),
mb(large)5(0.0882/3)(114/244)/2620 50.52427731025andmb(small)5(0.0882/3)(130/244)[28133
64/3)/49]/112852.60731025andm
b(total)53.1331025. G58372.5 (Drake1993a), so thatmb50.262. cOf 11 mutations in 18,009 288-b lacZatargets, eight were other than base pair substitutions and two were
chain-terminating base pair substitutions. Thus, followingDrake(1993a), f56.131024, C5[81(2364)/
3]/1154.6, andmb5Cf53.331026. G58500 (Sagataet al. 1985).
dOf 69 mutations in 15,424 288-b lacZatargets, 24 were non-PBS and 10 were nonsense mutations. Thus,
followingDrake(1993a), f54.531023, C5[241(10364)/3]/6953.4, andm
b5Cf51.831025. G5
9181 (Ratneret al. 1985).
eUsing a combination of direct sequencing and single-strand conformational polymorphism analysis, and
assuming an overall efficiency of mutation detection of 0.8, a total of 12 mutants were detected among 630,000 base replications (B. D. Preston, personal communication). Thus,m
b512/(630,00030.8)52.38 31025
andmg50.219.
fThe 13 base pair substitutions appear to have comprised only 10 mutational events; f5 m 510/173043
per b and G55918.
mid-range values for the above parameters,mg≈0.002. tions are likely to be extinguished when their mutation
Thus, although careful measurements remain to be per- rates are increased to a few-fold over 1. To be similarly formed in this system, the magnitude ofmgseems likely jeopardized, the microbes in Table 4 would have to
to be conserved even in a potentially hypermutagenic experience mutation-rate increases on the order of 103 -environment. fold. However, they are to some extent buffered against As noted previously, RNA-virus and retrovirus popula- immediate extinction in two ways. First, a substantial fraction of their genes are only infrequently required for growth, particularly under laboratory conditions. TABLE 4 Second, diploidy, when it occurs, will protect for a while
Mutation rates per genome per replication in microbes against the effects of recessive mutations. As described with DNA chromosomes inDrake(1991), Escherichia coli can survivemg≈10 for
at least 10 generations (although such cultures contain Organism G mb mg many dead cells), and Saccharomyces cerevisiae can survive mg≈ 60 for at least nine generations while diploid,
al-Bacteriophage M13 6.43103 7.2 31027 0.0046
Bacteriophagel 4.93104 7.7 31028 0.0038 though the haploid segregants are inviable; haploids Bacteriophages T2 and T4 1.73105 2.4 31028 0.0040
can survivemg≈2, although most cells grow poorly. Escherichia coli 4.63106 5.4 310210 0.0025
The E. coli F plasmid ordinarily replicates in step with Saccharomyces cerevisiae 1.23107 2.2 310210 0.0027
the host chromosome, uses most of the same enzymes, Neurospora crassa 4.23107 7.2 310211 0.0030
and has the samembas the host (WillettsandSkurray
Mean 0.0034
1987; Drake 1991). Kunzand Glickman(1983) and
Values are fromDrake(1991), excluding the two well de- Christensen
et al. (1985) reported that the F mutation fined outliers and updated slightly as described in the text.
rate increases during conjugation, and Taddei et al.
The updated G values are 168.8 kb for phage T4 (Kutteret
(1995) suggested that this might be an example of themg al. 1994), 4639 kb for E. coli (Blattneret al. 1997) and 12068
phage l, which displays the host mutation rate as a occurring mutator mutation. Results described next re-prophage but the appropriately higher rate when repli- veal that this is a reasonable conjecture.
cating lytically. Unfortunately, while the data of Kunz Microbial hypermutation: Microbial mutation rates can
andGlickman(1983) suggest that the spectrum changes increase over short periods for physiological or
regula-markedly during conjugation, neither F study provides tory reasons, or more permanently by the action of the mutational spectrum needed to calculatemb. Using mutator mutations. In addition, particular portions of
either the calculations of the authors or calculations the genome can be maintained inherently hypervariable based on the methods described inDrake(1991) and through specific, local mechanisms such as the cassette
noting that base pair substitutions seem to occur prefer- switching that mediates phase variation in bacterial and entially during conjugation (KunzandGlickman1983), other pathogens and mating type in yeasts and fungi
the conjugational F mutation rate appears to be roughly (Moxonet al. 1994;Sasaki1994).
five-fold to perhaps 20-fold higher than the standard Microbial mutation rates can increase physiologically rate. The E. coli genome is about 47-fold larger than in several ways. Ninio(1991) suggested that errors of
the F genome (Willetts and Skurray 1987). Thus,
transcription, translation, and molecular segregation additional measurements are needed to determine will create transient mutators which, on his estimate, whether F follows this mgrule. would contribute modestly to single mutations but
Two predictions: A plot of logmb versus log G (Drake strongly to multiple mutations per genome per
replica-1991) reveals a gap between the viral and the cellular tion. In Neurospora crassa (Auerbach1959) and phage
entries. The 578-kb genome of Mycoplasma genitalium T4 (Drake1966;DrakeandRipley1994) (and
proba-(Petersonet al. 1995) falls at the midpoint of this gap.
bly in all organisms at various times), resting genomes An interpolation from Table 4 predictsmb55.93109 mutate in a time-dependent, replication-independent
for this organism. fashion because they accumulate spontaneous DNA Mutation rates in bacteriophage T4 and herpes sim- damage that engenders mutations when DNA replica-plex virus type 1 (HSV) display an intriguing relation- tion resumes, and that may even alter transcription to ship which suggests that at least one strain of HSV may produce a mutant phenotype before replication. Starv-harbor a mutator mutation. These two viruses have
simi-ing bacteria also mutate in a time-dependent manner, lar genome sizes and modes of DNA replication. In HSV
one that probably involves immediate DNA synthesis stocks grown from small inoculum to N 5 108–109 iu,
(e.g.,Foster1997;Torkelsonet al. 1997). In addition,
the frequency of herpesvirus tk mutants is about 6.2 3
DNA damage sometimes elicits the process of transle-104 (Hall et al. 1984). The tk gene has about 1150 b
sion bypass, in which DNA primer extension passes an (McKnight1980) and G5152,260 b (McGeochet al.
unrepaired lesion. Among microbes, this process can 1988). No suitable mutational spectrum is available, so
range from fully constitutive, as in phage T4 (Drake
C must be guessed by taking the average of the values
andRipley1994), to strongly inducible, as in the E. coli
listed inDrake (1991); then C53.12,mb≈ 1.73 107
SOS response (Walker 1984). The SOS response
in-andmg≈0.026. Thismgis roughly eight-fold higher than
creases mutation rates for roughly one cell generation, the values in Table 4. Consider next the antimutator
even in undamaged parts of the genome (Walker
mutations that arise in the DNA polymerase gene of
1984). Because DNA damage is a byproduct of ordinary phage T4. These reduce the rates of only certain
path-endogenous processes such as base depurination and ways, while increasing the rates of others; overall, they
deamination, base damage from by-products of oxygen do not reducemb(Drake1993b). A strong, general
anti-and methyl metabolism anti-and so on, a few cells in any mutator is probably difficult or impossible to obtain
population are SOS-induced at any time. The fraction in one or a few mutational steps (Drake 1993b), the
of evolutionary change driven by such transient hyper-exception being by the reversal of a mutator mutation
mutability remains unknown. that itself arose by a single mutation. HSV DNA
polymer-For bacteria, chemostats or daily serial transfers consti-ase mutants selected for resistance to phosphonoacetic
tute alien environments within which rapid and com-acid (PPA) are sometimes antimutators. These reduce
plex adaptation occurs by mutation and selection. Be-the frequency of tk mutants of presumably many kinds
cause at least 10 genes can generate mutator mutations, (Hallet al. 1984), and therefore presumably do reduce
E. coli populations generate roughly 1026–1025mutator
mb; the reduction is roughly 45-fold, givingmg≈0.0006
mutants per replication. However, strong mutators are (about five-fold lower than than the values in Table
deleterious (Quin˜ onesandPiechocki1985) and do not
4). In contrast, wild-type phage T4 is resistant to PPA;
accumulate; an ordinary E. coli culture accumulates,1025 however, T4 DNA-polymerase mutator mutations are
mutator mutants (Mauet al. 1997). On the other hand,
sensitive to PPA. When selection is then applied for
mutators can be strongly selected when their frequency PPA resistance in these mutator strains, the result is
and strength are high enough so that they generate polymerase antimutator mutations that negate the
mu-more beneficial mutations than do the non-mutators in tator phenotypes (Reha-Krantzet al. 1993). These
1997); the deleterious mutators are selected indirectly 1973). Also, sexual reproduction permits the population to rid itself of deleterious mutations more efficiently along with the adaptive mutation.
In contrast to freshly grown laboratory cultures, muta- than is possible in asexual systems (Kimuraand Maru-yama1966;Kondrashov1984, 1988).
tor mutants are found at frequencies that can exceed
1022 among hospital isolates of E. coli and Salmonella In the species we discuss, the data for mutation rates in males are often more extensive and reliable than enterica (Jyssum1960;GrossandSiegel1981;LeClerc
et al. 1996), or after extensive serial passage in the labora- those for rates in females, so that our calculations fre-quently must focus on data from males. In all of these tory (Sniegowski et al. 1997). Mutator mutations are
common among commensal as well as pathogenic species, mutations with small effects tend to go un-counted. Unlike the situation with microbes, where mu-strains, and may increase mutation rates either strongly
or weakly (Maticet al. 1997). Thus, the continual adap- tational spectra predict the efficiency of detection, the
present values are all minimum estimates uncorrected tations occurring during bacterial invasions of new hosts
or culture conditions suffices to enhance the frequency for poorly detected kinds of mutations.
Zea mays: Plants have yielded remarkably few estimates of mutators by at least 1000-fold, although the
subse-quent deleterious effects of the mutator mutations may of mutation rates. In plants such as maize where genetic methods are well established, mutation rates are rela-prevent total replacement among hosts or serially
trans-ferred lines. In order to understand the roles of mutator tively easily estimated by crosses to strains homozygous for mutations causing visible phenotypes. There is wide mutations in both transitory adaptations and long-term
evolution, it will be important to determine the frequen- variation from locus to locus, with a mean of 7.731025 and a range of from,0.131025(waxy) to 49.231025 cies of mutators in natural populations in both stable
and strongly fluctuating environments. Theory describ- (R) mutations per gamete for eight maize loci (Stadler
1930). There are few comparable data from other plants ing conditions under which mutators can speed
adapta-tion in asexual microbes (Leigh 1970; Taddei et al. apart from evidence for lower rates in polyploids
(Stadler1929). Lack of further information impedes
1997) encourages such investigations.
Mutation rates in higher eukaryotes based on specific attempts to extrapolate to the entire genome.
Caenorhabditis elegans: There are about 8.2 cell
divi-loci:Plants and animals contrast with the organisms in
Tables 2–4 in several ways. One striking difference is sions ancestral to sperm and about 10.0 ancestral to eggs (KimbleandWard 1988), so we will use the average,
in the amount of DNA. G is one to several orders of
magnitude greater in plants and animals than in micro- 9.1. Mutation rates and numbers of codons have been determined for five loci. Taking the gene sizes as three bial eukaryotes. Most of the increase is not in functional
genes but rather in introns and inter-genic regions, so times the number of codons plus 100 b for regulatory and splicing sequences, using an average C 5 3.12 to that Ge,,G. A second difference is that higher
eukary-otes may display important age and sex effects. As we correct for the efficiency of mutation detection (Drake
1991) and dividing by the 9.1 cell divisions per sexual discuss below, in mammals (and especially in humans),
the rate of gene mutation per generation is much higher generation, we obtainmb(unc-22)51.17310211,mb
(unc-54)51.683 10211,m
b(unc-93)552.4310211,mb
(unc-in males and particularly older males, ma(unc-inly because
of the much larger number of germ-line cell divisions 105) 5 4.54 3 10211, and m
b(sup-10) 5 52.6 3 10211
(GreenwaldandHorvitz1980;Karnet al. 1983;Eide
ancestral to a sperm than to an egg. A third difference
is that mutation rates in animals (and plants) are often and Anderson 1985; Benian et al. 1989; Levin and Horvitz1992;Liuet al. 1996;C. WhiteandP.
Ander-equated with the mutant frequency per gamete (or,
occasionally, per diploid). Sometimes, however, mu- son,GenBank accession no. U43891); the meanmb 5
2.25310210. The total genome size G583107( Suls-tants appear in clusters that reflect the premeiotic
expansion of a single event (Muller1952;Woodruff ton andBrenner1974). There are about 1.78 3 104
genes (Bird1995); assuming an average of 103 b per
et al. 1997). Unrecognized clusters are not a problem,
because a cluster increases proportionally the probabil- gene gives Ge51.783107. Thenmg58310732.253
102105 0.018 andm
eg5 1.78 3 1073 2.25 3 102105
ity of finding the mutation. When a cluster is observed,
each mutant individual in the cluster should be counted 0.0040. These values are posted in Table 5.
Drosophila melanogaster: Schalet (1960) detected 51
as a mutation when calculating the mutation rate per
sexual generation; more complex calculations of within- visible mutations in 490,118 X chromosomes at 13 spe-cific loci, yielding a rate of 8.0 3 1026 per locus per generation mutation accumulation are difficult because
of uncertainties about the topology of normal and mu- generation. The fraction of these due to base pair substi-tutions is unknown; given the evidence that a large frac-tant cell expansion. A fourth difference is that
evolution-ary mechanisms for adjusting mutation rates may be tion of visible mutations in Drosophila are caused by insertions of transposable elements (Finnegan and
quite different in sexual eukaryotes than in rarely sexual
microbes because, at least in outbreeding sexual species, Fawcett1986), it is probable that at least half of Scha-let’smutations were of this nature.Mukaiand
Cock-the process of meiosis uncouples rate-adjusting
ac-TABLE 5
Mutation rates estimated from specific loci in higher eukaryotes
Organism G Ge mb mg meg megs
C. elegans 8.03107 1.83107 2.3310210 0.018 0.004 0.036
Drosophila 1.73108 1.63107 3.4310210 0.058 0.005 0.14 Mouse 2.73109 8.03107 1.8310210 0.49 0.014 0.9 Human 3.23109 8.03107 5.0310211 0.16 0.004 1.6
These are all likely to be underestimates, because not all kinds of mutations are included, particularly those with minor, inconspicuous effects.
cumulating isozyme mutations in 1000 chromosomes Finally, dividing by 62, the estimated number of cell divisions prior to a sperm (DrostandLee1995), gives
sheltered by heterozygosity in a balanced-lethal system
for almost 175 generations. In 1,658,308 locus-genera- mb 5 1.8 3 10210 mutations per b per cell division.
Taking G 5 2.7 3 109 b (Laird 1971) and G
e as the
tions they found three electrophoretic-mobility
(band-shift) mutations and 17 null (band-loss) mutations. How- amount of DNA required for 83104genes (Bird1995)
of length 103 bp generates the additional values listed ever, these strains exhibited a high rate of chromosome
breakage, probably because of an active transposon in Table 5.
It is surprising that germ-line mosaics were responsible (YamaguchiandMukai1974); it is therefore probably
more realistic to ignore the nulls, a procedure also justi- for almost 40% of the total rate. These appear to arise either as mutations that occur in DNA replications di-fied by the high average ratio of base pair substitutions
to other mutations in microbes (Drake1991).Mukaiand rectly before or after meiosis in the male parent (“after”
denoting the first zygotic replication) or in a single
Cockerham(1977) estimated that about 0.3 of all amino
acid changes were detectable as band shifts. In addition, strand of nonreplicating DNA (which might include mutations arising during DNA recombination or re-only about 2/3 of base pair substitutions change an
amino acid. Thus, the mutation rate per locus per gener- pair). Thus, almost as many mutations may occur in or between one or two special DNA replications as occur in ation is (3/1,658,308)/(0.3)(2/3)59.031026.
Averag-ing the two studies, we take 8.531026as a representative the other 60. This possibility presents a major challenge to both experimentalists and theoreticians (Woodruff
rate. The proteins studied by MukaiandCockerham
(1977) were encoded by an average of 973 b and some et al. 1997).
The mutation rate of evolutionary importance is of regulatory sequences must also have been present, so
dividing by 103 gives 8.5 3 1029 mutations per b per course the average over the two sexes. The estimated rates per generation in male and female mice are not generation. The number of cell divisions ancestral to a
sperm in Drosophila is about 25 for the young males very different, but the female value is based on very small numbers and is complicated by a large cluster. typically used in laboratory experiments (Lindsleyand
Tokuyasu 1980; Drost and Lee 1995; J. M. Mason, Adding the mosaic rate of 4.831026to the female rate
of 1.6 3 1026 gives a rate of 6.4 3 1026, about half personal communication), so dividing by 25 givesmb5
3.4310210. In Drosophila, G≈1.73108b (Ashburner the male rate. Alternatively, we note that the estimated
number of cell divisions prior to the gamete is 25 in 1989). We will take as Gethe amount of DNA in 1.63
104genes, each of length 103b (Bird1995); this gives females and 62 in males, so the female rate is 25/625 0.40. Averaging these, the female rate is 0.45 of the male Ge51.63107b. These and derivative values are given
in Table 5. rate. The murine malemegsis 0.55, so the average of the
two sexes is about 0.4. A similar result obtains in humans Mus musculus: The mouse data come from the controls
for the extensive radiation experiments performed at (see below).
Homo sapiens: The human data are less reliable than Oak Ridge, Harwell and Neuherberg, and summarized
by Russelland Russell (1996). A total of 1,485,036 the C. elegans, Drosophila and mouse data. A number
of dominant-mutation rates have been inferred from progeny harbored 69 visible mutations at seven loci for
a rate of 6.631026per locus per generation. In addition the frequency of affected children of normal parents, and sometimes confirmed by equilibrium estimates for to the complete mutations, about 4.831025mosaic
muta-tions were detected at five loci; these mutamuta-tions tended those dominants with severe effects. These values range from 1024to 1026, with a rough average of 1025(Vogel
to produce about 50% germ-line mosaicism, so that the
adjusted mosaic rate is (4.8 3 1025)(0.5)/5 5 4.8 3 andMotulsky1997). For genes of size 103b, this
corre-sponds to a rate of 1028 per b per generation. An esti-1026. Thus, the total mutation rate was about 1.131025
per locus per generation. Assuming 103 b per locus, mate based on specific changes in the hemoglobin mole-cule gave 0.7431028per b per generation (Vogeland
Motulsky1997), but this is clearly an underestimate tution mutations. Apert’s Syndrome has also been
stud-ied for paternal age effect and, as expected, shows a because other kinds of changes are not included. A
third, quite independent estimate is based on rates of large increase with paternal age (Crow1997). The fact
that so many of these mutations are at CpG sites offers evolution of pseudogenes in human ancestry, which are
likely to be identical to mutation rates (Kimura1983a). some support to those who argue that something
associ-ated with methylation is responsible for the high male This gives about 231028per b per generation (Crow
1993, 1995). We shall take 1028as a representative value. rate (Sapienza1994;McVeanandHurst1997).
In contrast, some mutations are not strongly associ-However, because the overwhelming majority of human
mutations occur in males (see below), the male rate ated with paternal age. Two examples are neurofibro-matosis and Duchenne muscular dystrophy. In both of must be about twice the average rate, or 231028. The
number of cell divisions prior to sperm formation in a these diseases most of the mutations are small deletions and other cytogenetic changes in enormous genes. male of age 30 is about 400 (DrostandLee1995;Vogel
andMotulsky1997). Thus,mb≈231028/4005 53 Thus, the generalization seems to be that base
substitu-tions are replication-dependent but cytogenetic changes 10211. For 8 3 107 genes (Bird 1995) of average size
103b,m
eg ≈0.004 andmegs≈1.6. are not. Various human diseases show a continuum from
very strong paternal age effect to very little (Risch et
An alternative method for estimating megs has been
proposed byKondrashovandCrow(1993) based on al. 1987), presumably reflecting the relative proportions
of base substitutions and cytogenetic changes. the idea that purely neutral sequences such as
pseu-dogenes can be used as a benchmark to identify sites Effect of hemizygosity: Deleterious mutations at sex-linked loci are strongly expressed in the hemizygous which show clear evidence of selective constraints. If
the abundance of such sites can be determined in this state in the heterogametic sex and are thus subject to stronger counter-selection than are deleterious muta-way, the effective genome size and its mutation rate
can be estimated purely from rates of DNA sequence tions in autosomal genes (except when strongly domi-nant) (Haldane1927). As a result, there is stronger
evolution. This method has yet to be applied to large
quantities of sequence data. For hemoglobin genes, selection pressure to reduce mutation rates at X-linked loci than at autosomal loci (McVeanandHurst1997).
about 15% of bases seem to be under the effective
con-trol of selection, which may be about average for genes Data on mammalian DNA sequence evolution suggest that the X chromosome may indeed experience a lower encoding proteins; for a more sophisticated treatment,
seeKimura (1983b). mutation rate than the autosomes (McVeanandHurst
1997), although this may be confounded with a higher With 6.4 3 109base pairs in the diploid genome, a
mutation rate of 1028means that a zygote has 64 new mutation rate in males than in females, especially in long-lived mammals.
mutations. It is hard to image that so many new
deleteri-ous mutations each generation is compatible with life, Mutational hot spotting: Some of the best understood human mutations arise in the gene for achondroplasia, even with an efficient mechanism for mutation removal.
Thus, the great majority of mutations in the noncoding which would seem to be a good source for a mutation rate estimate. The average mutation rate for the pheno-DNA must be neutral.
Effects of sex and age in humans: Data for female muta- type, determined directly in several studies and substan-tiated by indirect calculations, is 1025(Vogeland Motul-tion rates are less numerous and less reliable than data
for male rates. For human base pair substitutions, there sky 1997). However, molecular analysis (Shiang et al.
1994) revealed that 15 of 16 mutations were GGG → is an enormously greater mutation rate in males than
in females, along with a strong paternal age effect. Older AGG and the other was GGG→CGG at the same codon, replacing glycine with arginine. Thus, the entire ob-males have a higher rate than younger ob-males, and the
increase is greater than if mutation were simply cell served mutation rate appears to come from one codon. Similar CpG hotspots were responsible for all the muta-division-dependent (Crow1993, 1997), but the
compo-nent of replication fidelity that decreases in older men tions causing Apert’s Syndrome. Although the data are scanty, these two examples suggest that a major fraction remains unknown. Mutations also accumulate with cell
divisions in somatic tissue (Akiyama et al. 1995), al- of human gene mutations is due to mutational hot spots,
as is also typical in microbes (e.g., Benzer 1961). We
though whether the rate is proportional to number of
divisions is not known. badly need more data on per-locus mutation rates ac-companied by molecular analyses showing the mutant The enormous difference in human male and female
mutation rates is well documented for those few loci sites and the parent of origin.
Somatic versus germinal mutation rates: The (mammalian for which there are adequate data. For three conditions,
Apert’s Syndrome, multiple endocrine neoplasia type male) germ-line rate may be lower than the somatic rate. Using mice bearing a chromosomal mutation-reporter B (MEN2B), and type A (MEN2A), a total of 92 new
mutations have been reported in which, by linkage anal- target, the typical somatic-cell mutant frequency was found to be about 1.731025in a variety of tissues, but ysis, it is possible to determine the parent of origin.
1991). (This three-fold difference is probably an under- value of the fitness trait is expected to decline with time. Let the mean number of deleterious mutations that arise estimate, because the germ-cell preparations used in
these experiments were probably contaminated with so- per generation be U (Ucfor the rate for a particular
chro-mosome, Uh for the haploid genomic rate, Ud for the
matic cells.) Because the number of cell divisions
ante-cedent to these tissues was not notably lower in germ diploid genomic rate), and the mean reduction in trait value of a single mutation when homozygous (relative cells than in somatic cells, this result suggests a mutation
rate per cell division (or unit of time) at least three times to a value of 1 for wild-type) be s. (s is a weighted mean, in which the effects of mutations at individual loci are lower in germ cells than in somatic cells. In turn, this
conclusion suggests that evolutionary pressures on mu- weighted by the mutation rates at the loci.) If mutational effects are additive across loci, the rates of decline in tation rates focus primarily upon the germ line with the
soma being subject to less pressure, perhaps because of overall mean fitness (DM) and increase in variance among the lines (DV) are given by
diploidy (Orr1995).
Mutation rates for deleterious alleles from mutation- D
M5 Ucs (1a)
accumulation experiments:Measurements of mutation
rates based on specific loci offer the potential of scoring and
all mutational events in a molecularly well defined tar- D
V5Uc(s21Vs), (1b)
get. This has been achieved in several microbial systems,
but as yet only imperfectly in higher eukaryotes. A disad- where Vs is the variance among sites in the effects of
mutations (again with a weighting by the mutation vantage of the specific-locus method is that only one or
a few, possibly unrepresentative, genes may have been rates). These yield the expressions examined. An alternative approach is to accumulate
Uc$ DM2/DV (2a)
mutations with deleterious fitness effects over many
gen-erations. While this method ignores mutations without and effects on fitness, it can screen rather large fractions of
s # DV/DM. (2b) the genome. Mutations with very small fitness effects
(of the order of 1023or less) are not likely to contribute These are equalities only if all mutations have equal effects on the trait. However, given reliable estimates of to mutation-rate estimates obtained in this way, unless
they are improbably numerous; we therefore distinguish the decline in mean and increase in variance, a useful lower bound on the deleterious mutation rate per ge-these estimates conceptually from the mutation rates per
effective genome discussed above. Given that the specific- nome can be obtained from Expression 2a. The true values of the parameters may differ greatly from these locus results for higher organisms depend largely on
the detection of mutations with major phenotypic ef- bounds. For example, if the mutation effects have an exponential distribution, then the estimate of Ucis
dou-fects, the above estimates of the effective genome
muta-tion rates should in practice be quite similar to the bled and that of s is halved (CrowandSimmons1983).
Under specific assumptions concerning the shape of deleterious mutation rate estimates.
Mutation-accumulation methods: This procedure com- the distribution of mutational effects, such as a gamma distribution, maximum likelihood methods can be used binesMuller’s (1928) use of marked
crossover-suppress-ing chromosomes to detect mutations anywhere along a to estimate the parameters of the distribution and the value of Uc(Keightley1994, 1996). In principle, these
chromosome that has been sequestered for several
genera-tions, andBateman’s (1959) proposal to use the vari- methods should provide more accurate estimates of U,
s and Vsthan the simpler methods ofMukaiet al. (1972)
ance between replicates to estimate the mutation rate
and average effect. The approach was refined byMukai provided that the assumptions of the statistical model
are met. and co-workers (Mukai1964;Mukaiet al. 1972), and we
shall refer to it as the Bateman-Muller-Mukai method. There are two difficulties in applying this method of estimating U in species other than Drosophila. The first The basic idea is as follows. A set of initially genetically
identical lines is established from an isogenic base. The is the problem of preventing the operation of selection, which obviously opposes the accumulation of deleteri-lines are maintained independently and mutations are
allowed to accumulate. Because the mating system as- ous mutations. This can be fairly easily achieved by main-taining each line with minimal effective population sures that the mutation-accumulating chromosomes
re-side only in heterozygous males and a single male is used sizes, because a mutation is effectively neutral when the product of effective population size and selection as the parent in each generation, selection is minimized.
Assuming that the number of mutations per line after coefficient is less than one (Fisher1930). In clonal or
selfing organisms, propagation of each line through a some number of generations is a random variable,
dif-ferent lines will accumulate difdif-ferent numbers of muta- single individual each generation ensures that even highly deleterious mutations will behave like neutral tions. Thus, the variance among lines for a quantitative
fitness trait such as viability will increase over time. Given alleles (KeightleyandCaballero1997). Even for
TABLE 6
Mutation rates to detrimental alleles from mutation-accumulation experiments
Organism Trail studied Uh Reference
E. coli Rate of reproduction $0.0002 KibotaandLynch(1996)
C. elegans Lifetime reproductive success $0.0006 KeightleyandCaballero(1997)
A. thaliana Lifetime reproductive success $0.1 S. SchultzandJ. A. Willis, personal communication
D. melanogaster Egg-to-adult viability $0.35a Mukai(1964)
$0.42a Mukaiet al. (1972)
$0.15a Ohnishi(1977)
aThe genomic rate is estimated by assuming that chromosome 2 constitutes 40% of the genome.
leles will be efficiently eliminated by selection, because previous generation).Klekowski(1973) found rates of
about 0.01 to 0.015 per haploid genome for three fern an effective population size of two for each line is
possi-ble with full-sib mating. Such experiments therefore species, values remarkably similar to the C. elegans and Drosophila estimates.
provide estimates of the rate of mutation to most
detri-mental alleles, i.e., mutations that reduce fitness by less A more serious problem concerns the proper control for the estimation of DM, because fitness components than about 50% when homozygous.
The main difficulty with this method is that lines accu- are notoriously sensitive to environmental effects (Houle 1992). Thus, mutation-accumulation lines
mulating large numbers of mutations become
increas-ingly vulnerable to loss due to low fitness, introducing should ideally be measured at the same time as a control that has not had the opportunity to accumulate muta-a downwmuta-ard bimuta-as in bothDM andDV. In D. melanogaster,
the use of marked balancer chromosomes means that tions. An isogenic stock that initially has the same ge-netic composition as the mutation-accumulation lines mutations can accumulate on a single autosome that is
propagated through a single heterozygous male in each does not provide a suitable control, even if it is main-tained as a random-bred stock with large effective popu-line (Mukai 1964); then the effective population size
is one-half. Given the considerable recessivity of most lation size as in some experiments (Fernandez and Lopez-Fanjul1996). This is because most deleterious
strongly deleterious mutations (Crow and Simmons
1983), the risk of loss of a line is greatly reduced by this mutations have only small effects on fitness when hetero-zygous, and thus can persist in the population for many procedure; in fact, inMukai’s experiments only a very
small fraction of the singly-mated males were sterile, generations before elimination (Crow and Simmons
1983). The rate of decline in mean fitness of an initially and those cultures were replaced by sibs so that no
lines were lost (Mukaiet al. 1972). The chromosomes isogenic population as new mutations appear will at first
be nearly the same as for the accumulation lines, and accumulating mutations can be made homozygous
when desired, and their effects on fitness components will only approach zero after several tens of generations. This problem of a suitable control can be overcome assayed.
The mutation rate for recessive lethals can also be with organisms that can recover well from freezing, such as E. coli and C. elegans ; suitable methods have become estimated by the balancer chromosome technique, and
is about 0.01 per haploid genome per generation in available only recently for Drosophila (Stepkonkusand Caldwell1993).Mukaiand co-workers (Mukai1964;
D. melanogaster (CrowandSimmons1983). This seems
to be only a small fraction of the total mutation rate to Mukaiet al. 1972) andOhnishi(1977) either used no
control or used values from the lines that were pre-deleterious alleles (see Table 6). More limited
informa-tion on C. elegans suggests a slightly lower lethal muta- sumed to be mutation-free because they retained maxi-mal fitness. These procedures have led to criticism of tion rate of about 0.007 per haploid genome per
genera-tion (Rosenbluth et al. 1983; Clark et al. 1988). the values from these experiments (Keightley1996).
The magnitude of U: Estimates of minimum (Bateman-However, the upper 95% confidence interval for this
estimate overlaps the Drosophila value. In plants, direct Muller-Mukai) detrimental mutation rates from muta-tion-accumulation experiments in several species are estimates can be obtained for nuclear mutations to
chlo-rophyll deficiency (albino and yellow seedlings). These summarized in Table 6. As expected from Table 4, the lower bound for U in E. coli is extremely small, about are only a component of all lethal mutations, and so
provide an underestimate of the mutation rate to lethal 6% of the total genomic mutation rate of 0.0034. If the estimated number of cell divisions (36) in the male alleles (Klekowski1988). There is also some
informa-tion from ferns, in which newly arisen lethals affecting germ line of Drosophila is multiplied by the E. coli U of 0.0002, the resulting Drosophila Uh 5 0.007. This is
the haploid stage can be detected by testing for inviable
E. coli and Drosophila genome sizes (KibotaandLynch value. The difficulty with this result is that there is no
a priori justification for the assumed distribution of 1996). In Drosophila, however, the ratio of the effective
genome size to the total genome size (Ge:G) is much mutational effects; for example, there could be one class
of mutations with similar but fairly large effects, and smaller than in E. coli. If only the ratio of effective
ge-nome sizes is considered, a large discrepancy remains. another class with much smaller but highly variable ef-fects, as suggested by Keightley (1996). This could
In contrast to theMukaiestimates of Uhfor Drosophila
of 0.15 (Ohnishi1977) to 0.42 (Mukaiet al. 1972), Uh have substantial effects on the estimate of U. Further
research is clearly needed to resolve these uncertainties. for C. elegans was estimated to be 0.003 using the fit to
a gamma distribution of mutational effects, or 0.0006 A method that offers a partial solution to the inade-quate Drosophila controls has been devised by S. A.
using theMukaimethod (KeightleyandCaballero
1997). Because the genome sizes of C. elegans and Dro- Shabalina, L. Y. YampolskyandA. Kondrashov
(per-sonal communication). A large, randomly bred stock sophila are similar, an estimated two orders of
magni-tude difference in Uhis disturbing. On the other hand, is maintained so as to minimize the opportunity for
selection on viability and fertility. If this is the case, the the estimate for Arabidopsis thaliana (0.1) appears to be
only slightly lower than for Drosophila, but the con- mean value of a fitness component should decline at the rate given by Equation 1a, where Ucis replaced by
fidence intervals on this estimate are very wide (S.
Schultz andJ. H. Willis, personal communication). Udand the selection coefficients are for heterozygotes
rather than homozygotes. If a comparable randomly Several possible explanations can be imagined for
these discrepancies. One is that the Drosophila esti- bred stock is maintained under selective conditions that have prevailed for a long time, so that it is at mutation-mates are based on measurements of egg-to-adult
viabil-ity under competitive conditions, whereas the C. elegans selection equilibrium, its mean should remain constant except for environmental fluctuations, so thatDM can and Arabidopsis results were for net reproductive
out-put under noncompetitive conditions; differences in be estimated by adjusting for changes in the control. To avoid the possibility of adaptive change in the control fitness are likely to to be more easily detected under
harsher conditions (Kondrashov and Houle 1994). stock, the number of generations over which it is
main-tained may be minimized by keeping it at a low tempera-Another possibility is that transposable element
inser-tions played a much larger role in causing deleterious ture to reduce the number of control generations or using recently developed methods for freezing Drosoph-mutations in the Drosophila experiments than in the
C. elegans experiments, where the line involved lacked ila. Their measurements of net fitness under competi-tive conditions suggested thatDM≈0.02. ForMukaiet
transposable element activity (Keightleyand
Cabal-lero 1997). A less palatable explanation is that the al. (1972) the value was 0.004 per chromosome, which
translates into 0.02 per diploid genome. These values Drosophila values forDM are gross overestimates caused
by adaptive changes in the balancer chromosome are in good agreement, but this is perhaps due to oppos-ing errors. The data ofShabalinaet al. are for fertility.
against which the mutation-accumulation chromosomes
were competed; this would cause an artifactual decline There is evidence for a more important contribution from fertility than viability to the genetic load for total in the mean viability of the mutation-accumulation
chro-mosomes relative to the balancer (Keightley 1996). fitness (KnightandRobertson1957;Sved1975; Sim-monset al. 1978). On the other hand, they measured
However, this artifact seems unlikely because the
bal-ancer chromosomes were long-established laboratory heterozygous rather than homozygous effects. In any case, the experiments of Shabalina et al. support a
strains that were likely to be at equilibrium, and in the
longest accumulation experiments (Mukai 1969), the substantial decline in fitness under circumstances where
the control strain had been kept frozen, thus arguing viability of the balancer chromosomes would have had
to double to account for the observed results. The fact against improvement of the reference population in the
Mukaiexperiments.
that the (probably minimal) effective genomic mutation
rate in Drosophila in Table 5 is far closer to the U Indirect estimates of U :Several indirect methods have been proposed for estimating the genomic deleterious estimates in Table 6 for Drosophila than for C. elegans
further suggests that this putative artefact is improbable. mutation rate. For lethal mutations in outcrossing plants, the classical formula for the equilibrium fre-To avoid the problems of the control for the
Drosoph-ila experiments,Garcia-Dorado(1997) used a statisti- quency q of a recessive-lethal allele under
mutation-selection balance, q≈(m/s)0.5(Haldane1927), can be cal method for estimating mutational parameters which
does not require knowledge of DM, but simply fits the applied to the frequencies of nuclear gene-controlled chlorophyll-deficient variants to obtain the mutation observed distribution of mutation-accumulation line
val-ues to an assumed form of continuous distribution of ratemper haploid genome, assuming that the selection coefficient s5 1 (Crumpacker 1967; Ohnishi 1982;
mutational effects. This leads to a much smaller estimate
of U for the Mukai andOhnishi experiments (Uh ≈ Klekowski 1988). If lethal mutations are not
com-pletely recessive, as is suggested by the Drosophila data 0.025) than does the Bateman-Muller-Mukai method,
underesti-mates the mutation rate because a higher value ofmis and h is the dominance coefficient associated with a typical detrimental mutation. This method provides un-needed to compensate for the elimination of
heterozy-gous lethals by selection. derestimates of total mutation rates for reasonable val-ues of h (Charlesworthet al. 1990).
The results for total mutation rates to chlorophyll
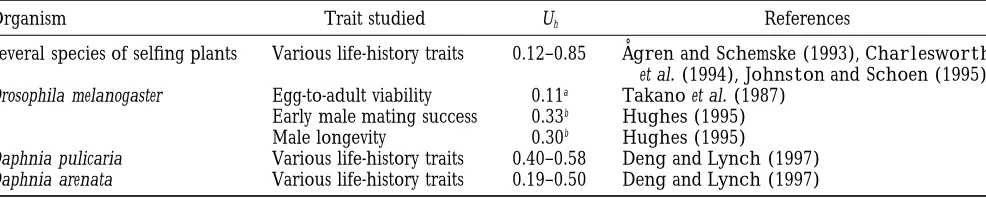
deficiency were reviewed byKlekowski(1992) for ten The range of values of Uh so obtained from data on
heterosis in net fitness for several species of highly species of annual plants from five families. He
con-cluded that rates are surprisingly constant, ranging from selfing plants from three families of angiosperms are shown in the top part of Table 7; where no estimate of (0.16–0.45) 3 1023. There is no apparent relation to
the species’ DNA content, even though this differed h is available, it was assumed to be 0.2 as suggested by the Drosophila data (CrowandSimmons1983;
Charles-more than 20-fold. The differences in Geare presumably
much less. It is difficult to extrapolate these mutation worth and Hughes 1998). Because each individual
estimate is subject to considerable sampling error, it is rates to the whole genome, because the proportion of
vital loci contributed by chlorophyll genes is presently probably wise to treat only the median value of approxi-mately 0.3 as meaningful. This estimate is ostensibly unknown.
Estimates can also be obtained for populations whose independent of the strength of selection against the deleterious mutations, and so may capture a larger frac-selfing rates are known, using the equilibrium formulae
ofOhta and Cockerham (1974). Estimates for such tion of them than the mutation-accumulation method.
On the other hand, the fact that h seems to be much populations of long-lived mangrove species are (2.1–
5.8)31023(KlekowskiandGodfrey1989;Klekowski closer to 0.5 for mutations with small effects than for
mutations with drastic effects (Crow and Simmons
et al. 1994), about 13-fold higher than those from
annu-als. This difference would be expected from an increase 1983) means that very weakly selected mutations are likely to contribute relatively little to heterosis and so in mutation rates with age caused by greater numbers
of cell divisions before meiosis in old plants; note that would not be detected by this method.
Hughes(1995) and DengandLynch(1996, 1997)
in plants, reproductive structures are formed from
vege-tative tissues, and are not derived from a germ line have suggested an extension of this approach to use the genetic variances of inbred and outbred populations (Klekowski 1988). This value needs confirmation in
other species. Assuming that mutations affecting sporo- to estimate the decrease in fitness components with inbreeding. By simultaneously estimating the degree of phyte viability also lower male gametophyte viability, an
age effect should also decrease pollen viability in old inbreeding depression, U and s can also be estimated (DengandLynch1996, 1997). Estimates of U
happlying
plants. No such effect was found in the one study of
which we are aware (ConnorandLanner1991). How- this method to published data on Drosophila fitness
components (B. Charlesworth,unpublished results)
ever, by analogy with human studies, mutations that
accumulate with age are likely to be mainly base substitu- and from data on Daphnia (Deng and Lynch 1997)
are given in the lower part of Table 7. There is again tions, which are more likely than deletions to pass through
the haploid gametophyte (Khush andRick 1967). substantial spread in the individual estimates; the
me-dian is approximately 0.34, surprisingly close to the The use of formulae based on the assumption of
muta-tion-selection equilibria has been extended to estimating plant value.
While an attractive idea, this method depends heavily detrimental mutation rates from the effect of
inbreed-ing on fitness components (Charlesworthet al. 1990; on the assumption that mutation-selection balance is
the sole force maintaining genetic variation in fitness
CharlesworthandHughes1998;DengandLynch
1996). In highly selfing species, recessive lethals will components. There are good reasons to question this assumption for outbreeding species. In Drosophila, be quickly purged from the population (Lande and
Schemske1985), and will thus contribute little to the both the genetic variance and inbreeding depression
for components of fitness seem to be too high to be different effects of inbreeding versus outbreeding on
fitness components. In addition, such populations will explained solely by mutation-selection balance, using the parameter estimates shown in Table 6 (Mukaiet al.
have few polymorphic loci with allelic variability
main-tained by overdominance (Kimura and Ohta 1971; 1974;CharlesworthandHughes1998). This implies
the existence of a substantial contribution from
varia-Charlesworthand Charlesworth1995). Thus, we
can reasonably neglect lethal and segregational loads tion which is actively maintained by selection, causing an upward bias in estimates of U by the Deng-Lynch and assume that heterosis in highly inbred populations
is due solely to detrimental mutational load. The rate for method. The presence of variation maintained by selec-tion means that U is overestimated to an extent which independently acting detrimental mutations per diploid
genome can then be estimated from the formula is difficult to gauge.
The impact of increased rates of mutation:Does the
Uh5 2ln(1 2 d)/(122h), (3)
high rate of spontaneous deleterious mutation per sex-ual generation in multicellular organisms render them wheredis the reduction in mean fitness of highly selfed