ISSN(Online) : 2319 - 8753
ISSN (Print) : 2347 - 6710
I
nternational
J
ournal of
I
nnovative
R
esearch in
S
cience,
E
ngineering and
T
echnology
(An ISO 3297: 2007 Certified Organization)
Vol. 4, Issue 3, March 2015
A Study on atmospheric turbulence with
Shearing Interferometer wavefront sensor
M.Mohamed Ismail
1, M.Mohamed Sathik
2.Research Scholar, Department of Computer Science, Sadakathullah Appa College, Tirunelveli, Tamilnadu, India 1 Principal, Sadakathullah Appa College, Tirunelveli, Tamilnadu, India. 2
ABSTRACT: When a light beam propagates through the turbulent atmosphere, the wavefront of the beam is distorted, which affect the image quality of ground based telescopes. Adaptive optics is a means for real time compensation of the wavefront distortions. In an adaptive optics system, wavefront distortions are measured by a wavefront sensor, and then using an active optical element such as a deformable mirror the instantaneous wavefront distortions are corrected. In this paper, the physical background of imaging through turbulence, using Kolmogorov statistics, and the Polarization Shearing Interferometry techniques to sense and to correct the wavefront aberrations with adaptive optics have been discussed. Simulations of the interferometric records were carried out using Matlab for the study of aberrations in an optical system and the effect of the atmospheric turbulence in the interferograms. The data was reduced from the interferogram using Fourier Transform Technique and the wavefront was reconstructed from the wavefront slope data.
KEYWORDS: Babinet Compensator, Atmospheric Turbulence, Deformable Mirror, Scintillation.
I. INTRODUCTION
As astronomers attempt to understand the limits of the physical universe, they must look deep into the night sky with a sharp eye. Unfortunately, looking into the night sky is like looking up from the bottom of a swimming pool. Earth’s atmosphere is made up of many layers having different temperature gradient, different velocity gradient and also different density gradient. The chaotic and stochastic changes in these properties of the atmosphere causes a fluid called turbulence or turbulent flow. Turbulence causes the formation of eddies of many different length scales. Most of the kinetic energy of the turbulent motion is contained in the large scale structures. The energy "cascades" from these large scale structures to smaller scale structures by an inertial and essentially in viscid mechanism. This process continues, creating smaller and smaller structures which produces a hierarchy of eddies. Eventually this process creates structures that are small enough that molecular diffusion becomes important and viscous dissipation of energy finally takes place.
Fig.1: Turbulence Illustration
The resolving power of a telescope when imaging through earth atmospheric turbulence is not proportional to telescope diameter but to the characteristic coherence length [1] of turbulence called Fried parameter ro. Typically ro is
ISSN(Online) : 2319 - 8753
ISSN (Print) : 2347 - 6710
I
nternational
J
ournal of
I
nnovative
R
esearch in
S
cience,
E
ngineering and
T
echnology
(An ISO 3297: 2007 Certified Organization)
Vol. 4, Issue 3, March 2015
fluctuations. As a result, the wavefront phase changes spatially and temporally, so the wavefront is no longer plane. A secondary effect of this phenomenon is scintillation.
In Fig.2 shows simulation of a point source images diffraction limited case and in the presence of strong turbulence. The intensity is normalized to the peak intensity of PSF in the absence of turbulence. This light spread over a larger area demonstrates high resolution and high contrast imaging difficult.
Fig.2.A: No Turbulence Fig.2. B: Strong Turbulence
There are many possible solutions in order to improve the image quality at the focal plane of the telescope. Those are space telescopes, speckle interferometry [2] and adaptive optics [3]. Depending up on the performance and cost of the technique, one can choose the best suitable method to minimize atmospheric effects.
The best option to minimize the atmosphere effects is launch a telescope into space, but it has its own limitations of launching technology for big telescopes and cost of operation. In, speckle interferometry using blind de-convolution post processing methods are used to improve the image quality. These methods require short-exposure images and are not suited for very faint objects. Alternative to above, Babcock [3] suggested a solution with one technique to correct those dynamic distorted wave-fronts called “Adaptive Optics “(AO). It basically consists of wavefront sensor, Deformable mirror and control hardware. Today this AO has benefitted from modern technology and high speed computer, which have enabled to correct distortions in real time. With this current technology and using AO the efficiency of a ground based telescope has been greatly improved. For the development of an AO system, it is essential to understand the characteristics of the atmospheric turbulence and its effect on the image quality.
II. IMAGING THROUGH ATMOSPHERIC TURBULENCE
The phase distortions that arrive at the telescope entrance are the cumulative effect of refractive index variations through a vertical path in the atmosphere. The refractive index structure function is given by equation (1.1).
2 2/3
( )
( )
n n
D r
C h r
(1.1)
The Kolmogorov model of turbulence distortions prescribes the specific form of the phase structure function [4]
5/3 0
( )
6.88(
r
)
D r
r
ISSN(Online) : 2319 - 8753
ISSN (Print) : 2347 - 6710
I
nternational
J
ournal of
I
nnovative
R
esearch in
S
cience,
E
ngineering and
T
echnology
(An ISO 3297: 2007 Certified Organization)
Vol. 4, Issue 3, March 2015
Developed from this Kolmogorov model, the Fried parameter ro is
6/5 3/5 2 3/5
0
0.185
cos( )
(
N)
r
C dh
(1.3)
Where, is the zenith angle of observation and is the observational wavelength.
Atmospheric turbulence changes temporally and spatially. For long exposure times, averaged PSF we observe with imaging object.
OTF
effective
OTF
Telescope.
OTF
Atmosphere (1.4)The atmospheric Optical Transfer Function (OTF) is related to the statistics of the atmospheric phase aberrations,
OTF( f ) exp[0.5D(
f )] (1.5)Now we put this model into long-exposure atmospheric OTF, and we get in the form:
5/3 0
( ) exp[ 3.44( f ) ]
OTFatmosphre f
r
(1.6)
From equation(1.6), one can obtain long exposure PSF of atmosphere by taking the Fourier transform of OTF. The FWHM of the atmospheric PSF called as seeing [5] , is related to fried parameter ro
Seeing = 0.98λ/ro (1.7)
At the wavelength of 0.5 micron, 1 arc second seeing corresponds to ro =10.1 cm.
And the dependency of fried parameter from equation.1.3 with wavelength is given by
6/5
0 0
( )
( /
)
r
r
(1.8)
III. GENERATIONOFKOLMOGOROV MODEL OF ATMOSPHERIC TURBULENCE
Turbulent flow is very complicated and still it is not entirely understood. Over the last hundred years, modelling the effects of turbulence on optical propagation has received much attention. The focus on statistical modelling [4] has produced several useful theories. In these theories, it is necessary to resort to statistical analysis, because it is impossible to exactly describe the refractive index for all positions in space and all time. The most widely accepted theory of turbulence flow, due to consistent agreement with observation, was first put forward by Andrei Kolmogorov [6].
Kolmogorov model assumes that energy injected into turbulent medium on large spatial scales (outer scale, Lo)
forms eddies. These large eddies cascade the energy into small scale eddies until it becomes small enough (small scale, l0) that the energy is dissipated by the viscous properties of the medium. The inertial range between inner and outer
scales Kolmogorov predicted a power law distribution of the turbulent power with spatial frequency, κ (-11/3).
ISSN(Online) : 2319 - 8753
ISSN (Print) : 2347 - 6710
I
nternational
J
ournal of
I
nnovative
R
esearch in
S
cience,
E
ngineering and
T
echnology
(An ISO 3297: 2007 Certified Organization)
Vol. 4, Issue 3, March 2015
As such, it is modelled with phase structure function D ( )r
, D ϕrdefined as the average difference between two
values of a random variable for a large number of points, with the random variable being the phase ( )x
, i.e.
2
( ) ( ) ( )
D r x r x
(2.1)
The structure function for refractive index [4, 6] variation of turbulent air in the Kolmogorov model is given by
2
( )
(
)
( )
n
D r
n x
r
n x
(2.2)
2 2/3
( )
n n
D r
C r
,
l
0
r
L
0 (2.3)Where,
2 ( )x
l x( )
phase of an optical wave,
l x
( )
is optical path length,
n x
( )
is the refractive index at particular coordinate x , Cn2 (h) is the vertical refractive index structure constant which is strongly altitude dependent.
Tatarski [7] showed the three dimensional power spectrums,
N( )
of the refractive index variations is
2 11/ 3
(
)
0.033
NN
C
(2.4)
Where, k is the scalar wave number vector, (
x, ,
y z).Kolmogorov turbulence model is valid for atmospheric turbulence. It is experimentally proved by Nightingale & Buscher (1991) [8]. In case of atmospheric turbulence it is solar energy and wind shear which provides the initial energy on large scales and it is dissipated as heat by viscous friction of the air at the inner scale [9].
The outer scale is an important parameter in turbulence statistics and its range of values are much debated in astronomical databases. The standard spectrum of Kolmogorov turbulence is usually written with infinite outer scale and the effect of infinite outer scales is to reduce the lower spatial frequency contributions. This effect is more pronounced as the telescope diameter exceeds the size of outer scale. Given that the outer scale is usually 10 m to 100m, many of the future extremely large telescopes will have larger diameter than the outer scale.
This power spectrum is only valid within the inertial range between the inner and outer scale [11] as it tends to infinity at larger spatial separations. So in order to accommodate the finite inner and outer scales, the Kolmogorov power spectrum was modified by Von Karman power spectrum which is given by.
2 2 2 11/6 2 2
0
( )
0.033
N(
)
exp(
/
i)
N
C
(2.5)
Where,
0
2 /
L
0 ,
i
5.92 /
l
0 and
2 /
L
. It can be expressed in another form with Fried parameter rISSN(Online) : 2319 - 8753
ISSN (Print) : 2347 - 6710
I
nternational
J
ournal of
I
nnovative
R
esearch in
S
cience,
E
ngineering and
T
echnology
(An ISO 3297: 2007 Certified Organization)
Vol. 4, Issue 3, March 2015
2 2
5/3
0 2 2 11/6
0
exp(
/
)
( )
0.023(
/ )
(
)
i
N
D r
(2.6)For infinite outer scale (
0
0
) and zero inner scale (
i
) above equation reduces to
5/3 11/3 0
( )
0.023(
/ )
N
D r
(2.7)
The Power spectral density (PSD) and phase screen f(r) are related as
2
( )
( )
ikrN
f r e
dr
(2.8)
From above equation phase screen is given by:
( )
N( )
ikrf r
e dk
(2.9)
Where, f(r) is 2D - Kolmogorov phase screen, can be obtained from inverse Fourier Transform of square root of Von Karman power spectrum of turbulent atmosphere . When dealing with electromagnetic propagation through the atmosphere, the refractive index can be considered independent of time over short (100μs) time scales. Because the speed of light is so fast, the time it takes light to traverse even a very large turbulent eddy is much, much shorter than the time it takes for an eddy’s properties to change. Consequently, temporal properties are built into turbulence models through the Taylor frozen turbulence hypothesis.
IV. INTERFEROGRAM SIMULATIONS
The use of Zernike polynomials for describing the aberrations introduced by the atmospheric turbulence is well known. The PSI wavefront sensor measures the wavefront slope. Noll (1976) [10] has introduced the integral representation and the derivatives of the Zernike polynomial. The derivatives of the Zernike Polynomials can be written as a linear combination of Zernike polynomial. Hence, the slope information from the wavefront sensor can be conveniently expressed as a function of the Zernike polynomial. The gradient of the Zernike polynomial is represented by
(3.1)
(3.2) where γjj is called Zernike Derivative matrix. Upon proceeding with Zernike coefficients, the interferograms are
simulated for different values of the Zernike coefficients representing different aberrations.
ISSN(Online) : 2319 - 8753
ISSN (Print) : 2347 - 6710
I
nternational
J
ournal of
I
nnovative
R
esearch in
S
cience,
E
ngineering and
T
echnology
(An ISO 3297: 2007 Certified Organization)
Vol. 4, Issue 3, March 2015
dimensional plot was fast fourier transformed to give all the positive and the negative frequencies present in the signal. To remove all the higher frequencies and unwanted signals, the power spectrum of the fast fourier transformed plot was calculated. Considering only the frequency that contains the maximum information, all the other frequencies are neglected. Now the inverse fourier transform of the above signal that contains the maximum information was found out to get back the signal in terms of the spatial co-ordinates. Then the phase was unwrapped to remove the integral multiple of the 2π uncertainties. From the unwrapped phase, the Zernike coefficients were found out using the values the γjj values for both the x- and y-variables as given by Noll. The Coefficient Matrix A was finally calculated and the
various Zernike coefficient values was recorded for the different interferometric patterns.
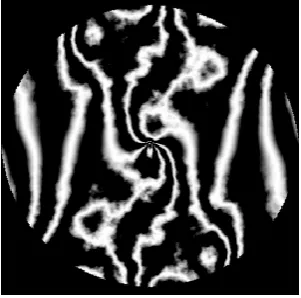
Fig. 3: Representation of straight interference fringe pattern in the absence of turbulence with D/r0 =0.
Fig. 4: Representation of interference fringe pattern with a turbulent phasescreen of D/r0 =0.2.
ISSN(Online) : 2319 - 8753
ISSN (Print) : 2347 - 6710
I
nternational
J
ournal of
I
nnovative
R
esearch in
S
cience,
E
ngineering and
T
echnology
(An ISO 3297: 2007 Certified Organization)
Vol. 4, Issue 3, March 2015
Fig. 6: Representation of interference fringe pattern with a turbulent phasescreen of D/r0 =25.
V. WAVEFRONT RECONSTRUCTION
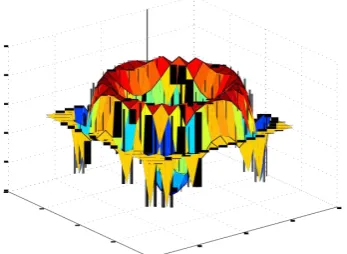
In this section the reconstruction of the wavefront has been calculated, from the slope data. After finding out the slope of the wavefront the wavefront is reconstructed using modal approach. the wavefront is calculated with modal approach using Zernike basis functions using 21 modes.
Fig. 7: Three Dimensional surface plot of the unwrapped phase with a turbulent phasescreen of D/r0=0.
ISSN(Online) : 2319 - 8753
ISSN (Print) : 2347 - 6710
I
nternational
J
ournal of
I
nnovative
R
esearch in
S
cience,
E
ngineering and
T
echnology
(An ISO 3297: 2007 Certified Organization)
Vol. 4, Issue 3, March 2015
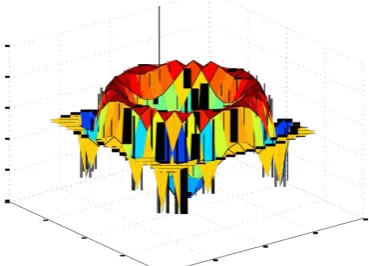
Fig. 9: Reconstructed Wavefront obtained with a turbulent phasescreen of D/r0 =0.2.
Fig. 10: Reconstructed Wavefront obtained with a turbulent phasescreen of D/r0 =2.5.
Fig. 11: Reconstructed Wavefront obtained with a turbulent phasescreen of D/r0=25.
VI. CONCLUSION
ISSN(Online) : 2319 - 8753
ISSN (Print) : 2347 - 6710
I
nternational
J
ournal of
I
nnovative
R
esearch in
S
cience,
E
ngineering and
T
echnology
(An ISO 3297: 2007 Certified Organization)
Vol. 4, Issue 3, March 2015
the Shearing interferometer performs better in the presence of low Fried parameter and for Rytov numbers greater than 0.2. The Fourier theoretical approach has been applied to the Polarization Shearing Interferometer (PSI) to establish the basis of the wavefront sensing. Theoretical simulations were carried out for visualization of various aberrations in the Interferometric fringe pattern. The study reveals that under moderate turbulent conditions where D/ro = 0.025, the sensitivity of the PSI is not altered significantly.
REFERENCES
[1] Saha, S. K. (2007). Diffraction Limited Imaging with Large and Moderate Telescopes. World Scientific. [2] Saha,S.K.(2010). Aperture Synthesis: Methods and Applications to Optical Astronomy, 2010 Springer.
[3] H.W. Babcock. The possibility of compensating astronomical seeing. Public. of the Astron. Soc. Pac., 65:229-236, 1953. [4] D. L. Fried. Statistics of a geometric representation of wavefront distortion. J. Opt. Soc. Am., 55(11):1427–1431, 1965. [5] M. Sarazin and F. Roddier. The eso differential image motion monitor. A&A, 227(1):294–300, 1990.
[6] A. N. Kolmogorov. The local structure of turbulence in incompressible viscous fluid for very large Reynolds numbers (translation). Proceedings of the Royal Society of London A, 434:9-13, 1991.
[7] V.I. Tatarski. Wave Propagation in a Turbulent Medium. McGraw-Hill, 1961.
[8] N. S. Nightingale and D. F. Buscher. Interferometric seeing measurements at the La Palma Observatory. MNRAS, 251:155–166, July 1991. [9] F. Roddier. The effects of atmospheric turbulence in optical astronomy. In Progress in Optics, volume 19, pages 281–376, 1981.
[10] R. J. Noll, Zernike polynomials and atmospheric turbulence, J. Opt. Soc. Am., 66,207 211, 1976.