Copyright1999 by the Genetics Society of America
Potential Variance Affecting Homeotic
Ultrabithorax
and
Antennapedia
Phenotypes in
Drosophila melanogaster
Greg Gibson, Matthew Wemple and Sylvie van Helden
Department of Biology, University of Michigan, Ann Arbor, Michigan 48109 Manuscript received April 4, 1998
Accepted for publication December 8, 1998
ABSTRACT
Introgression of homeotic mutations into wild-type genetic backgrounds results in a wide variety of phenotypes and implies that major effect modifiers of extreme phenotypes are not uncommon in natural populations of Drosophila. A composite interval mapping procedure was used to demonstrate that one major effect locus accounts for three-quarters of the variance for haltere to wing margin transformation in Ultrabithorax flies, yet has no obvious effect on wild-type development. Several other genetic backgrounds result in enlargement of the haltere significantly beyond the normal range of haploinsufficient phenotypes, suggesting genetic variation in cofactors that mediate homeotic protein function. Introgression of Anten-napedia produces lines with heritable phenotypes ranging from almost complete suppression to perfect antennal leg formation, as well as transformations that are restricted to either the distal or proximal portion of the appendage. It is argued that the existence of “potential” variance, which is genetic variation whose effects are not observable in wild-type individuals, is a prerequisite for the uncoupling of genetic from phenotypic divergence.
T
HE genetic component of quantitative variation is should give rise either to a significantly expanded range of variation, or to a low correlation between wild-type generally attributed to the segregation of a numberof alleles of small to moderate effect that tend to interact and mutant phenotypes across the same genetic back-grounds. The classical view by contrast predicts that the in an additive manner (Mackay1995). This standard
theory has been augmented in recent years by accep- observed range of variation simply shifts along with the new trait mean, or, if the mutation creates a novel phe-tance of the important contributions of recurrent
muta-tion and rare alleles, as well as complex nonadditive, notype, that there should be little or no genetic variation associated with it.
including epistatic, interactions among loci (Barton
andTurelli1989;Whitlocket al. 1995). In most cases, We have shown that introgression of the homeotic mutation Ultrabithorax (Ubx1) into different wild-type back-it is also thought that the observed range of variation
approximates the possible range, meaning that variation grounds supports the alternative hypothesis, namely, that there is a low genetic correlation between wild-that is of evolutionary significance is observable in
natu-ral populations. This perhaps reflects the adaptationist type and mutant phenotypes (Gibsonandvan Helden 1997). Here, we extend this analysis by examining in view that the limits of continuous traits are set by the
strength of stabilizing selection on each optimum phe- detail some of the more aberrant homeotic Ubx1 pheno-types and showing that there are alleles with potentially notype, with the result that extreme individuals are not
seen because natural selection removes the genetic vari- extreme effects that do not obviously affect wild-type haltere development. In addition, we demonstrate that ation that would tend to favor their appearance.
An alternative hypothesis is that the observed variation there is considerable “potential variance” available to modify the antenna-to-leg transformation due to the is just the tip of the iceberg, so that quantitative traits
harbor considerably more variation than that which is Antennapedia (Antp73b) homeotic mutation. It is argued that an appreciation of the existence of this source of expressed. According to the concept of canalization
(Schmalhausen 1949; Waddington 1957), develop- variation has considerable implications for understand-ing various aspects of evolutionary change.
mental genetic mechanisms ensure that morphological traits are so well buffered that the effects of alleles that tend to produce abnormal phenotypes are suppressed.
MATERIALS AND METHODS A prediction of this hypothesis is that perturbation of
a trait by the introduction of a mutation of large effect
Fly stocks: All flies were maintained at 258 (unless 188 is stated) on standard cornmeal with yeast. Wild-type lines were obtained from the Bowling Green Stock Center or from the Ann Arbor fruit markets as listed inGibsonandvan Helden
Corresponding author: Greg Gibson, Department of Genetics,
Gard-(1997). Mutant stocks were obtained from the Bloomington
ner Hall, North Carolina State University, Raleigh, NC 27695-7614.
E-mail: ggibson@unity.ncsu.edu Stock Center: Antp73b (#2259), Ubx1 (#2866), Cbx1 (#3433),
TABLE 1
Primers for PCR amplification of microsatellite markers
Marker Locus Location Sequencesa Type
1.1 Notch 3C tttgcggcttcgtttgttta GT
gatccgcccacatacacact
1.2 tenA 11A ctcttagtgcgcagggattc AT
gagtcgctcaatggcagg
2.1 pendulin 22D acgtttcgagctcatttcgg AAC
acactggtgtgaagggaatg
2.2 ninaC 28A ctcgcttccaggactttgtc AT
gcatattgatcctctcgaag
2.3 Sos 34D cgagcactgcttgagtgcag AT
gtctgtctgtctgttctacc
2.4 DHR3 46F cttttgcttcgtagagaaccg AC
tgcggtgtagagaatttcgc
2.6 Amy 54A acgggaacgccatctaac GT
agaagagaccctgcaacaca
2.7 Distal-less 60E gagcactggcaagttaggcg AC
ccttgcttctgtgattgagg
3.1 trh 61C agtacttcgctccgcattcg ACC
cctggcttgcactggatc
3.2 z600 71C aaatctgttgctcatactgccc TTC
aaccggcgaaatgttcag
3.3 E74B 74F gcatgcaaatgcgcatgtgg AC
ggcaaacaaacgtaatcgcg
3.4 Antp 84A agatccgagatgcgagatgc CT
tgtgcgtgtagattgtcaag
aSequences are written in the 59–39 direction for the forward (top) and reverse (bottom) primers used to amplifyz200-bp fragments of each locus. tenA and z600 were obtained fromGoldsteinandClark(1995), Notch and Amy fromSchlottereret al. (1997), and the remainder were designed in our lab.
Df(3L)Aprt-1/TM3 (#600) with breakpoints at 62A10-B1 and were directly labeled with 0.03 ml [32P]dATP (New England Nuclear, Boston) spiked in the reaction cocktail, separated 62D2-5, Df(3L)M21/In(3LR)T33 (#3650) with breakpoints at
62F and 63D, Df(3L)HR119/ T M6B (#3649) with breakpoints by polyacrylamide gel electrophoresis, and imaged using a Bio-Rad molecular imager. Examples of microsatellites on at 63C6 and 63F7, and Df(3L)GN19/TM3 (#416) with
break-points at 63F3 and 64B2. chromosome 2 are shown in Figure 1A to demonstrate the
consistent difference between the parental strains 27.13 and Lines 27.13 and 17.38 are derivatives of the previously
de-scribed Ubx introgression lines obtained by 10 generations of 17.38. All genotypes were scored manually by two independent observers, and reactions were repeated in rare cases (,5%) backcrossing of Ubx1into two different inbred wild-type lines
(Gibsonandvan Helden1997) that produce divergent hal- of ambiguity because of poor amplification.
Markers in Hsp83 and Dras2 were scored following PCR tere bristle phenotypes. They were further inbred to
near-isogenicity by 7 or 8 generations of pair-mating, until two amplification with the primers Hsp83AF 59-ACATACAAGGT GAGTAATGC-39and Hsp83AR 59-GGCATCTGCAATGGATT parents were found to be homozygous for each of the
micro-satellite markers listed in Table 1. Lines without the Ubx allele TAC-39 or Ras2F 59-TTAGTCATTTGCGTCATCTGC-39 and Ras2R 59-TATATGTTGGCTCCTGCTTCC-39. The line 17.38 were then bred simply by mating wild-type flies from these
lines, while the Ubx stocks were maintained by selection of allele of Hsp83 wasz100-bp lower molecular weight than the 1.14-kb allele of line 27.13, and hence heterozygotes were mutant individuals every few generations.
Antp73bintrogressions were performed as shown in Figure 2 scored by the presence of two PCR bands following 1% agarose gel electrophoresis and ethidium bromide staining. Sequence ofGibsonandvan Helden(1997), namely by backcrossing
10 virgin female Antp flies to 10 males from 1 of 20 wild-type analysis showed that several single nucleotide polymorphisms distinguish the two Dras2 alleles in the 0.84-kb amplified frag-lines, for 10 generations. Phenotypes were scored qualitatively,
by assigning numerical values to the degree of transformation ment. One of these, a synonymous T to C transition in the second exon of the line 27.13 allele at position 516 of the in the proximal and distal portions of the appendage: 0,
essen-tially antennal; 1, reduction of the arista or a few large bristles amplified product, was detected by allele-specific oligonucleo-tide (ASO) hybridization as described bySaikiet al. (1986). on antennal S3; 2, large growths on S3; 3, some tarsal formation,
or elongation of proximal leg-segments; 4, clearly leg-like fea- PCR products from individual flies were dot-blotted directly onto a nylon membrane (Hybond-N1; Amersham, Arlington tures; 5, almost perfect leg morphology.
Genotyping:Primers for amplification of microsatellites are Heights, IL) under vacuum pressure, fixed by UV-irradiation, and probed with32P-end-labeled oligonucleotide 59-ACTTGT listed in Table 1, some of which were taken from the studies
of Goldstein and Clark (1995) and Schlotterer et al. TACCCACCA-39to detect heterozygotes carrying the line 17 allele. Stringency washes were performed in 63SSC at 558. (1997). All PCR reactions were performed in 10-ml volumes
using Pfu enzyme (Stratagene, La Jolla, CA) with 40 cycles of Statistical analysis:Combined multiple regression/interval mapping was performed using QTL Cartographer software 90 sec at 948, 60 sec at 55 or 608, and 60 sec at 728, in an
Figure1.—(A) Examples of microsatellite polymorphisms detected by radioactive labeling and polyacrylamide gel electro-phoresis. Each set of four ad-jacent lanes derives from two homozygous line 17.38 (left) and two homozygous line 27.38 (right) individuals, showing that gel migration differences are reproducible. Heterozygotes in each case appear as the sum of the two parental types. Markers from left to right are 2.2, 2.3, 2.4, 2.6, and 2.7 as listed in Table 1. (B) Polytene chromosome spread of the paracentric inversion on chromosome 3 in line 17.38. The left (3L) and right (3R) arms are indicated, and join at the breakpoints 75E and 88C (“inv.”) to form a loop that clearly includes the centromere (“cent.”) with the short fourth chromosome visible. The remaining chromosomes, X and 2, are free of inversions.
from the Department of Statistics home page of North Caro- and the residual MS for the R3S3L interaction (where MS is mean square). Replicates were measured in the second and lina State University (http://statgen.ncsu.edu/).
Recombina-tion fracRecombina-tions were first calculated from the genotype data of third generations after completion of introgression. No trans-formation of the data was performed. The genetic correlation 111 backcross individuals between the F1 females and line
27.13/Ubx males using Mapmaker 3.0 (Lincolnet al. 1992) between the regions was determined as rprox,dist5 [MS(L)2 MS(R 3 L)]/[MS(L) 1 MS(R 3 L) 2 2 3 MS(residual)] also obtained over the internet from mapmaker@genome.wi.
mit.edu. Linkage map positions were in agreement with expec- followingCockerham(1963). tations based on the known location of each marker. These
fractions and the phenotypic scores for each individual were
then used to generate the plots in Figure 2 using the Zmapqtl RESULTS
option of QTL Cartographer, model 1, which uses all markers
Haltere/wing margin transformation is a quantitative to control for genetic background effects, and model 3 (which
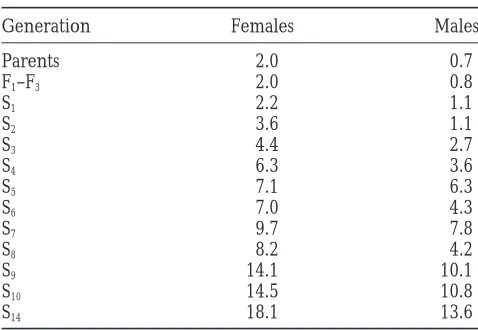
is equivalent to the original Lander and Botstein (1989) trait:In most genetic backgrounds, Ubx1heterozygotes interval mapping method) with estimates at 2-cM intervals. have just one or two prominent bristles on the anterior The raw data were plotted using CricketGraph software on a margin of each haltere. Artificial selection was applied Power Macintosh 8500 computer.
to increase this number, starting with a genetically di-Only two recombination events were detected between
verse population that was assembled from a mixture of markers 3.3 (74F), 3.4 (84A), and a Ubx (89D) marker,
indicat-ing almost complete suppression of crossindicat-ing over. Polytene 28 Ubx1 introgression lines described in Gibson and chromosome cytology demonstrated that this can be attrib- van Helden(1997). The response to selection of be-uted to the presence of a paracentric inversion in line 17.38 tween one-third and one-half of the progeny with high with breakpoints at bands 75E and 88C (Figure 1B). This
haltere bristle counts in samples of just over 100 individ-inversion also caused an increase in recombination on the
uals per generation was dramatic, as shown in Table 2. left arm, so that there was at least one crossover between
markers 3.1 and 3.3 in almost all individuals. As a consequence, Whereas the mean haltere bristle number remained,2 the QTL peak between markers 3.1 and 3.2 is artificially dupli- in the unselected population, 14 generations of positive cated (although with reversed sign of the effect) in the QTL selection resulted in a line with 17 bristles per haltere in analysis when all chromosome 3 markers are included in the
females and 14 in males. This response is.10 standard analysis. We thus excluded markers 3.3 and 3.4 from the
analy-deviation units greater than the expressed variance in sis presented in Figure 2.
the starting population. A simple test for epistasis was performed by two-way analysis
of variance of the mean phenotype associated with each of The standard deviation of haltere bristle number also the four genotypes (AABB, AaBB, AABb, or AaBb) for each increased in response to selection, up to a value of five of the 45 possible two-locus combinations. A significant
inter-bristles. This is not strong evidence for canalization, action term was taken as an indication of a nonlinear effect
because the variance scaled by the trait mean remained of one locus on the phenotypes because of the homozygote
essentially constant. Nevertheless, the genetic variation or heterozygote at the other locus.
The least-squares MANOVA routine of Statistica 4.1 (Stat- is not purely additive because for the first seven
genera-soft1996) was used to assess the statistical significance of tions of selection, the distributions of haltere bristle differences among the Antp introgressions. The analysis numbers were highly skewed, with two-thirds of the flies assumed random effects of line (L 5 1–15) and replicate
having one or two bristles per haltere and the remaining (Rep 5 1 or 2) and fixed effects of sex (Sex5 female or
third showing an increasing number of haltere bristles. male) and region (R5proximal or distal). Both sides of 10
individuals of each sex, line, and replicate were measured, The simplest interpretation is that there is an approxi-and the within-individual variance was a small component of mately normal distribution of genetic factors affecting the error term, which is mainly due to differences between the trait, but that there is a threshold that must be individuals. Error terms were as follows: MS(R3 L) for R;
overcome before any increase in haltere bristle numbers MS(S3L) for S; [MS(R3L)1MS(S3L)2MS(R3S3
is seen. L)] for L; MS(R3S3L) for the S3L and S3R pairwise
pair-TABLE 2 quantitative trait loci (QTL) affecting the haltere/wing margin transformation.
Response to selection for increasedUbxhaltere
Comparison of the distribution of haltere bristle
num-margin transformation
bers in female F2and backcross progeny indicated that high bristle counts are recessive to low counts. Backcross
Generation Females Males
of virgin female 17.38/27.13 heterozygotes to Ubx 17.38
Parents 2.0 0.7
males resulted in a mean count of 3.4 (s 5 4.1, n 5
F1–F3 2.0 0.8
130) haltere bristles in female progeny, compared with
S1 2.2 1.1
12.6 (s 55.4, n5 111) for the alternate backcross to
S2 3.6 1.1
Ubx 27.13 males. F2 individuals had an intermediate
S3 4.4 2.7
S4 6.3 3.6 mean of 5.9 (s 5 5.2, n5 132), with the distribution
S5 7.1 6.3 highly skewed toward low counts. Thus, in general one
S6 7.0 4.3 or more loci must be homozygous derivatives of line
S7 9.7 7.8 27.13 to see the strong transformation. These results are
S8 8.2 4.2
also consistent with the notion of a threshold-dependent
S9 14.1 10.1
response to Ubx haploinsufficiency. Similar results were
S10 14.5 10.8
seen for males, except that haltere bristle counts were
S14 18.1 13.6
consistently lower than for females. Mean bristle count per haltere for the 28 lines from which
Each of 10 dimorphic microsatellite markers listed in parents were taken; the average of the first three unselected
Table 1 were scored in Ubx females derived from the filial generations; and subsequent selected generations (n.
100/generation, selected fraction between 0.3 and 0.5). backcross to line 27.13, and combined multiple regres-sion/composite interval mapping (Zeng1994) was used to map QTL affecting haltere bristle number. Analysis mating starting from pairs of flies with very high bristle of just 111 individuals provided compelling evidence counts, extracted at selection generation 6. In each case, for a single major effect QTL located toward the end the proportion of wild-type flies in the progeny dropped of the left arm of chromosome 3, between cytological steadily to zero. Polytene chromosome squashes re- bands 62 and 65 (Figure 2). This locus (or cluster of vealed that the lines had fixed a chromosome bearing loci) accounts for a difference of 8.2 haltere bristles a pericentric inversion on 3R, similar to In(3R)Payne, between 17.38/27.13 heterozygotes and 27.13 homozy-with one breakpoint immediately adjacent to the bitho- gotes, or 72% of the total difference between these two rax-complex (not shown). This chromosome presum- genotypes.
ably carries a recessive lethal mutation and an enhancer There is weak evidence for a second QTL close to of Ubx that is responsible for a significant proportion the centromere of chromosome 2, although the high of the response to selection, but inability to recombine LR score may be an artifact of the small sample size the enhancer from the lethal precluded further map- as similar significance levels were seen in 5% of 100 ping of the enhancer. The inbred lines had slightly bootstrap samplings of the data set. However, this region larger bristle counts than the more outbred selection of the genome also showed a significant epistatic interac-line at generation 14, but, as the latter had almost the tion with the major QTL, as double heterozygotes for expected 1:2 ratio of wild-type:Ubx flies (data not the markers at cytological positions 46F (DHR3) and shown), the inversion chromosome cannot have been 71C (z600) had lower bristle counts than expected responsible for the majority of the response to selection. if the interactions were purely additive (P 5 0.003, A major effect enhancer of the haltere/wing margin ANOVA). No other epistatic interactions were strongly transformation: One of our initial introgression lines suggested, and there was no evidence for an X-linked that was not included in the establishment of the starting factor. A paracentric inversion in line 17.38 relative to population described above also significantly enhanced line 27.13 (Figure 1B) prevented mapping of the effects Ubx, showing a double row of up to 25 bristles along of the right arm of chromosome 3.
Figure2.—Composite interval mapping of QTL affecting haltere bristle number in Ubx flies. Microsatellite markers at the indicated cytological locations on the three major chromosomes were used to infer the positions of possible QTL affecting the number of bristles on the anterior margin of the halteres of 111 backcross progeny between the inbred lines 27.13 and 17.38. LOD scores indicate calculated likelihood ratio of difference between heterozygotes and line 27.13 homozygotes at each position along the chromosome, for standard interval mapping (LanderandBotstein1989) and combined multiple regression/interval mapping (Zeng1994). Dashed horizontal lines indicate the 5% probability cutoff for the combined model, calculated by 100 bootstrap resamplings of the data set. The single QTL on the left arm of chromosome 3 was further mapped to cytological intervals 62–65, and the approximate locations of three deficiencies in the region are indicated. Chromosome 3R was excluded from the analysis due to the absence of crossing over caused by an inversion difference between the lines.
great as that seen in line 27.13. As indicated in Table (z50% for both 3.1 and 3.2). Association with relatively high bristle counts for the Hsp83 marker (39 of 46 flies) 3, a strong effect was observed with Df(3L)Aprt-1, though
one other wild-type chromosome also showed this level was slightly higher than for Dras2 (39 of 48 flies), indicat-ing that the QTL is likely to reside distal to cytological of enhancement in trans with one copy of E(Ubx)3L.
Df(3L)M21/27.13 heterozygotes have considerably en- interval 64B and hence should be within the region covered by the deficiencies considered above. However, larged halteres, but no increase in haltere bristle
num-bers, while Df(3L)GN19 and Df(3L) HR119 heterozy- two recombinants of each phase (Hsp83 homozygotes, Dras2 heterozygotes; or Hsp83 heterozygotes, Dras2 ho-gotes do not appear to enhance Ubx at all.
Gap1 mutants also increase the Ubx haltere/wing mar- mozygotes) had high bristle counts, so did not provide any information as to the location of the QTL relative gin transformation (Boubeet al. 1997), so we considered
three components of the Ras/Raf signalling pathway in to these two genes. These data imply that E(Ubx)3L can-not be fully penetrant, and consequently linkage analy-the region as candidates for E(Ubx)3L. Dras3 (at 62B)
is within Df(3L)Aprt-1, but maps too close to the left- sis alone will not allow a determination of the precise identity of the QTL in molecular terms. The data also hand marker at 61C to be likely to be the modifier (see
Figure 2). Line 17.38 has a large (z100-bp) deletion in argue against the QTL effect being caused by two linked genes, because in this case recombinants in the region the 59region of Hsp83 (at 63B), which could
theoreti-cally affect the level of expression of the protein. Line would not be expected to show the high bristle number (greater than 13 bristles) phenotype.
27.13 has a rare haplotype in Dras2 (at 64B) consisting of
six silent polymorphisms (R. GasperiniandG. Gibson, Further evidence that Dras2 is not E(Ubx)3L comes from the finding that the same haplotype is also found in unpublished results) that can be detected by
allele-spe-cific oligonucleotide hybridization. Homozygotes for line AA18, which does not complement the enhancing effect of Ubx (Table 3). Hsp83 could be responsible for the line 27.13 alleles of these two molecular markers in a
second sample of 96 backcross females had significantly the QTL effect, but the length polymorphism is proba-bly not involved because most wild-type alleles are the higher bristle counts than heterozygotes as expected,
and more of these individuals (z85%) had higher than same length as the 27.13 allele. Alternatively, E(Ubx)3L could lie within band 62E, which is not covered by the the mean number of bristles (13) per haltere than did
TABLE 3
Effect of genetic background on theUbxhaltere margin transformation
Female Male
Crossa
Ubx3wild type Meanb s n Mean s n
17.38317.38 0.0 0.0 36 0.0 0.0 29
17.383Df(3L)GN19 0.2 0.5 27 0.0 0.1 30
17.383Df(3L)Aprt-1 2.5 1.6 14 0.6 0.6 12
17.383AA18 0.3 0.4 68 0.1 0.2 81
17.38327.13 6.0 1.0 19 1.6 1.0 37
27.13317.38 6.8 3.5 51 2.8 1.9 37
27.133Df(3L)GN19 6.5 2.6 37 2.4 1.4 26
27.133Df(3L)Aprt-1 14.5 2.5 23 8.9 1.9 18
27.133Df(3L)M21c 3.0d 1.4 9 1.5d 0.4 4
27.133Df(3L)HR119 3.4 1.4 14 1.3 0.6 10
27.133AA18 5.6 2.4 45 1.4 1.0 27
27.13327.13 18.3 3.7 43 10.4 3.5 39
27.133wwwt-1 3.5d 4.9 5 1.4d 2.4 7
27.133wwwt-3 5.5 1.1 20 4.7 1.8 20
27.133wwwt-12 3.5 0.7 11 0.8 0.7 9
27.133wwwt-17 3.6 2.1 20 0.4 0.7 22
27.133wwwt-23 13.8 3.9 34 10.5 4.3 17
27.133wwwt-24 6.9 1.1 17 2.4 1.4 16
27.133wwwt-28 7.6 2.7 12 2.2 1.7 22
27.133aawt-7 7.0 1.6 12 3.5 2.0 12
27.133aawt-14 8.6 2.5 11 1.3 1.3 23
27.133aawt-20 9.0 6.4 11 2.2 2.2 27
aIn most crosses, three Ubx virgin females were crossed to three males of the wild-type line. The cross to Df(3L)HR119 was performed 4 mo after the other crosses.
bMean and standard deviation (s) is indicated for n individuals scored (2n halteres scored). For the deficiency crosses, hemizygotes were identified by the absence of the dominant marker on the balancer chromosome.
cValues are for the minority class, because Df(3L)M21 has low viability and is maintained over an unmarked chromosome. Mean bristle counts for the majority class were 10.6 for females (n533) and 5.6 for males (n5 22).
dThese flies had significantly enlarged halteres relative to most Ubx animals.
data it may lie proximal to 64C. A more straightforward of Ubx rather than in the late determination of haltere morphology.
interpretation is that because the deficiencies in the
region do not complement the anomalous phenotype, To determine whether the modification of homeotic phenotypes is specific to a haploinsufficient allele such it is likely that the effect represents a gain rather than
loss of function. as Ubx1, or also applies to dominant, gain-of-function
phenotypes, we carried out two further introgressions. Strong modification ofUbxandAntphomeotic
pheno-types: Even stronger modification of the Ubx hemizy- Contrabithorax (Cbx1) flies have a transformation of wing toward haltere, because of gain of Ubx activity in the gous phenotype was seen in three interactions that
re-sulted in remarkably enlarged halteres reminiscent of mesothorax (Lewis1978), that was not greatly affected by crossing into a panel of wild-type genetic back-recessive viable combinations of mutations that affect
the regulatory region of Ubx [for example, bx34E/Df(3R)P9 grounds. By contrast, the homeotic transformation of antenna to leg due to Antp73bis dramatically enhanced hemizygotes;KerridgeandMorata(1982)]. The
mega-haltere phenotypes of wwwt-1/27.13,Ubx heterozygotes or suppressed in different wild-type backgrounds, and in a region-specific manner.
and of wwwt-7/wwwt-7,Ubx flies raised at 188 (Figure
3C), are accompanied by extensive bristle production Antp73bwas introgressed into 22 inbred wild-type lines by repeated backcrossing. After 10 generations, the along the anterior margin as well as flattening of the
appendage epithelium characteristic of wing tissue. The stocks were maintained by sib-mating of Antp individu-als, but 7 lines were immediately lost, presumably be-wing margin transformation is less pronounced in
Df(3L)Aprt-1/27.13 hemizygotes. The temperature-sen- cause of low viability and fertility associated with either the mutation or the inversion that causes it. Of the re-sitive period of the wwwt-7 effect, which has been
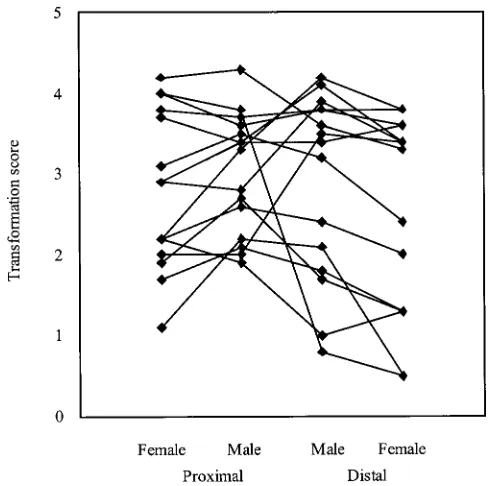
from the Wallace collection of near-isofemales from around the world. The extent of antenna-to-leg transfor-mation was scored qualitatively using two arbitrary scales from 0 (almost antenna) to 5 (almost perfect leg), for the distal portion (arista, corresponding to claw, meta-tarsus, and tarsus) and for the proximal portion (an-tennal segment 3, corresponding to tibia and femur; GateffandSchneiderman1975). Summary values for pooled scores of two successive generations are listed in Table 4 and plotted in Figure 4.
The analysis of variance in Table 5 indicates that (i) there is significant genetic variation affecting the Antp phenotype; (ii) the distal and proximal regions are to some extent independently regulated, as shown by the significant line3region effect; and (iii) there is a slight tendency for the degree of difference between the two sexes to vary by line, as shown by the significant sex3 line effect. Although the line effect is not significant in the results shown in Table 5, this is because of the high value of the line3region term used as the denominator in the F-ratio calculation: when treated separately, line
Figure3.—The mega-Ultrabithorax phenotype. A
tempera-ture-sensitive allele in line wwwt-7 produces (C) a threefold effects were extremely significant. There was also a increase in area of the halteres of Ubx flies relative to (A) the strong replicate (line3region) effect, which can mostly phenotype at 258, even when (B) crossed into the genetic be attributed to differences in the magnitude of the background of a line with minimal Ubx transformation, line
transformations in the distal and proximal regions be-wwwt-2. Images were captured digitally with NIH-Image as
tween generations, because in no case was the relative TIFF files, and rearranged using Photoshop 3 software.
effect altered. Though such a strong replicate effect is
TABLE 4
Effect of genetic background onAntptransformations
Females Males
Linea Proximalb Distalb Proximal Distal
WA3 4.0 0.5 3.8 0.8
WA6 4.2 3.3 4.3 3.6
WA9 2.2 2.0 2.6 2.4
WA10 2.2 1.3 1.9 1.0
WA11 2.0 3.4 2.0 3.5
WA12 3.1 2.4 3.5 3.2
WA15 3.7 3.6 3.4 3.4
WA16 1.1 0.5 2.2 2.1
WA17 1.9 1.3 2.7 1.7
WA19 2.9 3.4 2.8 3.9
WA22 2.2 3.8 3.3 4.2
WA26 1.7 1.3 2.1 1.8
WA29 2.9 3.4 3.4 4.1
AA14 4.0 3.8 3.6 3.8
AA21 3.8 3.6 3.7 3.8
aIntrogression lines obtained by repeated backcrossing of Figure4.—Genetic correlation of the degree of Antennape-dia transformation between regions of the antenna. The mean Antp73b for 10 generations to the corresponding wwwt line
(WA, world wide wild type/Antp) or aawt line (AA, Ann Arbor qualitative measures of the degrees of transformation in the distal (claw, metatarsi, and tarsi) and proximal (tibia and wild type/Antp).
bScores were obtained two and three generations after the femur) portion of each antennal leg are plotted by line and sex. In general, the correlation between males and females is completion of the introgression, for the distal (claw,
TABLE 5
Analysis of variance ofAntpintrogressions
Sourcea d.f. MS Error MS F P Value
L 14 116.9 55.9 2.1 0.092
S 1 57.7 7.6 7.6 0.016*
R 1 26.0 49.3 0.5 0.479*
L3S 14 7.6 1.0 7.7 0.000***
L3R 14 49.3 1.0 50.0 0.000***
Rep(L3R) 1 6.4 1.3 4.7 0.003**
S3R 1 3.5 0.9 3.6 0.080
L3S3R 14 1.0 0.8 1.7 0.052
Residualb 1140 0.5
*0.05.P.0.01; **0.01.P.0.001; ***P,0.001. aL, line; S, sex; R, region (proximal vs. distal transforma-tions); Rep(L3R) is the replicate (line3 region) for the comparison of scores obtained in the second and third genera-tions after conclusion of the introgression.
bThe residual term is the within-line and -treatment vari-ance. Within-individual variance was negligible (MS,0.1).
uncommon in quantitative genetic analysis, it is not par-ticularly surprising here because the qualitative scales used are somewhat ambiguous. More importantly, the representative phenotypes shown in Figure 5 clearly show the variability of the Antp73bphenotype, and these have persisted in the lines for a further 15 generations.
Figure5.—Diverse Antennapedia transformations in differ-ent wild-type genetic backgrounds. (A) Wild-type antenna. (B) Weak antenna-to-leg transformation in line wwwt-16. (C)
DISCUSSION Strong proximal transformation only, line wwwt-3. (D) Strong
distal transformation only, line wwwt-22. (E) Almost perfect Introgression as an alternative to mutagenesis screens:
transformation of antenna to second thoracic leg, line aawt-One of the objectives of this study was to determine 14. These diverse phenotypes are consistently seen only after whether introgression might be useful as an alternative at least five generations of introgression of the Antp73bmutation to mutagenesis screens to identify genes that act in the into the respective wild-type inbred lines.
developmental pathways regulated by Antp or Ubx. At-tempts to identify downstream targets of the homeotic
genes as suppressors of mutant phenotypes have met combinations of Ubx alleles (Kerridge and Morata 1982). That three independent combinations of genetic with limited success (KennisonandTamkun1988; cf.,
Gellon et al. 1997), possibly because the screens are backgrounds should produce this phenotype from a relatively small screen involving just 30 different intro-biased toward detecting cofactors that affect the entire
homeotic phenotype. Region-specific modifiers, namely gressions indicates that there is considerable genetic variation segregating in natural populations affecting loci that only affect the transformation of part of the
leg or haltere, are good candidates for target genes. the level of UBX activity in the haltere. The variation is likely to act early in development, during the initial The variable phenotypes produced by backcrossing of
Antp and Ubx into different wild-type genetic back- specification of the haltere imaginal disc, because the temperature-sensitive period of one of the interactions grounds are at least consistent with this type of effect,
although there also seem to be modifiers that act is during embryogenesis, and because the phenotype covers the entire appendage. It is quite different from throughout the appendages. Our identification of
dif-ferent classes of phenotypic effect is consistent with the clonal transformations such as those produced by mi-totic recombination (Struhl 1982), or ether-induced recent demonstration (Weatherbee et al. 1998) that
changes in gene expression in the imaginal haltere discs phenocopies (GibsonandHogness1996).
The transformation of the haltere margin toward of Ubx animals occur at several levels of the downstream
hierarchy. wing, resulting in the development of a pronounced
double row of bristles along the anterior margin of the The mega-haltere phenotype in particular is likely to
result from reduction in activity of cofactors that medi- haltere, is good evidence for region-specific modifiers of Ubx activity that are likely to act later in development. ate UBX function, because it closely resembles the
in this transformation, noting that Gap1; Ubx mutants hidden by dominance and epistatic interactions ( Bar-tonandTurelli1989). Empirical approaches to elu-have a relatively high number of bristles at the same
location. The sensitivity of this particular phenotype to cidating the relative importance of these sources rely on the measurement of parameters such as the mutational genetic background (bottom half of Table 3) cautions
that their result may have been due to a different poly- variance and segregating variance components (for ex-ample,Clarket al. 1995;Houleet al. 1996), all of which morphism carried in the Gap1 stock. Nevertheless, if
the identity of E(Ubx)3L and other interacting loci could assume that alleles have measurable effects on the trait. However, results such as those presented here imply be established, this phenotype would provide a powerful
assay for biologically meaningful target genes of Ubx. that there may also be extensive pools of “potential variance” that normally do not contribute at all to the Unfortunately, if E(Ubx)3L is a gain-of-function allele,
as suggested by the inability of deficiencies covering variance of a trait, but can readily have an effect if the wild-type state is perturbed (see also Hartl and most of the region (that is, excluding a portion of
cyto-logical bands 62E) to complement the mutant haltere Dykhuizen1985).
What mechanisms might maintain such potential vari-bristle phenotype, it will be particularly difficult to
iden-tify the gene responsible, especially given the incom- ance? The simplest hypothesis is that it is truly neutral: antennal legs essentially never occur in natural popula-plete penetrance of the effect. There are no known
neurogenic loci in the region, suggesting that the locus tions, so there is no selection pressure to remove alleles that might modify the Antennapedia phenotype. How-is not acting at the level of brHow-istle determination.
The region-specific modification of the Antp transfor- ever, from a developmental genetic perspective it seems likely that the variance is due to genes that have roles mation does not necessarily imply that the loci
responsi-ble are acting downstream of ANTP. It is well known that in normal appendage development, and hence that the alleles could have pleiotropic effects that are exposed competence to respond to ANTP protein is temporally
regulated (GateffandSchneiderman1975), with the to selection, however slight these may be. A strong adap-tationist might further argue that selection has favored distal tip of the appendage being sensitive to heat-shock
induced protein some 8–12 hr earlier than proximal modification of genetic architectures such that legs never partially transform to antennae, or halteres never portions (Larsen et al. 1996). Partial antennal-to-leg
transformations can also be produced by mutations in develop wing-like margins even when the dosage of the homeotic genes is reduced—a process known as canali-genes such as spineless-aristapedia and distal-less, both of
which act in parallel with the homeotic gene. Further, zation (Waddington1957). In other words, it may be that fundamental genetic pathways are so well buffered despite the region-specific character of the
transforma-tions observed in different introgressions, there was a that they can completely suppress the effects of polymor-phisms that would have a measurable influence if the strong genetic correlation (r50.63 calculated from the
variance components;Cockerham1963) between the trait is sufficiently perturbed. We have recently shown, though, that haltere development is not obviously canal-distal and proximal portions, implying that common
loci are regulating transformations in the two regions. ized (Gibsonandvan Helden1997), andWagneret al. (1997) have used mathematical theory to cast doubt Thus, at least some of the variation is likely to affect the
level of activity of ectopically expressed ANTP protein, on the efficacy of canalizing selection as a mechanism powerful enough to buffer genetic pathways to com-or possibly transcription from the rearranged promoter
that turns the gene on in the antennal imaginal disc pletely suppress phenotypic variation. Nevertheless, it does seem that activities of homeotic genes are thresh-(Frischeret al. 1986). We expect though that detailed
characterization of these and other lines will reveal more old-dependent, meaning that the effects of modifiers of homeotic gene activity are only seen above or below subtle phenotypes that are likely due to variation in
downstream effectors. For example, several of the lines defined limits.
An obvious question to ask about potential variance with strong arista-to-metatarsal transformations appear
to differ in the robustness of the metatarsi, some being is whether or not the “architecture” is similar to that of classical quantitative traits. That is, are there many genes almost leg-like, others very thin with poorly
differenti-ated joints. The major limitation to genetic dissection contributing to potential variance, and do they have largely additive effects, with each allele contributing at of these differences is the low viability and fecundity
associated with the Antp73b inversion in most genetic most a few percent of the total variance (Laiet al. 1994; Longet al. 1995;Mackay1995)? The limited evidence backgrounds.
The notion of potential variance:Natural populations presented here and in a related study of photoreceptor determination in Drosophila (Polaczyk et al. 1998) typically maintain considerably more genetic variation
for quantitative traits than classical additive genetic suggests that the situation can actually be quite differ-ent. For example, E(Ubx)3L is a major effect allele by models predict (Dobzhansky1937). Much of this
varia-tion can be attributed to some combinavaria-tion of three any criterion, contributing up to 72% of the variance for haltere bristle number in some genetic backgrounds, basic sources: balanced polymorphisms, rare alleles
back-grounds. Similarly, a few loci are capable of producing theoretical confirmation that mutation rates and effects are sufficient to support the process. Our results, if the mega-haltere phenotype that is qualitatively distinct
from the standard Ubx transformation. By contrast, the generalized to a broad range of developmental path-ways, suggest that the process need not be limited by complexity of the Antp transformations documented
here, as well as the response to selection on haltere the need for new mutations, because there are already alleles of the predicted type segregating, with hidden bristle number in Ubx flies, imply that potential variance
is not restricted to rare major effect alleles, but seems effects, in natural populations.
To see this, consider the consequence of hybridiz-to be ubiquihybridiz-tous and polygenic. Each different genetic
background gives a slightly different response to intro- ing two species, one of which has fixed an allele like E(Ubx)3L, and the other a Ubx regulatory allele that is gression of a homeotic mutation.
Implications of potential variance:What might be the suppressed by the genetic background. Many of the progeny would display strongly transformed haltere mar-evolutionary significance of potential variance? First, it
provides support for the principle that genetic pathways gins, undoubtedly with maladaptive implications. This is perhaps a far-fetched example, but if there is potential can diverge without any corresponding change at the
phenotypic level. As long as the variance has no signifi- variance to modify a change in homeotic gene function throughout the appendage, then there will also be po-cant effect on fitness, alleles with potential effects will
drift in and out of populations. There is no reason why tential variance affecting more subtle changes in Hox expression. The same argument can readily be applied an allele such as E(Ubx)3L should not be fixed in one
lineage and lost in another, assuming that it does not to changes associated with other types of regulatory gene. Summed over many loci, the divergence of genetic have any deleterious pleiotropic effect. Similarly,
differ-ent ecotypes of Arabidopsis thaliana harbor alternate al- backgrounds has the potential to contribute strongly to hybrid incompatibility or to hybrid anomalies. These leles of the CAULIFLOWER locus whose effects are seen
only in the genetic background of the floral meristem may occasionally be adaptive, providing a mechanism for the appearance of “bridgeless gaps” (de Vries1915) identity gene APETALA1 (Purugganan andSuddith
1998). A possible signature of this process is the diver- that is more palatable than simple selection acting on macromutations. Genetic drift need not be a neutral gence of redundant promoter elements such as those in
the even-skipped stripe 2 enhancer of the D. melanogaster process if the potential effects of alleles underlying mor-phological traits are considered.
group of species (Ludwig andKreitman1995). That
is to say, there is accumulating evidence that genetic We thank C. Schlotterer and D. Tautz for providing microsatellite pathways can differ quite significantly at the molecular primer information before publication, and K. Green, R. Gasperini, K. Ray, and S. Mitchell for assistance with various aspects of the work,
level (for example, in terms of the distribution of
tran-which was supported by a Basil O’Connor starter scholar research
scription factor binding sites) yet produce similar
func-award no. 5-FY96-1135 from the March of Dimes Birth Defects
Founda-tional outputs. The differences can only be seen when
tion and by a Fellowship from the David and Lucille Packard
Founda-the pathway is significantly perturbed, as by Founda-the intro- tion, both to G.G. gression of a major effect mutation.
Though this type of change may not seem very impor-tant, over the long term it could become an extremely
LITERATURE CITED powerful mechanism of evolution. It is conceivable that
Barton, N. H., andM. Turelli, 1989 Evolutionary quantitative
phenomena such as the different genetic mechanisms
genetics: how little do we know? Annu. Rev. Genet. 23: 337–370.
used to generate the nematode vulva without any alter- Basten, C. J., B. S. WeirandZ. Zeng,1997 QTL Cartographer, ation in cell lineages (Sommer 1997), the profound Version 1.12: A reference manual and tutorial for QTL mapping. Department of Statistics, North Carolina State University,
Ra-differences in pattern formation of short- and long-germ
leigh, NC.
band insects, and the astonishing dynamics of sex de- Boube, M., C. Benassayag, L. SeroudeandD. L. Cribbs,1997 Ras1-termination mechanisms among related taxa (Marin mediated modulation of Drosophila homeotic function in cell
and segment identity. Genetics 146: 619–628.
andBaker1998) evolved by a process of genetic drift of
Clark, A. G., L. WangandT. Hulleberg,1995 Spontaneous
muta-the underlying pathway. Stated more strongly, potential tion rate of modifiers of metabolism in Drosophila. Genetics 139: variance is a prerequisite for the divergence of genetic 767–779.
Cockerham, C. C.,1963 Estimation of genetic variances, pp. 53–94
mechanisms without concomitant phenotypic change.
in Statistical Genetics and Plant Breeding, edited byW. D. Hansen
Second, potential variance may more directly
contrib-andH. F. Robertson.NAS-NRD, Washington, DC.
ute to hybrid incompatibility. According to the “comple- de Vries, H., 1915 Mutations in Heredity. Rice University Press,
Houston.
mentary alleles” model (Dobzhansky1937;Orr1995)
Dobzhansky, T.,1937 Genetics and the Origin of Species. Columbia
hybrid breakdown occurs when alleles at two different
University Press, New York.
loci are fixed in two lineages derived from a homoge- Frischer, L. E., F. S. HagenandR. L. Garber,1986 An inversion
that disrupts the Antennapedia gene causes abnormal structure
neous population, where the double heterozygote is
and localization of RNAs. Cell 47: 1017–1023.
subviable as a result of an epistatic interaction. General
Gateff, E. A.,andH. A. Schneiderman,1975 Developmental
capac-acceptance of this model awaits direct demonstration ities of immature eye-antennal imaginal discs of Drosophila
melano-gaster. Wilhelm Roux Arch. EntwMech. Org. 176: 171–189.
Gellon, G., K. W. Harding, N. McGinnis, M. M. MartinandW. Mackay, T. F. C.,1995 The genetic basis of quantitative variation: numbers of sensory bristles of Drosophila melanogaster as a model
McGinnis,1997 A genetic screen for modifiers of Deformed
homeotic function identifies novel genes required for head devel- system. Trends Genet. 11: 464–470.
Marin, I.,andB. S. Baker,1998 The evolutionary dynamics of sex opment. Development 124: 3321–3331.
Gibson, G.,andD. S. Hogness,1996 Effect of polymorphism in the determination. Science 281: 1990–1994.
Orr, H. A.,1995 The population genetics of speciation: the evolu-Drosophila regulatory gene Ultrabithorax on homeotic stability.
Science 271: 200–203. tion of hybrid incompatibilities. Genetics 139: 1805–1813.
Polaczyk, P. J., R. GasperiniandG. Gibson,1998 Naturally
oc-Gibson, G.,andS. van Helden,1997 Is function of the Drosophila
homeotic gene Ultrabithorax canalized? Genetics 147: 1155–1168. curring genetic variation affects Drosophila photoreceptor deter-mination. Dev. Genes Evol. 207: 462–470.
Goldstein, D. B.,andA. G. Clark,1995 Microsatellite variation
in North American populations of Drosophila melanogaster. Nucleic Purugganan, M. D.,andJ. I. Suddith,1998 Molecular population genetics of the Arabidopsis CAULIFLOWER regulatory gene: non-Acids Res. 23: 3882–3886.
Hartl, D. L.,andD. E. Dykhuizen,1985 Potential for selection neutral evolution and naturally occurring variation in floral ho-meotic function. Proc. Natl. Acad. Sci. USA 95: 8130–8134. among nearly neutral allozymes of 6-phosphogluconate
dehydro-genase in Escherichia coli. Proc. Natl. Acad. Sci. USA 78: 6344–6348. Saiki, R. K., T. L. Bugawan, G. T. Horn, K. B. MullisandH. A. Erlich,1986 Analysis of enzymatically amplifiedb-globin and
Houle, D., B. MorikawaandM. Lynch,1996 Comparing
muta-tional variabilities. Genetics 143: 1467–1483. HLA-DQaDNA with allele specific oligonucleotide probes. Na-ture 324: 163–166.
Kennison, J. A.,andJ. W. Tamkun,1988 Dosage-dependent
modifi-ers of polycomb and Antennapedia mutations in Drosophila. Proc. Schlotterer, C., C. VoglandD. Tautz,1997 Polymorphism and locus-specific effects on polymorphism at microsatellite loci in Natl. Acad. Sci. USA 85: 8136–8140.
Kerridge, S.,andG. Morata,1982 Developmental effects of some natural Drosophila melanogaster populations. Genetics 146: 309–320.
Schmalhausen, I. I.,1949 Factors of Evolution. The Theory of Stabilizing
newly induced Ultrabithorax alleles of Drosophila. J. Embryol. Exp.
Morphol. 68: 211–234. Selection. Reprinted 1986 by University of Chicago Press, Chicago.
Sommer, R. J.,1997 Evolutionary changes of developmental
mecha-Lai, C., R. F. Lyman, A. D. Long, C. H. LangleyandT. F. C. Mackay,
1994 Naturally occurring variation in bristle number and DNA nisms in the absence of cell lineage alterations during vulva forma-tion in the Diplogastridae (Nematoda). Development 124: 243–251. polymorphisms at the scabrous locus of Drosophila melanogaster.
Science 266: 1697–1702. Statsoft, Inc.,1996 Statistica for the Macintosh, Version 4.1. Tulsa,
OK.
Lander, E. S.,andD. Botstein,1989 Mapping mendelian factors
underlying quantitative traits using RFLP linkage maps. Genetics Struhl, G.,1982 Genes controlling segmental specification in the Drosophila thorax. Proc. Natl. Acad. Sci. USA 79: 7380–7384.
121:185–199.
Larsen, E., T. LeeandN. Glickman,1996 Antenna to leg transfor- Waddington, C. H.,1957 The Strategy of the Genes. Allen & Unwin,
London. mation: dynamics of developmental competence. Dev. Genet. 19:
333–339. Wagner, G. P., G. Booth and H. Bagheri-Chaichian, 1997 A population genetic theory of canalization. Evolution 51: 329–347.
Lewis, E. B.,1978 A gene complex controlling segmentation in
Drosophila. Nature 276: 565–570. Weatherbee, S. D., G. Halder, J. Kim, A. HudsonandS. Carroll, Lincoln, S. E., M. J. DalyandE. S. Lander,1992 Mapmaker Version 1998 Ultrabithorax regulates genes at several levels of the
wing-3.0: A Reference Manual. Department of Biology, Whitehead Insti- patterning hierarchy to shape the development of the Drosophila tute for Biomedical Reasearch, M.I.T., Boston. haltere. Genes Dev. 12: 1474–1482.
Long, A. D., S. L. Mullaney, L. A. Reid, J. D. Fry, C. H. Langley Whitlock, M. C., P. C. Phillips, F. B. G. MooreandS. J. Tonsor,
et al., 1995 High resolution mapping of genetic factors affecting 1995 Multiple fitness peaks and epistasis. Annu. Rev. Ecol. Syst. abdominal bristle number in Drosophila melanogaster. Genetics 26:601–629.
139:1273–1291. Zeng, Z-B.,1994 Precision mapping of quantitative trait loci.
Genet-Ludwig, M. Z.,andM. Kreitman,1995 Evolutionary dynamics of ics 136: 1457–1468. the enhancer region of even-skipped in Drosophila. Mol. Biol. Evol.