Spontaneous Mutation Rate of Modifiers
of
Metabolism
in
Drosophila
Andrew G.
Clark,
Lei Wang and
Thomas
Hulleberg
Department of Biology, Pennsylvania State University, University Park, Pennsylvania 16802
Manuscript received June 1, 1993 Accepted for publication November 2, 1994
ABSTRACT
A rigorous test of our understanding of evolutionary quantitative genetics would be to predict accu- rately the equilibrium distribution of a character from empirical estimates of the relevant parameters in a mutation-selectiondrift balance model. An aspect of this problem that is amenable to experimental analysis is the distribution of the effects of new mutations. This study quantifies the divergence among 200 lines of Drosophila rnelunogaster as they accumulated mutations on the second chromosome and estimates the rate of increase of variation and covariation in metabolic characters. Amounts of stored triacylglycerol and glycogen and the activities of a series of 12 metabolic enzymes were assayed in a subset of lines at generations 0, 1 1 , 22, 33 and 44. Analyses of the rate of increase in the among-line variance in each trait allowed estimation of V,/V,, the ratio of among-line variance added per generation to the environmental variance. Values of
p m / t
for the second chromosome ranged from 0.0004 to 0.0289 per generation. Six of the 16 characters showed significant departure from a normal distribution, and several lines exhibited large changes in more than one character. The covariance of pairs of traits also was partitioned into a within-line component (environmental covariance, Cov,) and an among-line component (mutational covariance, Cov,) . Both variances and covariance among lines increased over time, as assessed by linear regression, whereas environmental covariance showed no such trend. Results indicate that the quantitative genetic parameters describing the variation in metabolic traits are similar I to those of other continuous characters.B
EGINNING with the papers of KIMURA (1965), LATTER (1970), BULMER (1972) and LANDE ( 1975), extensive literature has accumulated on the theory of the evolution of a quantitative character in the face of mutation and selection. Initially the empha- sis was on a single quantitative character determined by many loci with small additive effects. Most of the theory has focused on stabilizing selection (BARTON1986; BARTON and TURELLI 1987; TURELLI 1988; NAGY-
LAKI 1989)
,
where an important issue is the validity of assumptions that must be made to derive a Gaussian equilibrium distribution of allelic effects. A split arose between models that had a continuum of alleles having small mutational effects (also called “infinitesimal” models) and models that allowed mutations of large effect (also called the “rare alleles” or “house-of- cards” model).
The parameters of these models in- clude the mutation rate, the magnitude of mutational effects and the strength of selection. TURELLI (1984, 1986) pointed out that the continuum-of-alleles models require excessively high per-locus mutation rates to pro- duce observed genetic variances with reasonable choices of other parameters. Theoreticians have called for more and better empirical estimates of relevant pa-C@n?spondilzg author: Andrew Clark, Department of Biology, 208
Mueller Lab, Pennsylvania State University, University Park, PA 16802.
E-mail: [email protected]
Genetics 139: 767-779 (Fehrudly, 1995)
rameters, including the number of loci involved in quantitative traits, the rate of polygenic mutation and the magnitude of mutational effects.
Two classes of experiments have been done to esti- mate rates of polygenic mutation: quantification of di- vergence among initially identical lines and artificial selection on an inbred line (reviewed by LYNCH 1988)
.
Consider a population where pt and o:,~ are the muta- tion rate and mutational variance (the variance in ef- fects of new mutations) for the ith locus. When effects are assumed to be additive and there is no epistasis, these can be collapsed to one parameter, V, = 2ZpiaL,i. LYNCH (1988) calculated the ratio ofvariance of mutational effects to the environmental variance(QJt)
to scale the results among disparate experi- ments, and, in studies of Daphnia, Drosophila and crop plants, this ratio averaged-lo-’.
In three recent stud- ies of polygenic mutation rates for loci affecting stern- opleural and abdominal bristles in Drosophila melanogas- tu, estimates ofp m / t
ranged from 0.5 to 3.4 X768 A. G. Clark. L. Wang and T. Hulleberg
mate of
vm/c
(which they call “mutational heritabil- ity”) of 0.006-0.016, or nearly 10 times that of Dro- sophila bristles. Experiments of this sort consistently reveal a surprisingly large effect of new mutations. Even more surprising, experiments that estimate CpL sepa- rate from the magnitude of mutational effects consis- tently yield X p i 2lo-‘
(TURELLI 1984), and in thecase of fitness, the mutation rate is nearly one ( HOULE et al. 1992). This raises a paradox in explaining how the per-character mutation rate could be so high, when the per-locus mutation rates are on the order of
lop6.
The discrepancy between per-locus and per-character mutation rates suggests that thousands of genes are mu- table in ways that influence each character. This “muta- tion paradox” persists even when mechanisms other than mutation-selection balance are considered in mod- els that maintain additive variation. Stabilizing selection acting on a character that exhibits genotype by environ- ment interactions in varying environments can result in induced overdominance on the underlying loci ( GIL LESPIE and TURELLI 1989). Another possibility is that many loci do affect each character, but each mutation in turn affects many traits. The argument for this wide- spread pleiotropy is compelling ( LANDE 1980; TURELLI
1985; BURGER 1986,1989; BARTON 1990), and the mod- els demonstrate how pleiotropy can result in apparent stabilizing selection, which reduces polygenic variation compared to single-character models. Widespread pleiotropic effects of mutations are plausible, but the amount of genetic variation maintained in mutation- selection balance depends heavily on the details of the genetic basis for the pleiotropy (BARTON and TURELLI 1989).
Enzyme activities are characters with some desirable properties for studies of evolutionary quantitative ge- netics, including the fact that we have some understand- ing of regulation at a molecular level and some knowl- edge of how they might relate to one another in metabolic pathways. Three published studies have ex- amined the increase in variance in enzyme activities among mutation-accumulation lines of
D.
melanogaster. These studies were performed on MUKAI’S mutation- accumulation lines, measuring the increase in among- line variance in enzyme activity. In the first such study,MUKAI et al. (1984) quantified the rate of mutation of polygenes affecting alcohol dehydrogenase activity. For this trait the estimate of
v,,,/
Qe was 0.0006, which is 15 times the value ofpm/
for genes influencing viability( M u m 1964). AQUADRO et al. (1990) repeated the analysis of
47
lines that had accumulated mutations for 300 generations and found that the lines had already accumulated as much variation in activity as is found within either major electromorph in natural popula- tions. The variation was found to be unassociated with transposable element variation in the neighborhood ofthe Adh structural gene. TACHIDA et al. (1989) found significant variation in Amylase activity among Mukai’s mutation-accumulation lines, but their analysis of re- striction site variation around Amy revealed a clear case of double recombination with the balancer chromo- some. When the recombinant line was removed from the analysis, no significant increase in variance was de- tected.
The theoretical work on pleiotropy has raised the challenge to quantify experimentally the magnitude of pleiotropic effects of new mutations. Pleiotropic effects of mutations have been acknowledged in reports of mutation-accumulation experiments ( MACKAY et al. 1992; HOULE et al. 1994), and there is need for parame- terization of models that incorporate pleiotropy in pre- dicting equilibrium variances and covariances. In addi- tion, by examining simple metabolic traits such as enzyme activities, it is hoped that the molecular basis for pleiotropic effects will be experimentally accessible. The motivating questions behind this study include the following: at what rate do mutations influencing en- zyme activity inflate the variance among lines, do the among-line variances and covariances increase linearly over time (as predicted by the infinitesimal model), how does the distribution of mutational effects compare with the normal distribution and what is the correlation structure of novel mutations?
MATERIALS AND METHODS
Drosophila stocks: The basic design of this experiment,
which was done in collaboration with Drs. BRIAN CHARLES WORTH, DEBRA HOFFMASTER and DAVID HOULE, was to allow
mutations to accumulate in a series of 200 lines of D. melano-
gaster that were all derived from a single original line. Follow- ing the design of MUKAI ( 1 9 6 4 ) , mutations accumulated on the second chromosome by being maintained in a heterozy- gous state over the S M l marked balancer chromosome. Every 11 generations, test crosses were done to produce progeny that were homozygous for the wild second chromosomes.
CHARLESWORTH’S laboratory quantified several components
of age-specific fitness in these lines, including total fitness
( HOULE et al. 1992, 1994).
The initial line of wild flies came from the Ives population, which had been started with 400 iso-female lines in 1975 and had been maintained in 10 half-pint bottles with mixing and transferring every 14 days. As described in detail by HOULE
et al. ( 1994), 50 second chromosomes were extracted from
the Ives population using a balancer stock that was SMl, Cy/
bwU; spaPo‘/ spaP“. SMl is a multiply inverted balancer second chromosome marked by the dominant Curly (Cy) wing muta- tion. bwU has a dominant eye color phenotype, and spaPof is a fourth chromosome eye mutation used to identify stock
contamination. The balancer stock had been intercrossed to
the Ives population so as to have a common background of
chromosome Z and ZZI variation. The extracted lines were
tested for viability and reproductive fitness, and line 55, one of the best performers, was chosen for the remainder of the
experiment.
Ives-derived lines is that both bear the R and weak P cytotypes ( HOULE et al. 1994) , so high rates of transposition associated with hybrid dysgenesis is avoided ( ENCELS 1986)
.
However, if they do move, these transposable elements can generate significant levels of quantitative genetic variance by transposi- tional mutation ( MACKAY 1984, 1985), and rates of transposi- tion in such lines have been estimated at -3 X per generation ( ECCLESTON et al. 1988).
Whereas this rate is per- haps three orders of magnitude greater than the spontaneous per-locus mutation rate, the rate of mutation of polygenes affecting viability is yet another two orders of magnitude higher ( MUKAI 1964; M U M et al. 1972) . It will not be possible to determine the relative rates of mutation induced by P- element transposition and other spontaneous mutations, but the rates of transposition should in fact be similar to that in natural populations of D. melanogasto-, which are generally of the P cytotype.After the
+
/+
; spap"/ spap" founder line was chosen, a single male was crossed to three virgin females of SMl/ bwD; ~ p a ~ ~ ' / s p a * ' to generate 200 lines that were all initially+ /
SMl; spaP0'/spa*'. These 200 lines were maintained by re- peated backcrossing of single males of
+
/ SMl; spaPo'/ spaP" to virgin females that were SMI / bwD; spaP"'/ spapo'. Any muta- tions that occur on the+
chromosome, are transmitted to the next generation and, with the exception of strong dominant effects, selection is virtually eliminated. Single males were used to avoid the possibility of selection acting through differ- ential mating success. By crossing to virgin females from a common balancer stock, the design assures that the genetic background of the 200 lines remains uniformly variable on chromosomes Zand IZZ. Recall that the balancer stock is segre- gating in chromosomes Z and ZZZ for variation in common with the Ives population. The repeated backcrossing to this balancer stock, which was maintained at a large population size, should retain the variation in the genetic background. If the balancer stock loses variation by genetic drift, then that loss will be propagated to all the mutation-accumulation lines as well, and not be manifested as among-line divergence. Mu- tations can accumulate on the SMl balancer chromosome of the balancer line, but natural selection can act to eliminate some of these mutations. Effects of mutations on the balancer also will be common to all lines, and hence will not inflate the variance among lines. Lines that acquired lethal mutations were eliminated from the experiment. A control population initiated with the single founder line was maintained in paral- lel with the mutation-accumulation lines, but at one point during the experiment, the control population was passed through a bottleneck ( HOULE et al. 1994) during which time mutations could have become fixed. In this study, sufficient numbers of the initial line were tested that the analysis could be done on the basis of divergence among lines without refer- ence to the potentially corrupted control line,Preparation of homogenates: At generations 0, 11, 22, 33,
and 44, a sample of mutation-accumulation lines was sent from the CHARLESWORTH lab at the University of Chicago to Penn State. In our laboratory, three or four newly emerged pairs of flies were transferred to fresh medium and reared through one complete generation. Flies from each line were reared in at least three vials on each of 2 days. Upon emer- gence, two replicate groups of five males were collected from each vial and transferred to fresh, yeasted medium for 6 days of aging. Homogenates of 6day-old males were prepared as described in CLARK and KEITH (1989). Each sample was weighed to the nearest 1 pg and placed in a coded microcen- trifuge tube. The entire process of homogenizing, centrifuga- tion and pipetting was performed in a 4" room. Each homoge-
nate was distributed into the same position in 96well microtiter plates (15 plates). Homogenates were stored in microtiter plates at -70" until the day of assay. The number of lines tested at each generation was: generation 0 ( 1 line), generation 11 (30 lines), generation 22 (77 lines), genera- tion 33 (41 lines) and generation 44 (52 lines). The basic sampling design was ( 5 generations ) X (Nlines) X ( 2 days) X (3-5 vials) X ( 2 replicates), but the sampling was not perfectly balanced.
Assays of enzyme activities: For each sample of flies, live weight and 15 biochemical quantities were measured. A mi- crotiter plate reader was used for the enzyme kinetic assays, and details of the procedures appeared in CLARK and KEITH
(1989) and CLARK and WANC (1994). Each microtiter plate had homogenate samples as well as standards and controls. The 15 identical plates were used to assay triacylglycerol (TRI ), glycogen (GLY), total protein (PRO) and the activi- ties of fatty acid synthase (FAS) , glucose-Gphosphate dehy- drogenase (G6PD) , a-glycerophosphate dehydrogenase
(GPDH) , glycogen phosphorylase (GP) , glycogen synthase (GS) , hexokinase ( H E X ) , malic enzyme, ( M E ) , &phospho- gluconate dehydrogenase (6PGD) , phosphoglucose iso- merase (PGI) , phosphoglucomutase (PGM) , trehalase (TRE) and alcohol dehydrogenase (ADH)
.
Mutations accu- mulated on the second chromosome. Traits whose structural gene map to the second chromosome were ADH, HEX-C, PGI and TRE, whereas GGPD, 6PGD and HEX-A are on theX , and GPDH, ME and PGM are on the third chromosome ( t h e remaining enzyme loci are unmapped). The units of
TRI and GLY are micrograms per fly, and the units of the enzyme activities are nanomolar NADP ( o r NAD) reduced per fly per minute. The microtiter plate reader ( V M A X , Mo- lecular Devices Inc.) was programmed to record 6-12 optical densities of each well at prescribed time intervals depending on the assay. Each such run was recorded in a separate data file. Altogether the project involved 319,680 optical density readings from 555 microtiter plates (37 sets of 15 plates) .
Univariate statistical analysis: For each generation, the data were organized into the linear model as follows: Day and Line main effects, Day crossed with Line and Vial nested within Line and Day. The first null hypothesis of genetic inter- est is the equivalence of the line means for each character at each generation. This was tested by nested analysis of variance
(ANOVA) of each of the 16 characters and by nested analysis
of covariance (ANCOVA) , using live weight and total protein as covariates. The two linear models used were
/J
+
Dt + Ll f (D*L)y+
VI,
+ ezlkl andY ~ A L
= P+ Dt
+
+ fD *L)y+
V l k +Pw
( wyhl -a )
+
pp
( p r y k l - + €ljkIwhere p is the grand mean, D, is the effect of the ith day, L,
770 A. G. Clark, L. Wang and T. Hulleberg
and protein content among lines may have on the other vari- ables. In applying the latter model, we are assuming implicitly that variation in weight and protein is the cause of variation in enzyme activities. Mutations that affect weight will directly affect other characters. It is also possible that mutations whose direct effect is on lipid storage also may affect weight, so
removing the covariance with weight from the lipid effect may not be appropriate. Both models were used because these linear models cannot reveal which character is causal.
To test whether mutational effects have a Gaussian distribu- tion, the normality of line means was tested with the Shapiro- Wilk statistic (the UNIVARIATE procedure of SAS) , and nor- mal probability plots gave a visual verification of these tests. The linear models were fitted with the routine GLM in the statistical package SAS (SAS Institute, 1990) . Hypothesis test- ing of this model (which has crossed and nested terms) re- quired calculation of adjusted denominator mean squares ( GROSSMAN and GALL 1968). In addition to testing whether lines were homogeneous, the nested ANOVA indicated other levels in the experiment at which significant heterogeneity was introduced. The procedure VARCOMP in the SAS pack- age was used to partition the total variance in each character into components of Line, Day, Vial and error. The error term is actually the variance between samples taken from the same vial. Further details concerning the application of linear mod- els appears in RESULTS.
Estimation of mutational variance: From the distributions
of line means at generations 0, 11, 22, 33, 44 the among-line component of variance was estimated for all 16 characters. Linear regression then was applied to determine the per- generation rate of increase of variance among lines. The within-line component of variance provided a estimates of environmental variance. Environmental variance was not ex- pected to increase over generations, and regression was used to test this hypothesis. Estimates of V J V , then were made by dividing the rate of increase of among-line variance (V,) by pooled estimates of environmental variance.
To determine standard errors of
$‘,,Joe
and to conduct hypothesis tests using the estimates, a bootstrapping proce- dure was devised. Bootstrap samples (1000) of the data were drawn with replacement in such a way that the same number of lines, days and vials were drawn, retaining the imbalance of the c?mp!ete data (as in SPITZE et al. 1991; HOULE et al.1994). V J V , estimates were calculated as described above, and tail probabilities and standard errors were extracted from these bootstrap distributions.
Mutational covariance: As mutations accumulate, pairs of traits may exhibit covariance among line means due to pleio- tropic effects of mutations. Just as variance was partitioned into among-line and within-line components, covariance was partitioned into an among-line component, which is a muta- tional covariance, and a within-line component, which is envi- ronmental. As mutations accumulate, the among-line covari- ance, like the variance, should increase linearly. This was tested by regression (of among-line covariance on genera- tion) and the slope provided an estimate of the per-genera- tion rate of increase of covariance (or mutational covariance, Cov,) . Environmental covariance is again not expected in increase with time, and regression was used to test this hypoth- esis. If environmental covariance is homogeneous across gen- erations, then a pooled estimate (Cov,) can be made, as can an estimate of mutational covariance scaled by the environ- mental covariance (Cov,/Cov,) . From the estimates of muta- tional covariance and variance for each trait, mutational cor- relation was estimated. Mutational correlation was estimated, and regression was used to test whether the mutational corre-
lation increased over generations. It is expected that the among-line variances and covariances should accumulate at the same rate as the lines diverge, so correlations should be stable. If tests indicate that correlations are stable, then it is appropriate to make a single estimate, pooling over genera- tions.
The same bootstrapping procedure as described above was used to obtain confidence intervals on each element in the correlation matrix. From each bootstrap sample, mutational correlation was calculated as the among-line covariance di- vided by the square root of the product of among-line vari- ances. Bootstrap distributions gave tail probabilities for the one-tailed test of correlations being different from 0. To de- termine experiment-wide estimates of significance, the se- quential Bonferroni method was applied ( RI C E 1989). Cave- ats to this approach are explored in RESULTS.
RESULTS
Univariate analysis: Inspection of the descriptive sta- tistics for the characters at generations 0 , l l , 22, 33,
a n d 44 revealed some clear trends (Table 1 )
.
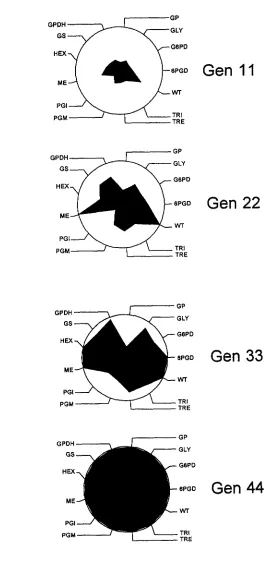
Mean activities and storage quantities appeared to increase in some characters and decrease or remain unchanged in others, but the variances exhibit consistent increases.The distributions of activities at each generation show
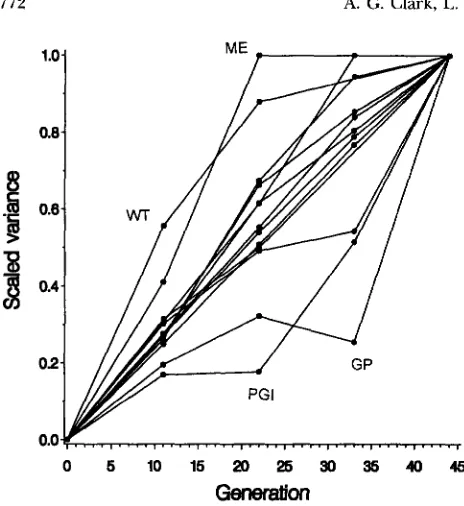
a clear spreading in variance as time proceeded. The consistency of the increase in variance among lines was assessed graphically in Figure 1. The center of the figure represents the among-line variance at the beginning of the experiment, and, because all lines derived from a single line, the among-line variance at generation 0 is set to 0. T h e figures are scaled such that the circle represents the among-line variance observed at genera- tion 44. If all traits accumulate variance linearly in time (the expectation under the infinitesimal model) , the figures would show circles of increasing size. In general, however, the figures show a monotonic increase in vari- ance, although there appears to be some departure
from linearity. Linearity is more easily assessed in Figure
2, a n d is tested statistically by regression below. Variance was partitioned into components with the SAS procedure VARCOMP using the two linear models detailed above. The component of among-line variance is reported as a percentage of the nonerror variance at each generation for each model in Table
2.
Error variances were stable over the course of generations, but varied across traits, so reporting among-line vari- ance as a proportion of nonerror variance allows easier comparison across traits. T h e among-line variance ex- hibits a clear increasing trend for most traits, consistent with the idea that accumulated mutations make the line means diverge.Mutation Accumulation in Drosophila 771 El
-5
!
'30
0 E Pg
E
y1 02
d
E
:
P 0E
B . 0
8
n n & e4 n r( d 0- &g
[: 30
!a
8
m m m w8
1
I
1 1 2 2
$ 13
Y ? c q ? ! q 9 0 i 9 V - ! % Z % % 5 5 % % S Z Se
r - o r - o m - m - m -w r - . - * m m , m q m o ,
z
-
+I-
$ 1-
+I-
tl-
$ 10 m m - d m l . t . m m
g
f " r - - l . - r - - w -
z
G q G q g g 8 g s g
kl
- 0 - o i o ~ 0 - 0
g
" + 3 " " H 3
2
s t l z ; ! q q z ;
2 E G % S % i ? Z $ %
3
? q ! q q c ? W q m ? + . ?3: m f ; m ~ m o m o c o o
3
m o m o N o m o m og
szq!'9qgs;3g
8
m o m o N o m o m oe
$ g g % % g $ q $ $
s
tl $ 1 tl tl +I2
- + - c y - * - - + - * -- l m 9 d - l o L O o Y m
u r - m r - m o m - m o m
o m m - o m - ~ w m m
9 c q 9 c q r l O q O ? Y ?
+ +I
-
tl-
$ 1-
$ 1-
tlZ g g g F 2 % 2 2 Z
p ? c u W q m W c ? Q . c ? q q m
tl tl ti tl t I + m w o @ J * m m m *
tl tl $ 1 tl ti
$ 1 +I tl m m + d m m * m m -
?qm?c?%c?'?qmcqY
+I $ 1 $ 1 tl t I
m * w m w m o l . o w - m * w o - - m c o -
h m m m w + r - m m m m
0 LC ti LC tl LC t I LC $ 1 Lcr tl m - + d m m m m m w m
m * m l . m m - m m m 9 ' 4 9 ' 4 - " 4 T W " ' :
+ I tl tl tl tI o m - w - + m m m m m
m o m o m o m o c o o
o o * m d m m * I - o
*
r - m m m m N 0 - 0 0 9 c ? 9 c ? 9 c ? - l c ? T Y$ 1 tl tl $ 1 tl m m o w m m m * m o
- ! 9 9 9 ' ? - ! 9 " T c ?
m m m m m m - m m -
2
E
~ - ~ m ~ N m m m m
;~~~?~~~~~
tl $ 1 tl-
tl-
ti w w m w - - m w o m m w m - m w w w m mt I LC $ 1 LC $ 1 LC tl LC t I
0 ':mcq??9vqmqq
ti
*
tl -+ tl*
tl*
tlo m * m m w m o m m
o m m m m w w d c o m
3
$ l m m m m d * * m c oN m m * d * m m t . * - t . c o m m w w o t . w
5
< ; $ $ : $
z 8 z 8 z 8 z 8 Z 8
$ 1 $ 1 +I tl $ 1
Z 2 2 % 2 2 K
C l - X R G :
m r - * m
e
0
.e
Y
E o 3 m c o v
5
19
u - m m *
$ 4
32
.a
2
E,
2 &
&'
e 9
- E m
8 2
;$
e E
z -
3 2 w u= 2
u h.-
z
u o
2
.E
6 2
.c
ab o
2
a; 0-
$99
a2
z e
oil:%
0 -m y
-0 -0
€ 5
G B + .
& $ " a
d a m
2
G . 2% a - c
4 z +
.-
Y E
;sE
'2
c-g
5
3.s
:5
m -0:E
5
2 . 5 u
2 5 3
2 2 5
e
x
a x
cd.5 rA
$ 2
ir 0 %
O L
%
- a
ZEO
->;
+ E
x%:ea
a
.s
y
2 E . 3
h; 2-Y
s e & . y E
'
0 3 k O h 3
ea
v)M a
- u u
2
2
12
n
z.2
;
%
g
$.$
2 :.
:g
+ E
g.
*
.Y2
tl
=
Id s z
$ W u
+ - + c
* w GPDH GS HEX ME PGI PGM GP GLY G6PD
~ P G D
Gen
22
wr TRI TRE GPDH GS GP GLY G6PD HEX
BPGD
Gen
33
ME
WT
PGI
PGM TRI
TRE GP GLY G6PD GPDH GS HEX
~ P G D
Gen
44
MEwr
PGI
PGM TRI
TRE
772 A. G. Clark, L. Wang and T. Hulleberg
1.OJ
0.8-
g
0.6-B
1
0.4-02F
0.0 r
0 5 1 0 1 6 2 0 2 5 9 0 9 5 4 0 4 5
Generation
FIGURE 2.-Total variance in each trait plotted against gen- eration of mutation accumulation. Variances are taken from Table 1 and are scaled to the generation 44 value.
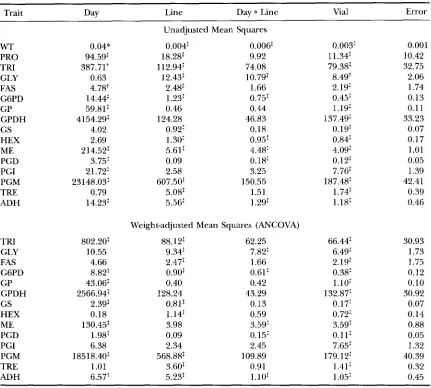
rearing conditions influence these quantitative traits. Many of the traits also showed a significant Day effect, which may include both the effects of rearing and day- to-day variation in homogenate preparation and kinetic assays. Significant Day and Vial effects were included in the denominator mean squares in testing significance of Line and Day X Line interactions. All of the traits except GP, GPDH, PGD and PGI showed highly signifi-
cant differences among lines at generation 44. Despite the observation that Weights were significantly hetero- geneous at generation 44, the ANCOVA results were very similar to the ANOVA results. One exception was
ME, which was found to exhibit significant heterogene- ity in the raw data, but not in the weight-adjusted data (Table 3 )
.
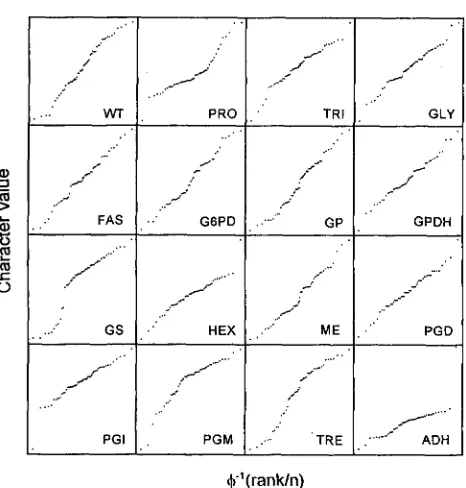
Normal probability plots provide a quick check for departure from normality of the deviations among line means (Figure 3 )
.
Some models of evolutionary quanti- tative genetics assume that mutational effects are nor- mally distributed, and their cumulative effects also are expected to be normally distributed. There were clear outlying lines in the traits HEX, PGI and ADH. The high activity outlier in HEX and ADH was the same mutation-accumulation line, suggesting a major pleio- tropic effect. The Shapiro-Wilk statistic indicated a de- parture from normality in the characters PRO, GS, HEX, PGI, PGM and ADH (details not shown). When the outliers were removed, HEX, PGI and ADH fit the normal distribution adequately.Estimation of mutational variance: The variance among lines is expected to increase in a linear fashion if the effects of new mutations are additive across loci. Regression coefficients describing the rate of increase of among-line variance per generation were used as estimates of mutational variance. These estimates are
pm
per second chromosome, which is 40% of the ge- nome, so the estimate of per-genome V m is 2.5 timesthis. An important parameter for determining proper- ties of mutation-selection balance of quantitative traits is V J V , . This ratio was estimated by dividing the esti-
TABLE 2
Among-line variance components
Unadjusted Weight adjusted
Gen 11 22 33 44 11 22 33 44
WT 0.0 0.096 2 0.032 0.128 f 0.049 0.164 t 0.042
-
PRO 0.0 0.086 -C 0.031 0.0 0.075 ? 0.026 -
TRI 0.0 0.027 -c 0.022 0.058 t 0.035 0.053 t 0.021 0.056 -+ 0.042 0.312 t 0.063 0.303 i- 0.084 0.365 t 0.082 GLY 0.0 0.048 f 0.025 0.029 t 0.029 0.070 t 0.024 0.0 0.293 -C 0.061 0.150 t 0.053 0.292 2 0.068 G6PD 0.084 f 0.049 0.085 t 0.031 0.062 t 0.036 0.130 t 0.036 0.324 f 0.105 0.312 t 0.064 0.414 ? 0.106 0.407 t 0.089 GP 0.0 0.0 0.0 0.006 2 0.013 0.022 t 0.034 0.256 rt 0.055 0.098 -+ 0.043 0.204 ? 0.051 GPDH 0.0 0.0 0.0 0.015 t 0.014 0.260 i- 0.089 0.120 ? 0.035 0.271 t 0.077 0.332 2 0.074 GS 0.0 0.062 t 0.028 0.0 0.249 2 0.059 0.071 t 0.045 0.394 t 0.076 0.082 t 0.039 0.696 2 0.142 HEX 0.074 C 0.047 0.0 0.002 t 0.024 0.079 t 0.027 0.306 f 0.101 0.166 -+ 0.042 0.101 t 0.043 0.394 C 0.088 ME 0.0 0.103 t 0.033 0.0 0.054 t 0.021 0.103 t 0.053 0.347 ? 0.068 0.204 t 0.064 0.253 t 0.059 PGD 0.0 0.0 0,011 C 0.026 0.028 i- 0.017 0.288 ? 0.095 0.208 -C 0.049 0.215 t 0.066 0.257 t 0.061 PGI 0.058 t 0.044 0.046 t 0.028 0.0 0.0 0.291 t 0.098 0.258 t 0.062 0.266 t 0.076 0.402 t 0.094
PGM 0.036 ? 0.036 0.0 0.0 0.100 C 0.033 0.158 2 0.065 0.119 t 0.035 0.204 t 0.064 0.388 2 0.088 TRE 0.015 t 0.033 0.036 t 0.025 0.098 -+ 0.043 0.212 t 0.052 0.542 t 0.156 0.648 t 0.114 0.264 t 0.076 0.582 2 0.122
ADH
-
- - -
-
- -FAS 0.0 0.0 0.0 0.007 -+ 0.012 0.187 t 0.073 0.317 ? 0.064 0.429 ? 0.109 0.784 t 0.168
-
-
0.360 2 0.097 --
- 0.787 t 0.181Mutation Accumulation in Drosophila
TABLE 3
Analysis of variance and analysis of covariance of all traits after 44 generations of mutation accumulation
773
Trait
~~
Dav Line Day
*
Line Vial ErrorWT PRO TFU GLY FAS G6PD GP GPDH GS HEX ME PGD PGI PGM TRE ADH TRI GLY FAS G6PD GP GPDH GS HEX ME PGD PGI PGM TRE ADH 0.04" 94.59: 387.71t 0.63 4.78' 14.44: 59.81: 4154.29: 4.02 2.69 214.52: 3.75: 21.72: 23148.03: 0.79 14.23: 802.20: 10.55 4.66 8.82: 43.06: 2566.94: 2.39: 0.18 130.45: 1.98: 6.38 18518.40: 1.01 6.57+
Unadjusted Mean Squares 0.004: 0.006:
18.28: 9.92
12.43: 10.79
2.48: 1.66
1.23: 0.75:
0.46 0.44
124.28 46.83
0.92: 0.18
1.30: 0.95: 5.61: 4.48:
0.09 0.18:
2.58 3.25
607.50: 150.55
5.08: 1.51
5.56: 1.29:
11 2.94: 74.08
Weight-adjusted Mean Squares (ANCOVA)
88.12: 62.25
9.34: 7.82:
2.47: 1.66
0.90: 0.61:
0.40 0.42
128.24 43.29
0.81: 0.13
1.14: 0.59
3.98 3.59:
0.09 0.15:
2.34 2.45
568.88: 109.89
3.60: 0.91
5.23: 1.10:
0.003: 1 1.34: 79.38: 8.49+ 2.19 0.45: 1.19: 137.49: 0.19: 0.84: 4.09: 0.12: 7.76: 187.48: 1.74: 1.18: 66.44: 6.49: 2.19: 0.38: 1.10: 132.87: 0.17: 0.72: 3.59: 0.111 7.65: 179.12: 1.41: 1.05: 0.001 10.42 32.75 2.06 1.74 0.13 0.1 1 33.23 0.07 0.17 1.01 0.05 1.39 42.41 0.39 0.46 30.93 1.73 1.75 0.12 0.10 30.92 0.07 0.14 0.88 0.05 1.32 40.39 0.32 0.45 W T was a significant covariate for all traits except FAS. PRO was a significant covariate in all but FAS, GS, and ADH. Degrees of freedom for all traits were Day ( l ) , Line (51), Day*Line (37), Vial (346) and Error (791).
*
P < 0.05, P < 0.01,*
P < 0.001.mate of
pm
by an estimate of within-line variance(t)
pooled across generations. This calculation was appro- priate because was found to be homogeneous across generations. As described in MATERIALS AND METHODS, a resampling approach was used to obtain standard er- rors of estimates ofp m / t .
Table 4 presents the results of these estimation procedures and illustrates the mag- nitude of deviation inpm
among traits. The bootstrap confidence intervals suggest significant increases in among-line variance, consistent with the ANOVA andANCOVA of Table 3.
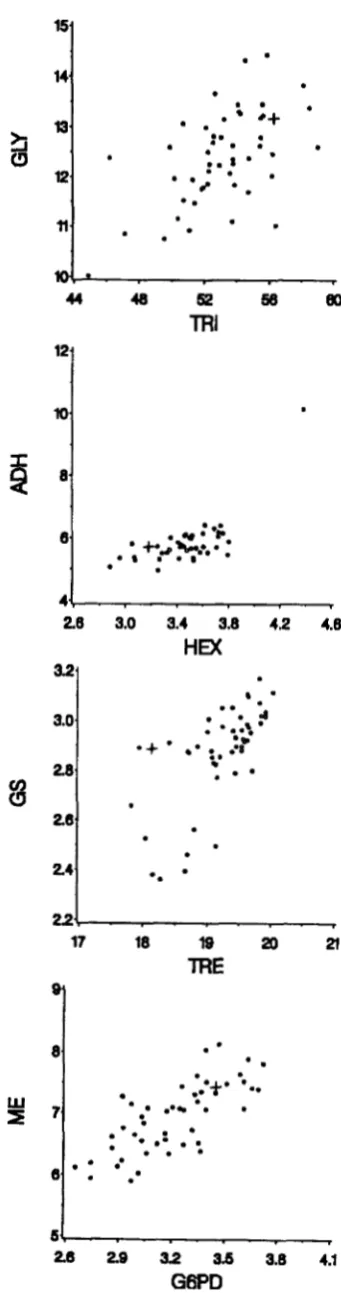
Accumulation of genetic covariance: Consistent with the idea that many of the mutations had pleiotropic effects, by generation 44 significant covariance had ac- cumulated for many of the pairs of traits. By plotting the line means for pairs of characters for the initial
founder line and for the generation 44 data, the pattern of dispersion and covariance can be seen (Figure 4 ) .
774 A. G. Clark. L. Wang and T. Hulleberg
~
.... ...
PGD
+"(rank/n)
FIGURE 3.-Normal probability plots of all 16 characters at
generation 44 of mutation accumulation. Each point repre- sents a line mean. The X-axis is the inverse cumulative distri- bution function for the rank and the Yaxis is the sorted rank.
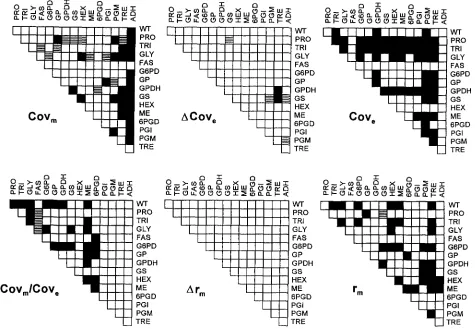
significant environmental covariance is positive. The bottom left panel of Figure 5 is Covm/Cov,, the scaled mutational covariance. Next, the mutational correla- tion, r, exhibited a striking lack of change across gener- ations. The last panel in Figure 5 shows that many pairs of traits exhibited significant mutational correlation.
DISCUSSION
Crude enzyme activities are influenced by variation in any of a number of steps in gene expression, including transcription, transcript processing, message stability, translation, posttranslational processing and the cata- lytic activity of the final enzyme. This observation makes it more plausible that the polygenic mutation rate of enzyme activities can be as high as the data indicate. Although most mutations in a structural gene reduce the efficacy of the enzyme product, mutations that
af-
fect enzyme activity may do so by influencing gene ex- pression at any of several levels. These effects can occur on positively or negatively acting regulatory pathways, and there is no way aprim'
to know which is more likely to suffer mutations. The data show significant increases in among-line variances with very little change in the mean activities, suggesting a nearly equal chance for positive and negative regulatory changes. The charac- ters in this study differed widely in the rate at which mutational variance accumulated, as quantified by esti- mates of VJV,. The magnitude of variation in muta-TABLE 4
Estimates of mutational variance
(pm)
and the mutationvariance scaled to environmental variance (Vm/V,)
Q,,/9?
xTrait
pm
X 1000R
1000WT 0.0 0.0014 i- 0.0001 PRO
9.4 i- 1.3 49.9 ? 23.4 13.107 ? 2.343 3.8 ? 1.6
TRI 241.0 ? 40.9 32.875 ? 1.418 7.3 ? 1.2 GLY 24.5 2 3.4 3.543 ? 0.132 6.9 ? 0.9 FAS 7.2 ? 2.1 1.613 ? 0.116
G6PD
4.5 ? 1.4 1.5 ? 0.2 0.196 i- 0.008 7.6 i 01.3 GP 1.6 i- 0.4 0.410 i- 0.027 3.9 i- 1.1 GPDH 293.3 i- 54.0 47.077 i 2.346
GS
6.3 2 1.3 1.2 ? 0.2 0.119 2 0.006 9.7 ? 01.4 HEX 1.6 ? 0.5 0.384 ? 0.025
ME
4.1 ? 1.3 6.5 ? 1.8 1.734 +- 0.079 3.7 ? 1.1 6PGD 0.2 2 0.1 0.078 ? 0.004 2.6 i- 1.2
PGI 1.3 ? 2.3 3.013 i- 0.106 0.4 i- 0.8 PGM 564.9 ? 96.8 90.367 -C 3.690
TRE
6.3 +- 1.1 3.0 ? 5.0 1.323 2 0.230 2.8 i- 4.0 ADH 12.1 2 1.3 0.429 ? 0.066 28.9 i- 5.6
en,
slope of among-line variance us. generation and repre-sents the inflation of variance per generation among lines; V,, within-liFe environmental variance averaged across gener- ations;
Vn,/K, ratio
ofpm
tope.
Values are mean 2 SD acrossthe 1000 bootstrap samples.
tional parameters suggests that the genes encoding the enzymes differ dramatically in the structure of their regulatory variation. The rapid accumulation of covari- ance among characters further supports the idea that most of the mutations have pleiotropic effects on many of the characters. The distributions of mutational ef- fects in this study were acceptably fitted by a normal distribution in 10 of the 16 characters. Three of the exceptions were leptokurtic, and the remaining excep- tions had significant outliers (elimination of outliers resulted in acceptable fits to normal distributions). In- ference of the distribution of effects per mutation re- quires fitting a model, and KEICHTLEY (1994) provided the machinery to obtain parameter estimates by maxi- mum likelihood. He found that the distribution of mu- tational effects for viability was highly leptokurtic, but estimates of mutation rates were strongly confounded with other parameters in the model, such as those speci- fying the distribution of mutational effects.
The heritability of these characters varies from 0.14
Mutation Accumulation in Drosophila 775
151
14
la
12
. ’
.
2 6 3.8 3.0 3.4 4 2 4.8
HEX
8
8
1
.
* .
2 6 29 3 2 3.6 3.8 4.1
GBPD
noted, however, that this claim is true for only some models of pleiotropy.
The pleiotropic effects of mutations can be inferred directly from the accumulation of covariance among characters in a mutation-accumulation experiment. In the absence of selection and assuming a population suf- ficiently large that effects of genetic drift can be ignored, the equilibrium covariance should be proportional to that seen among new mutations. Many investigators have sought to infer pleiotropic or epistatic interactions among traits from the patterns of genetic covariance, but this is not as simple as it might seem ( HOULE 1991 )
.
For example, two traits may be determined by two inter- acting pleiotropic loci but have 0 genetic covariance at equilibrium ( GIMELFARB 1986). Where the population falls in the parameter space of mutation rates and muta- tional effects also can be important. With pleiotropic mutations and stabilizing or directional selection, the “house-ofcards” and continuum-of-alleles models pro- duce very different patterns of equilibrium genetic covar- iance ( SLATKIN and FRANK 1990).Several studies have quantified variation and covaria- tion in enzyme activities in experiments designed to estimate parameters of quantitative genetics. LAURIE- AHLBERG et al. (1980, 1982, 1985) examined sets of second and third chromosome replacement lines of D.
melanogasterand found that most of the enzymes showed significant variation in activity. Most of the variation was found to occur at sites distinct from the structural locus.
A number of significant genetic correlations were de- tected ( WILTON et al. 1982), and it was noted that en- zymes sharing glucose-&phosphate as a substrate were positively intercorrelated. In the pentose phosphate shunt, the positive correlation between G6PD and
GPGD activities is one of the most consistently observed ( COCHRANE et al. 1983; MIYASHITA and LAURIE-AHLBERG 1984; CLARK and KEITH 1988). The observation of cor- relation between G6PD and GPGD activity, when the mutational correlation did not differ from 0, suggests that natural selection shaped the bivariate distribution
of these two activities. Studies of extant variation pro- vide an excellent backdrop against which to compare the distribution of mutational effects.
If the mutational covariance matrix and the genetic covariance matrix as estimated from an equilibrium population differ from one another by a degree greater than expected under a model of neutral genetic drift, we might infer that the departure is caused by natural selection. This motivates a formal statistical comparison
FIGURE 4.4cattergrams of line means at generation 44 of mutation accumulation. Means of each independent muta-
tion-accumulation line are shown ( 0 ) as is the mean of the
776 A. G. Clark, L. Wang and T. Hulleberg
9
U
WT
TRI PRO
G LY
FAS
GGPD GP GPDH GS
ME HEX
GPGD PGI
TRE PGM
wr
PRO TRI GLY
FAS
GGPD GP GPDH GS HEX ME GPGD PGI PGM TRE
4
wr
PRO TRI G LY
FAS
G6PD GP GPDH GS HEX ME GPGD
wr
PRO TRI G LY FASGGPD GP GPDH GS HEX ME GPGD
PGI
TRE PGM
FIGURE 5.-Estimates of several quantities related to the genetic covariance of newly arisen mutations. Cov, is the mutational covariance, estimated as the slope of the covariance over generations. ACov, is the rate of change of environmental covariance, estimated as the slope of the within-line covariance regressed on generation. Cov, is the estimate of environmental covariance pooled over generations. Cov,,,/Cov, is the analog to K n / V m , and is the mutational covariance scaled to the environmental covariance. Arm is the rate of change of mutational correlation (expected to be stable over generations) and r, is the genetic correlation of new mutations pooled over generations. For all plots, positive correlations
(m)
and negative correlations ( R )are shown with P < 0.05 in a sequential Bonferroni test of experiment-wide significance.
of covariance matrices. One caveat in comparing muta- tional and equilibrium covariance matrices is that ge- netic covariance is a property of the genetic variation sampled from a particular population.
In previous reports, we have tried to eliminate the effects of weight and protein content as covariates that were not themselves of intrinsic interest (CLARK and KEITH 1988,1989; CLARK 1989,1990). Novel mutations may alter the normal allometric relations between body size and enzyme activities, so in this report analyses were done with and without correcting for size. The mutation-accumulation lines showed significant devia- tion in weight and total protein by generation 44, and several of the traits exhibited significant correlations with these two traits. In tests of variation among lines in single characters, adjusting for effects of size changed the qualitative conclusion in only the case of HEX, which was significantly heterogeneous in raw scores but
not in weight-adjusted scores. When weight and total protein were treated as covariates, the partial correla- tions among traits were only slightly decreased from the unpartialed correlations. Allometric slopes with weight are less than one for all characters, and the slopes differ significantly among traits (CLARK and
Mutation Accumulation in Drosophila 777
crowded cultures, and hence smaller adults. Additional hypotheses relating the characters measured in this study to components of fitness will be tested when our analyses are merged with those of HOULE et al. ( 1994).
The observation of frequent, pleiotropic mutations has interesting consequences for metabolic characters. Simple models for the evolution of enzyme activity based on principles of metabolic control theory suggest that, in situations like bacterial chemostats where meta- bolic flux might be maximized by selection, enzyme activities evolve to the point where further changes in activity have negligible change in flux ( HARTL, et al. 1985; DEAN et al. 1988)
.
The relationship between en- zyme activity and flux has been demonstrated in higher organisms as well. A particularly clear case is that of G6PD activity and pentose phosphate shunt flux in Dro- sophila ( LABATE and EANES 1992). It has been argued that stabilizing selection also may be important to meta- bolic characters, and whether flux or metabolite con- centration is selected, the equilibrium distribution of allelic effects is expected to be skewed (CLARK 1991 ).
Such skewness has important consequences to the equi- librium genetic variance maintained in mutation-selec- tion balance ( BAKTON and TURELLI 1987).
Just as the relationship between activity and meta- bolic flux can provide an explanation for dominance
( KACSER and BURNS 1981 ) , quantitative genetic models of metabolic control can provide a means of generating stabilizing selection on enzyme activity when the target of selection is a property of the pathway (BEAUMONT
1988). The same mechanism that results in dominance of a single metabolic trait also is expected to produce consistent degrees of dominance for all pleiotropically related metabolic traits (KEICHTLEY and UCSER 1987)
.
An empirical test of this prediction requires an analysis of the dominance of the accumulated mutations. These experiments are underway. Although metabolism seems to involve a highly interactive system of charac- ters, the equilibrium epistatic variance is expected to be very small ( KEICHTLEY 1989).
Metabolic control theory provides a simple model for mapping many discrete characters (enzyme activities) into a global property (such as flux), which may be associated with fitness(CLARK 1991 )
.
Two mutations are most likely to be synergistic in their effects on fitness if they both influ- ence the same enzyme ( SZATHMARY 1993), providing a case in which pleiotropy influences the likelihood for epistasis. A likely cause for pleiotropy in metabolic characters is variation in transcription factors common to more than one gene. In the case of two classic exam- ples of enzyme activity variation, variation in transcrip- tion was shown to be the cause among different lines bearing Adhs alleles ofD.
melanogaster (THOMPSON et al. 1991 ) , and in Ldh-B expression in different populations of Fundulus heteroclitus ( CRAWFORD and POWERS 1992).
A population in mutation-drift balance would be ex- pected to exhibit a pattern of correlations that reflects the mutational correlations. A very small population, undergoing pronounced random drift, or a population subjected to natural selection may have an equilibrium correlation pattern that differs from the mutational cor- relation pattern. Previous studies revealed that G6PD and 6PGD exhibit a strong positive phenotypic and ge- netic correlation ( WILTON et al. 1982), yet we find no evidence for such correlated effects among new muta- tions. There was also a strong pattern of positive correla- tion among enzymes that share G6P as a substrate (PGI, PGM, HEX and GGPD) , although this pattern is much weaker among new mutations. These observation moti- vate a formal statistical test for the differences between estimates from an equilibrium population and the mu- tational patterns seen here.
The importance of pleiotropy in determining the properties of a mutation-selection balance depend on the covariance of mutational effects on each trait with fitness ( KEIGHTLEY and HILL 1988, 1992). Although there is an extensive literature reporting analyses of associations between enzyme activities and fitness-re- lated phenotypes (recently reviewed by WATT 1994), none of these studies report measures of fitness effects of newly arisen mutations. Comparison of these results from an extant, equilibrium population with those of newly arisen mutations, including P-element generated mutations (CLARK et al. 1995), may provide important insights into the past operation of natural selection.
We thank BRIAN CHARLESWORTH, DEBRA HOFFMASrER, JEFF IHAKA and especially DAW) HOUI.E for performing the mutation-accumula- tion experiment and sharing ideas and Drosophila stocks with us.
The manuscript benefitted from thoughtful commenh of NICHOIAS
BARTON, MICHAEL LYNCH, MIC;HAEI. TLJREI.I.I, T R U D Y M A C K A Y ~ ~ ~ two anonymous reviewers. W'e also thank KAREN BELL, CATHEKINE BENE- 1 x 1 , TIM GARVER, MARTY HANCZY(:, SIIARYN H o u ~ z , FRAN SZUMSKI,
CHRIS WHITE and LEM. YU for technical assistance. This work was supported by National Science Foundation grant BSR 9007436.
LITERATURE CITED
AQUADRO, C. F., H . TACHIDA, C. H. LANGLEY, K. HARADA and T.
MUKAI, 1990 Increased variation in ADH enzyme activity in Drosophila mutation-accumulation experiment is not due to transposable elements at the Adh structural gene. Genetics 126:
BARTON, N. H., 1986 The maintenance of polygenic variation
Genet. Res. 47: 209-216.
through a balance between mutation and stabilizing selection.
BARTON, N. H., 1990 Pleiotropic models of quantitative variation, Genetics 1 2 4 773-782.
BARTON, N. H., and M. TUREI.I.I, 1987 Adaptive landscapes, genetic distance and the evolution of quantitative characters. Genet. Res.
49: 157-173.
BARTON, N. H., and M. TUREI.I.I, 1989 Evolutionary quantitative genetics: how little do we know? Annu. Rev. Genet. 23: 337-370. BEAUMONT, M. A,, 1988 Stabilizing selection and metabolism. Hered-
i t y 61: 433-438.
778 A. G. Clark, L. Wang and T. Hulleberg
under optimizing selection, mutation and drift. Genet. Res. 19:
17-25.
BURGER, R., 1986 On the maintenance of genetic variation: global analysis of Kimura’s continuum-of-alleles model. J. Math. Biol.
BURGER, R., 1989 Linkage and the maintenance of heritable variation by mutation-selection balance. Genetics 121: 175-184. C I ~A. G., 1989 Causes and consequences of variation in lipid ,
and carbohydrate storage in Drosophila. Genetics 123: 131-144.
CIAKK, A. G., 1990 Genetic components ofvariation in energystorage in Drosophila melanogastrr. Evolution 44: 637-650.
C I M , A. G., 1991 Mutation-selection balance and metabolic control theory. Genetics 1 2 9 909-923.
CLARK, A. G., and L. E. KFJTH, 1988 Variation among extracted lines of Drosophila melanogasterin triacylglycerol and carbohydrate storage. Genetics 119: 595-607.
CIARK. A. G.. and L. E. KEIIH, 1989 Rapid enzyme kinetic assays of individual Drosophila and comparisons of fieldsaught D. melano-
gastrr and D. simulans. Biochem. Genet. 27: 263-278.
CIMK, A. G., and L.. WAN(;, 1994 Camparative evolutionary analysis of metabolism in nine species of Drosophila. Evolution (in press).
CIARK, A. G., L. WAN(; and T. HUI.I.EBERG, 1995 P-element-induced variation in metabolic regulation in Drosophila. Genetics 139:
337-348.
COCEIKANF, B. J.,J. LUCKHESI and C. C. LAC~RIE-AHI.BERG, 1983 Regu- lation of enzyme activities in Drosophila: genetic variation affect- ing induction of glucose &phosphate and tGphosphogluconate dehydrogenase in larvae. Genetics 105: 601-613.
CRAWFORD, D. I,., and D. A. POWFRS, 1992 Evolutionary adaptation to different thermal environments via transcriptional regulation. Mol. Biol. Evol. 9: 806-813.
DEAN, A. M., D. E. DYKHUIZEN and D. L. HARTI., 1988 Theories of metabolic control in quantitative genetics, pp. 536-548 in
Prucepdings of the Serond Intmatiunal Conference on Quuantitutivr Ge-
nelirs, edited by B. S. WEIR, E. J. EISEN, M. M. G O O D ~ N and G. NAMKOONC:. Sinauer Associates, Sunderland, MA.
ECGI.ESTON, W. B., D. M.JOHNSON-S(:HI.ITZ and W. R. ENGEI.S, 1988 P-M dysgenesis does not mobilize other transposable element families in D. melanogaster. Nature 331: 368-370.
ENGFXS, W. R., 1986 On the evolution and population genetics of hybrid-dysgenesis causing transposable elements in Drosophila. Philos. Trans. R. Soc. Lond. B Biol. Sci. 312: 205-215. GII.I.ESPIE, J. H., and M. TLJRE~.I.I, 1989 Genotype environment inter-
actions and the maintenance of polygenic variation. Genetics
GIMELFAKB, A,, 1986 Additive variation maintained under stabilizing selection: a two-locns model of pleiotropy for two quantitative characters. Genetics 112: 717-725.
GROSSMAN M., and G. A. E. GAI.I., 1968 Covariance analysis with unequal subclass numbers: componentestimation in quantitative genetics. Biometrics 2 4 49-59.
HARTI., D. I.., D. E. DYKHUIXEN and A. M. DEAN, 1985 Limits of adaptation: the evolution of selective neutrality. Genetics 111:
655-674.
HOUI.E, D., 1991 Genetic covariance of fitness correlates: what ge- netic correlations are made of and why it matters. Evolution 45:
630-648.
HO[II.E, D., D. K. HOFFMASTER, S. A$SIMA(:~POUI.~S and B. CHARmswowH, 1992 The genomic mutation rate for fitness in Drosophila. Nature 359: 58-60.
HOUI.E, D., K. A. HC~GHES, D. K. HOFFMASTER, J. IHARA,
s.
~ S S l M A C o - p o u 1 . o ~ pt ul., 1994 The effects of spontaneous mutation on quantitative traits. I. Variance and covariance of life history traits. Genetics 1 3 8 773-785.KACSER, H., a n d j . A. BURNS, 1981 The molecular basis of dominance. KFJGHTI.F.Y, P. D., 1989 Models of quantitative variation of flux in
KF,IGHTI.F,Y, P. D., 1994 The distribution of mutation effects on viabil-
~ ~ ~ w r I , w , P. D., and W. G. HII,I., 1988 Quantitative genetic variabil-
2 4 341-351.
121: 129-138.
Genetics 97: 639-666.
metabolic pathways. Genetics 121: 869-876.
ity in Drosophzla mrlanogaster. Genetics 138: 1315-1322.
ity maintained by mutation-selection balance in finite popula- tions. Genet. Res. 5 2 33-43.
KFGHTIXY, P. D., and W. G. HII-l., 1992 Quantitative genetic variation in body size of mice from new mutations. Genetics 131: 693- 700.
KEIGI~TLEY, P. D., and H. KACSF.R, 1987 Dominance, pleiotropy and metabolic structure. Genetics 117: 319-329.
& M U M , M., 1965 A stochastic model concerning the maintenance of genetic variability in quantitative characters. Proc. Natl. Acad. Sci. USA 5 4 731-736.
KONL)RA.SHOV, A. S., and M. TURELI-I, 1992 Deleterious mutations, apparent stabilizing selection and the maintenance of quantita- tive variation. Genetics 1 3 2 603-618.
LARATE, J., and W . F. EANES, 1992 Direct measurement of in vivo flux differences between electrophoretic variants of G6PD from
Drosophzlu mdanogaster. Genetics 132: 783-787.
LANDE, R., 1975 The maintenance of genetic variability by mutation in a polygenic character with linked loci. Genet. Res. 26: 221- 234.
IANDF., R., 1980 The genetic covariance between characters main- tained by pleiotropic mutations. Genetics 94: 203-215.
LATTER, 8. D. H., 1970 Selection in finite populations with multiple alleles. 11. Centripetal selection, mutation, and isoallelic varia- tion. Genetics 66: 165-186.
IAURIE-&ll.BER(;, C. C., G. MARONI, G. C. BEWLEY, J. C. LU(:C:HESI and B. S. WEIR, 1980 Quantitative genetic variation of enzyme activities in natural populations of Drosqbhilu mlanogastrr. Proc. Natl. Acad. Sci. USA 77: 1073-1077.
LAURIFAHI.BER(:, C. C . , A. N. WII.TON, J. W. CURTSINGER and T. H. EMIGH, 1982 Naturally occurring enzyme activity variation in
Drosophila melanogaster. I. Sources of variation for 23 enzymes. Genetics 1 0 2 191 -206.
LAURIE-AXBERG, C. C., P. T. BARNES, J. W. CURTSINGER, T. H. E M I G I ~ , B. KARI.IN et al., 1985 Genetic variability of flight metabolism in
Drotophilu mekmogastm 11. Relationship between power output and enzyme activity levels. Genetics 111: 845-868.
L ~ P E L , M. A,, and C. LOPEZ-FANJUI., 1993a Spontaneous mutation for a quantitative trait in Drosophila mlanogastrr. I. Response to artificial selection. Genet. Res. 61: 107-116.
LOPKZ, M. A,, and C. LOPEZ-FANJUI., 1993b Spontaneous mutation for a quantitative trait in Drusqbhila mlanogastrr. 11. Distribution of mutant effects on the trait and fitness. Genet. Res. 61: 107-
116.
LYNCH, M., 1988 The rate of polygenic mutation. Genet. Res. 51:
MACKAY, T. F. C . , 1984 Jumping genes meet abdominal bristles: hybrid dysgenesis-induced quantitative variation in Drosophila mul-
anogaster. Genet. Res. 44: 231-237.
MACKAY, T. F. C., 1985 Transposable element induced response to artificial selection in Drosophzla melanogaster. Genetics 111: 351-
374.
MACKAY, T. F. C., R. F. LYMAN, M. S. JAWSON, C. T k x z ~ m and W. G. HIIL, 1992 Polygenic mutation in Drosophila mrlaaoguster: esti- mates from divergences among inbred strains. Evolution 46:
300-316.
MIYASHITA, N., and C . C. IAURIE-AHI.RERG, 1984 Genetical analysis of chromosomal interaction effects on the activities of the glu- cose-&phosphate and &phosphogluconate dehydrogenases in
llrosophila melanoguster. Genetics 106: 65.5-668.
M u K . ~ , T., 1964 The genetic structure of natural populations of
Drosophilu melanogaster. I. Spontaneous mutation rate of poly- genes controlling viability. Genetics 50: 1-19.
MUKAI, T., S. I. CHIGUSA, I>. E. METTIXR and J. F. CHOW, 1972 Muta- tion rate and the dominance of genes affecting viability in Dro-
sophala melanogaster. Genetics 7 2 335-355.
MUKAI, T., K. HARALM and H. YOSHIMARU, 1984 Spontaneous muta- tions modifying the activity of alcohol dehydrogenase (ADH) in
Drosophila mrlanogastpr. Genetics 106: 73-84.
NAGMAKI, T., 1989 The maintenance of genetic variability in two-
locus models of stabilizing selection. Genetics 122: 235-248.
RICE, W. R., 1989 Analy7.ing tables of statistical tests. Evohtion 43:
223-225.
SANTIA(\C:O, E., J. AI.BORNOL, A. DOMIN(:CJKZ, M. A. TORO and C. IbPr;.L-
Mutation Accumulation in Drosophila 779
FANJUL, 1992 The distribution of spontaneous mutations on quantitative traits and fitness in Drosophila mlanogaster. Genetics
132 771-781.
SAS INSTITUTE, 1990 SAS/STAT User's Guide. SAS Institute, Inc., Cary,
SLATKIN, M., and S. A. FRANK, 1990 The quantitative genetic conse- quences of pleiotropy under stabilizing and directional selection. Genetics 125: 207-213.
SPITZE, I C , J. BURNSON and M. LYNCH, 1991 The covariance structure
of life-history characters in Daphnia Pulex. Evolution 4 5 1081- 1090.
SZATHMARY, E., 1993 Do deletion mutations act synergistically? Meta- bolic control theory provides a partial answer. Genetics 133: 127-
132.
TACHIDA, H., K. HARADA, C. H. LANGLEY, C. F. AQUAIJRO, T. YAMAZAKI
et al., 1989 Restriction map and alpha-amylase activity variation among Drosophila mutation accumulation lines. Genet. Res. 5 4
THOMSON, M. S., J. W. JACOBSON and C. C. LAURIE, 1991 Comparison
of alcohol dehydrogenase expression in Drosophila melanogaster
and Drosophila simulans. Mol. Biol. Evol. 8: 31-48.
NC.
197-203.
TURELLI, M., 1984 Heritable genetic variation via mutation-selection balance: Lerch's zeta meets the abdominal bristle. Theor. Popul. Biol. 25: 138-193.
TURELLI, M., 1985 Effects of pleiotropy on predictions concerning mutation-selection balance for polygenic traits. Genetics 11 1:
TURELLI, M., 1986 Gaussian versus non-Gaussian genetic analyses of
polygenic mutation-selection balance, pp. 607-628 in Evolution- aly Processes and Theory, edited by S. KARLIN and E. NEVO. Aca- demic Press, New York.
TURELLI, M., 1988 Population genetic models for polygenic variation and evolution, pp. 601-618 in Prvceedings of the Second Interna-
tional Conference on Quantitative Genetics, edited by B. S. WEIR, E. J. EISEN, M. M. GOODMAN and G. NAMKOONG. Sinauer Associates, Sunderland, MA.
WATT, W. B., 1994 Allozymes in evolutionary genetics: self-imposed burden or extraordinary tool? Genetics 136: 1 1 - 16.
WILTON, A. N., C. C. LAURIE-AHLBERG, T. H. EMICH and J. W. CURT-
SINGER, 1982 Naturally occurring enzyme activity variation in
165-195.
" ,
Drosophila mlanogaster. 11. Relationship among enzymes. Genetics
102: 207-221.