SMART2013, ENSI TEAM 1: CHALLENGES FACED DURING THE
MODELLING AND DYNAMIC ANALYSIS WITH SAP2000 USING
NONLINEAR LAYERED SHELL ELEMENTS
Dr. Maximilian Billmaier
1, Ioanna Sevdali
2, Yves Mondet
3, Dr. Tadeusz Szczesiak
4and
Urs Bumann
51Dr., Section of Seismic Engineering & Dynamics, Basler & Hofmann AG Consulting Engineers, CH-
8032 Zürich, ([email protected])
2Section of Seismic Engineering & Dynamics, Basler & Hofmann AG Consulting Engineers, CH-8032
Zürich, ([email protected])
3Head of Team Seismic Engineering & Dynamics, Basler & Hofmann AG, Consulting Engineers,
CH-8032 Zürich, ([email protected])
4Dr., Section of Structural Engineering, Swiss Federal Nuclear Safety Inspectorate ENSI, CH-5200
Brugg, ([email protected])
5Section of Structural Engineering, Swiss Federal Nuclear Safety Inspectorate ENSI, CH-5200 Brugg,
ABSTRACT
The international Benchmark Project SMART2013 has been organized by the CEA and the EDF under the hospice of the IAEA. It aims at understanding the nonlinear response of a typical reinforced concrete nuclear building subjected to high intensity seismic excitation and evaluating the modelling assumptions and analysis methods used to simulate the nonlinear behaviour. The project consists of four stages: development of the nonlinear Finite Element (FE) model; elastic calibration of the FE model using low intensity seismic test data (modal data and direct inputs/outputs in terms of accelerations and displacements); calculation of the expected nonlinear model's responses to high intensity seismic loadings using the updated FE model and the comparison with the measured values; probabilistic evaluations and vulnerability analysis. The computations described in this paper have been conducted by a team consisting of the Swiss Federal Nuclear Safety Inspectorate (ENSI) and the Basler & Hofmann Consulting Engineers (B&H) ("ENSI Team 1"). The focus of this paper is on the challenges faced during the modelling procedure in SAP2000 and on the lessons learned from the comparison between the measured and predicted structural responses. Parameter studies that have been conducted helped to identify ways to improve the FE model in order to increase the quality of the prediction of the structural responses. The vulnerability study has been conducted in terms of fragility curves for different seismic- and damage indicators. The modifications of the FE model based on engineering judgement significantly increased the model's ability to predict the response of the investigated reinforced concrete structure to high intensity seismic loadings.
INTRODUCTION
23rd Conference on Structural Mechanics in Reactor Technology Manchester, United Kingdom - August 10-14, 2015 Division V
nonlinear behaviour of the shear walls, slabs and frames as these structural elements are typically used in the design of reinforced concrete buildings of nuclear facilities. Within the project the efficiency of prediction methods (e.g. prediction of displacements, accelerations or nonlinear damage measures) for complex RC structures under strong seismic excitations were examined. Thereby, the focus was laid on a natural seismic scenario of a main shock and an aftershock. Probabilistic assessments in terms of fragility analysis have been performed. From March 2013 to November 2014 four phases of the SMART2013 benchmark project were carried out.
In the first phase, each of the benchmark's participant developed a global Finite Element (FE) model of the considered structure and defined local scale material models. In the second phase, the FE models have been calibrated using given modal data and direct force and response measurements for two time history runs (a random and a synthetic time history). In the third stage, blind nonlinear dynamic analysis for given medium to high-intensity seismic loadings have been performed. The numerical results obtained by all participating teams were compared then to the measured values from the experiment (blind prediction). The possibility to compare and validate approaches used for the dynamic response evaluation of reinforced concrete structures exhibiting both three dimensional and nonlinear behaviour was the main benefit of the benchmark. In the fourth stage, fragility studies were conducted both for a linear and a nonlinear FE model.
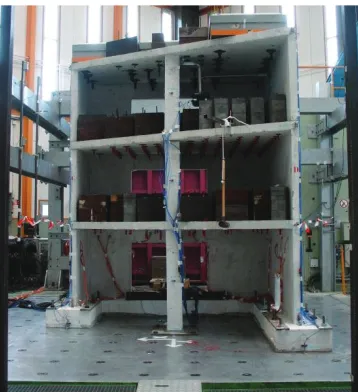
Figure 1. Front view of the mock-up on the shaker table (CEA)
The 1/4th scaled mock-up (Figure 1) used in the experiment is a three-story reinforced concrete structure with a trapezoidal floor plan. The structure represents a typical, electrical nuclear building, which could be located close to the reactor building. The dimension of the mock-up are 3.1 m (Figure 1: back wall), 2.6 m (right wall), resp. 1.0 m (left wall). The mock-up height is 3.6 m.
The analysed reinforced concrete mock-up has been developed in order to study the torsional behaviour and nonlinear structural response under severe seismic excitations. Its first three fundamental modal frequencies are in the range of 8-20 Hz, which is in a typical range for nuclear structures. detailed information about the mock-up is given in [7].
DEVELOPEMENT OF THE NUMERICAL MODEL AND PERFORMANCE OF SPECIFIC LOCAL TESTS
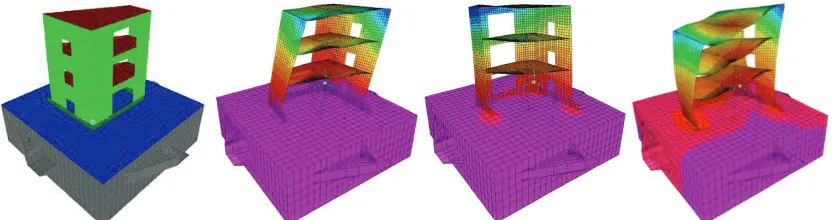
The ENSI Team 1 decided to develop a 3D numerical model with the commercial software SAP2000 (see Figure 2), which captures the dynamic behaviour of the specimen and which at the same time is suitable for practical use in terms of complexity and computational time. Therefore, linear shell and linear frame elements have been utilized for the modelling of the specimen's slabs, columns, beams and foundation. Only the reinforced concrete walls of the specimen, which are expected to carry most of the seismic loads and exhibit inelastic behaviour under high intensity loading, have been modelled using nonlinear layered shell elements. The properties of the ENSI Team 1 model are described in Table 1. The first three mode shapes of the model are shown in Figure 2. The eigenmode with a dominating mass ratio in the horizontal x-direction has an eigenfrequency of 6.04Hz (CEA: f1=6.28Hz [RIC13]) and the eigenmode with a dominating mass ratio in the horizontal y-direction has an eigenfrequency of 9.00Hz (CEA: f2=7.86Hz [RIC13]). The third eigenmode (torsional mode) has an eigenfrequency of 20.13Hz (CEA: f3=16.50Hz [RIC13]). The observed differences between the frequencies calculated using the FE Model and the CEA modal identifications could be caused by the minor flexibility of the actuators, which the model does not take into account, as well as the fact that the connection between the specimen and the shaking table has been modelled too stiff.
Figure 2. Front view of the numerical model fixed on the shaking table and mode shapes (figures from left to right: SAP2000 model, mode f1,x=6.04Hz, mode f2,y=9.00Hz, mode f3,T=20.13Hz)
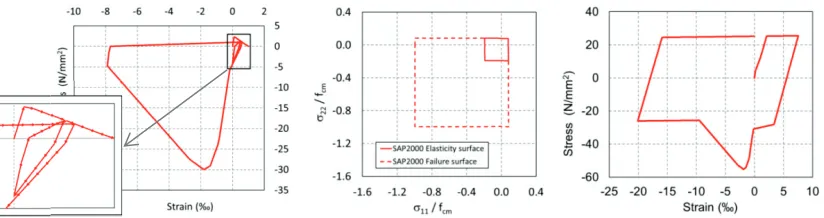
The performance of local tests during the first stage of the SMART2013 Project allowed the participants to investigate the principal material effects that have been taken into account by their numerical model and thus evaluate its efficiency and accuracy. In the local test c.3 [RIC14] uniaxial tension and compression are applied to a simple concrete element; the resultant stress-strain diagram is shown in Figure 4. As the concrete material undergoes nonlinear deformation, "hysteretic loops" are developed at the tension part of the curve due to the assigned "Takeda" hysteretic model. These loops exhibit stiffness degradation, as depicted in Figure 4. The applied tensile strain at the start of the test is not large enough to cause full loss of tensile strength. The remaining tensile strength is activated at the last part of the test.
Table 1: Properties of the model
ENSI Team 1 model (SAP2000)
Slabs Horizontal linear shell elements, concrete
Columns and beams Linear frame elements, concrete
Walls Vertical nonlinear layered shell elements, concrete nonlinear S11, S22 and S12, steel
reinforcement nonlinear S11 and S12 (S22 inactive)
23rd Conference on Structural Mechanics in Reactor Technology Manchester, United Kingdom - August 10-14, 2015 Division V
Shaking table Linear shell elements, aluminium, SAP2000 AZALEE shaking table model
developed by CEA [
RIC14
] has been usedSupport of shaking table
Each of the 4 horizontal actuators has 6 fixed nodes and each of the 4 vertical actuators has 16 fixed nodes, all positioned in the direction of the actuators
Concrete Standard SAP2000 material constitutive law (see Figure 3) for concrete "C35/45, Eurocode", modified so that: E=28GPa, v=0.19, f'c=38MPa and f'ct=3.8MPa,
hysteretic model "Takeda", which takes stiffness degradation into account
Reinforcement steel Standard SAP2000 material constitutive law (see Figure 3) for reinforcement steel "Rebar, Europe", modified as follows: a) reinforcement Ø3/Ø4: fy=650MPa,
fu=690MPa and Ecm=323GPa and b) reinforcement Ø6/Ø8/Ø10: fy=510MPa,
fu=570MPa and Ecm=257GPa, hysteretic model "Kinematic"
Damping Rayleigh damping of 5 % applied at 6Hz i.e. the first mode (CEA meas.: 2.6 %
[RIC13]), 4.3 % applied at 9Hz i.e. the second mode (CEA meas.: 4.2 % [RIC13]) and 5 % applied at 20Hz i.e. the third mode (CEA meas.: 5.5 % [RIC13])
Mass Total mass: 70.3 t (CEA meas.: 70.8 t [RIC14]), mass of the bare mock-up: 12.7 t
(CEA meas.: 11.9 t [RIC14]), additional masses: 33.9 t (CEA meas.: 33.9 t [RIC14]), mass of the shaking table: 23.6 t (CEA meas.: 25 t [RIC14])
Gravitational acceleration
Gravitational acceleration applied as a linearly increasing load (time step 0.05s, duration 1s) prior to the seismic loading
Seismic loading Seismic loading applied in form of 4 horizontal and 4 vertical displacement time histories, acting simultaneously at the corresponding support points (actuators)
Time integration method
Nonlinear direct integration time history analysis using the "Hilber-Hughes-Taylor alpha" method with alpha=0 (generally -1/3≤alpha≤0), which is equivalent to the Newmark method with gamma=0.5 and beta=0.25. When alpha=0 the HHT method delivers, according to [CSI11], the most accurate results of the available methods, but permits vibrations in the higher frequency modes
Analysis time step Input time step: 0.004885s, Output time step: 0.004885s
Hardware used CPU Xeon 1P 4C 3.5GHz, RAM 32GB, HD SSD 2TB 6Gbps, Win 7 Pro 64-bit
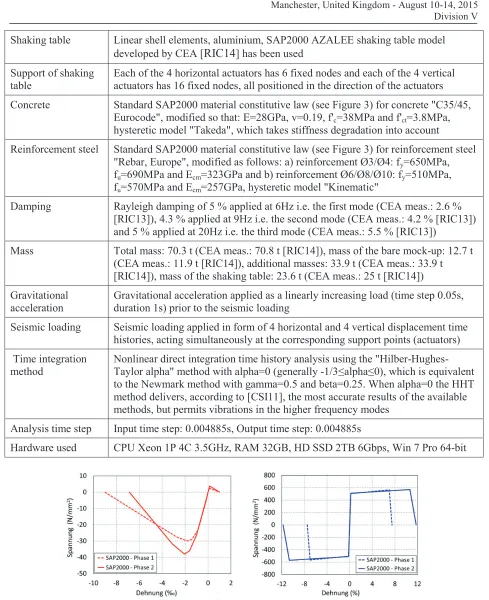
Figure 3. Constitutive law for concrete (left) and for reinf.steel (right) in compression and tension
[RIC14]). The elastic envelope is defined by the yielding points of the concrete constitutive law; only the strains and stresses inside this envelope remain linear during the loading and have constant stiffness. The failure envelope forms a square due to the fact that a simplified failure criterion has been adopted for the definition of the failure surface, according to which failure occurs at a point when a specific strain is reached under maximal loading. The stress-strain curve of the reinforced concrete element subjected to uniaxial tension and compression shows that the model exhibits "strain hardening" and as a result stress reduction is observed on the opposite side of the curve.
Figure 4. Concrete under uniaxial cyclic tension/compression (left), elasticity and failure surfaces of concrete (middle) and reinforced concrete under uniaxial cyclic tension/compression (right)
ELASTIC CALIBRATION OF THE NUMERICAL MODEL
The elastic calibration is carried out by comparing the analysis results of the numerical model under low intensity seismic loading with the measured accelerations and displacements. In this context, several alternatives were tested for the modelling of the connection between the mock-up and the shaking table. The ENSI Team 1 has tried to model the anchors of the foundation using nonlinear link elements with Hook ("tension-only") properties and the reinforced concrete footing using nonlinear link elements with Gap ("compression-only") properties. However, this solution increased the computational time of the analysis enormously and thus had to be rejected. After testing several modelling alternatives for the foundation using nonlinear elements, the ENSI Team 1 decided to model the foundation using vertical linear shell elements with a fixed connection to the table. The disadvantage of this modelling solution is that the flexibility of the connection between the mock-up and the shaking table in tension is neglected. The differential displacements and the resultant flexibility of the connection between the mock-up and the table would be negligible, if the anchors of the foundation were pre-stressed.
Another basic parameter that has been taken into account during the elastic calibration of the numerical model is its elastic damping, which has a major influence on the outcome of the elastic analysis. The elastic damping has been applied in the form of Rayleigh damping. The elastic damping matrix is a linear combination of the stiffness matrix, scaled by the stiffness coefficient cK and a mass matrix, scaled by a mass coefficient cM. In a nonlinear analysis, the stiffness coefficient is multiplied by the initial stiffness matrix of each element at zero initial conditions, regardless of the nonlinear state used to start this analysis [CSI11]. For the low intensity seismic loading a relatively high elastic damping of approximately 5% (see Table 1) had to be applied to the SAP2000 model in order to obtain a sufficient agreement between the calculated and measured displacements and accelerations. This value is almost double than the damping measured by CEA during Run006 [RIC13]. This difference is considered to be acceptable due to the fact that damping measurements at low intensity are quite sensitive.
23 Conference on Structural Mechanics in Reactor Technology Manchester, United Kingdom - August 10-14, 2015 Division V
actuators provides reasonable results only when the input and output time steps are equal to or smaller than 0.004885s. In Figure 5 the numerical results from the SAP2000 model are compared to the CEA measurements for the Run007 [RIC]. For low intensity seismic loading the numerical results are in good agreement with the measurements. The basic sources of concern at this stage are the long computational time needed for a nonlinear analysis (≈10h needed for a 7s long excitation) and the application of 5% elastic damping at the model, which is a relatively high damping for a low intensity seismic motion.
Figure 5. Displacements and response spectrum of point D in y-direction, 3rd floor, Run007
NONLINEAR DYNAMIC BEHAVIOUR OF THE NUMERICAL MODEL AND
COMPARISON WITH TEST RESULTS
The ENSI Team 1 used the same model for the high intensity seismic analyses as for the elastic calibration; the only adjustment that was made to the model is the 60% reduction of the effective stiffness of concrete at the linear shell elements (i.e. the slabs and the foundation) to account for the concrete cracking. In every model analysis (Run) the nonlinearities from the previous Run have been considered, although not all high intensity seismic motions were strong enough to induce yielding and at the same time the influence of nonlinearities from previous Runs has proved to be important only at the beginning of the time history. During the strong motion analysis the hysteretic damping of the materials (i.e. "Takeda" hysteresis for the concrete and "Kinematic" hysteresis for the reinforcement steel) is added to the assigned elastic damping of 5% (Rayleigh damping). In theory, the Rayleigh damping model is valid for linear calculations only. Since the nonlinear effects of the reinforced concrete model are local and considerably small, the Rayleigh model can nevertheless be used.
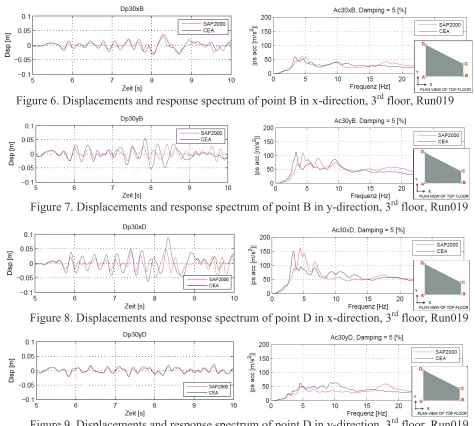
Figure 6. Displacements and response spectrum of point B in x-direction, 3
rdfloor, Run019
Figure 7. Displacements and response spectrum of point B in y-direction, 3
rdfloor, Run019
Figure 8. Displacements and response spectrum of point D in x-direction, 3
rdfloor, Run019
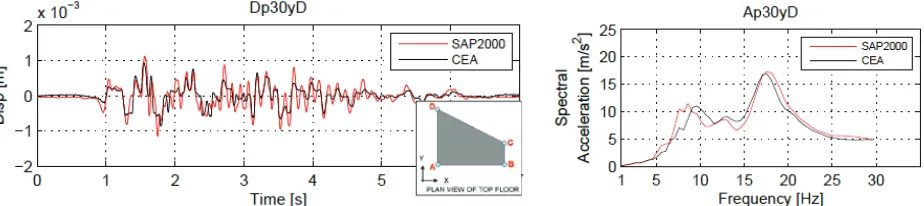
Figure 9. Displacements and response spectrum of point D in y-direction, 3
rdfloor, Run019
VULNERABILITY STUDY AND REMARKS ON THE FRAGILITY CURVES
23 Conference on Structural Mechanics in Reactor Technology Manchester, United Kingdom - August 10-14, 2015 Division V
Figure 10. Example of the random sample for the uncertain variable fct, 2
ndfloor
The ENSI Team 1 applied for the determination of the fragility curves the method proposed by CEA [RIC14], according to which the two parameters that define each curve, namely the mean capacity Am and the variability β, are derived from a linear regression ("cloud analysis method"). The documentation of CEA [RIC14] can be misleading regarding the calculation of β. Further information about this issue is provided in the paper of ENSI Team 2 [ZIN14].
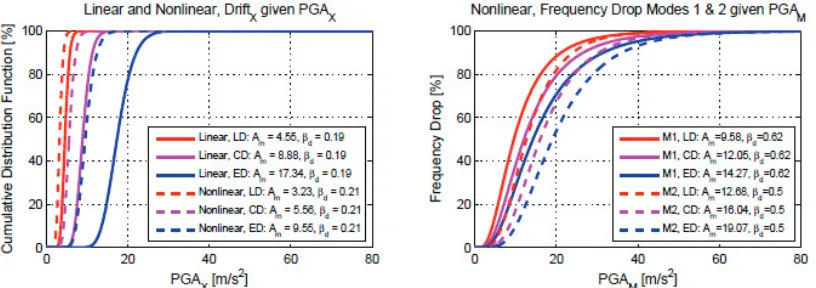
Figure 11 illustrates the fragility curves for all three levels of damage (light, controlled and extended) using the maximum inter-storey drift in x-direction (left) and the frequency drop (right) as damage indicators and the PGA as seismic input motion indicator. The frequency drop has been calculated by performing a modal analysis in SAP2000 after each nonlinear analysis, using the nonlinear state of the numerical model as initial conditions, in order for the induced nonlinearities to be taken into account. In the left diagram (Figure 11) the fragility curves obtained from nonlinear analyses exhibit for a given damage level a higher conditional probability of failure than the fragility curves obtained from linear analyses. Due to the fact that the model undergoes more deformation in the nonlinear analysis than in the linear, the nonlinear deformations and drifts are larger than the linear and consequently a specific level of damage (i.e. the critical drift in x-direction) is more likely to be reached. This outcome reflects the fact that the numerical model follows the "equal energy rule" instead of the "equal displacement rule", which is not unusual for stiff systems with eigenfrequencies greater than 2Hz. The fragility curves obtained from linear analyses provide in this case results that are not on the safe side. In the right diagram (Figure 11) the fragility curves for the different levels of damage lie quite close to one another, because most of the calculated frequency drops are very small (insufficient sampling) and therefore the regression analysis does not deliver satisfying results. This finding is in line with the results of the comparison of Run019 (see previous chapter). Thus, the frequency drop is at least in the case of SAP2000 not a good damage indicator.
CONCLUSIONS
The ENSI Team 1 has participated in the Benchmark SMART2013 Project with the objective to examine whether the commercial software SAP2000 can efficiently predict the nonlinear behaviour of the reinforced structure in practical applications. For this purpose predefined standard SAP2000 material models for concrete and reinforcement steel have been used, after being modified so that they correspond to the measured material properties. The nonlinear behaviour of the structure has been stimulated by means of SAP2000 typical nonlinear layered shell elements. However the performance of nonlinear time history analyses for reinforced wall structures in SAP2000 has proved to be a complex and computational time demanding task. A huge amount of data is generated and stored during each nonlinear analysis, since the user does not have the option to limit the storage of analysis data to selected nodes or to divide the resulting data file when performing an analysis sequence. For this reason the computational time is very long, the resulting data file is very large and an external software tool such as Matlab has to be used to process the vast amount of data. Furthermore, the integration parameter alpha and the time step size have to be chosen very carefully in the nonlinear time history analysis in SAP2000 because they have a significant and hardly predictable effect on the computed results.
The modelling of damping in nonlinear time history analysis is a major issue, especially as far as elastic damping is concerned. It has to be mentioned that the damping measurements at low intensity are quite sensitive. Thus, it is acceptable for the ENSI Team 1 to apply damping ratios that differ up to a factor of 2 from the proposed (measured) values. For low intensity seismic motion the numerical results depend strongly on the elastic damping and a relatively high damping value had to be applied to achieve a good correlation to the experimental data. For the high intensity seismic motion, on the other hand, the numerical results are affected more by the hysteretic material behaviour than by the elastic damping. The comparison between the numerical results and the experimental measurements has shown that the used SAP2000 model provides in the case of nonlinear analyses comprehensible and relatively satisfying results. However, it underestimates the frequency drop and the displacements; the ENSI Team 1 needs to verify that this result is caused by the chosen effective stiffness for the linear modelled slabs, which seems to be too high regarding the load level of Run019.
Regarding the vulnerability analysis, the inter-storey drift proved to be a more reliable damage indicator that the frequency drop because there are significant uncertainties related to the measurement and determination of the frequency drop. Even though the peak ground acceleration (PGA) is the most common seismic indicator, the cumulative absolute velocity (CAV) and the area under the acceleration response spectra (ASA40) are considered to be more meaningful. Finally, it has become obvious that, when linear analyses are used for the fragility study instead of nonlinear analyses, the results for the same deformation based damage indicator (e.g. drift) are not on the safe side.
The ENSI Team 1 will utilize the outcome of the Benchmark SMART2013 Project as well as the valuable input from the other participating teams in order to optimise its methodology of nonlinear analysis of nuclear structures under earthquake load.
DISCLAIMER
The benchmark project SMART2013 has been organized by the CEA (Commissariat à l'Energie Atomique) with the support of the EDF (Electricité de France) and the IAEA (International Atomic Energy Agency). It is a succession project of the benchmark project SMART 2008.
REFERENCES
[1] [RIC14] Richard, B., Chaudat, T. (2014). Presentation of the SMART2013 International Benchmark, Spezification Technique DEN/DANS/DM2S/SEMT/EMSI/ST/12-017/H, CEA.
23rd Conference on Structural Mechanics in Reactor Technology Manchester, United Kingdom - August 10-14, 2015 Division V
[3] [RIC] Richard B., Chaudat, T. (2013). SMART2013 International Benchmark, http://smart2013.eu, CEA.
[4] [CSI11] CSI SAP2000 (2011). CSI Analysis Reference Manual, Computers and Structures, Inc., Berkeley, USA.
[5] [ZIN14] Zinn, R., Borgerhoff, M., Van Exel, C., Szczesiak, T., Bumann, U., (2014). “SMART 2013, ENSI Team 2: ...", Workshop SMART 2013, Paris, France.
[6] B. Richard, M. Fontan, J. Mazars. "SMART 2013: overview, synthesis and lessons learnt from the International Benchmark." CEA/DEN Technical Report.
CEA/DEN/DANS/DM2S/SEMT/EMSI/NT/14-037/A. 2014.
[7] B. Richard, T. Chaudat, "Presentation of the SMART 2013 International Benchmark". CEA/DEN Technical Report. DEN/DANS/DM2S/SEMT/EMSI/ST/12-017/H.