Copyright1999 by the Genetics Society of America
Pattern of Nucleotide Substitution and Rate Heterogeneity in the
Hypervariable Regions I and II of Human mtDNA
Sonja Meyer, Gunter Weiss and Arndt von Haeseler
Max-Planck-Institut fu¨r evolutiona¨re Anthropologie, D-04103 Leipzig, Germany Manuscript received August 6, 1998
Accepted for publication April 2, 1999
ABSTRACT
This study provides a comprehensive survey of the complex pattern of nucleotide substitution in the control region of human mtDNA, which is of central importance to the studies of human evolution. A total of 1229 different hypervariable region I (HVRI) and 385 different hypervariable region II (HVRII) sequences were analyzed using a complex substitution model. Moreover, we suggest a new method to assign relative rates to each site in the sequence. Estimates are based on maximum-likelihood methods applied to randomly selected subsets of sequences. Our results indicate that the rate of substitution in HVRI is approximately twice as high as in HVRII and that this difference is mainly due to a higher frequency of pyrimidine transitions in HVRI. However, rate heterogeneity is more pronounced in HVRII.
S
EQUENCES from the noncoding control region of and correct reconstruction of phylogenies has not been recognized (Wakeley 1993, 1994, 1996; Yang 1996). mitochondrial DNA are widely used to addressques-tions concerning genetic variation within species (Cann Especially in a population genetics context, a model that describes the substitution process is explicitly necessary. et al. 1987;GarnerandRyder1996;Watsonet al. 1996;
GoldbergandRuvolo1997). Their high evolutionary Choosing an inappropriate model may lead to misinter-pretation of the data. For example, mutational hot spots rate and their maternal inheritance make them
excep-tionally suitable for analyzing population history. Hyper- (i.e., positions at which substitutions accumulate pre-variable regions I and II (HVRI, HVRII) in the control dominantly) could mimic population expansion ( Lund-region of human mtDNA have been studied extensively strom et al. 1992a; Bertorelle and Slatkin 1995; to infer, for example, aspects of historical biogeography Aris-BrosouandExcoffier1996). Ignoring the exis-and the time since the most recent common ancestor tence of heterogeneous mutation rates may yield biased of human mtDNAs (Cannet al. 1987; Hasegawaand estimates of measures of genetic diversity and/or param-Horai 1991; Vigilant et al. 1991; Ward et al. 1991, eters of population history (Lundstrom et al. 1992a; 1993;Pesoleet al. 1992;Stonekinget al. 1992;Watson Bertorelle and Slatkin 1995; Aris-Brosou and et al. 1996;Kringset al. 1997). Although.4000 HVRI Excoffier1996;DengandFu1996;Tajima1996; Mis-and 900 HVRII sequences of humans from all over the awaandTajima1997). For example, the estimation of world have been determined, knowledge of the substitu- the time to the most recent common ancestor strongly tion pattern is still far from complete. However, it is depends on both the population genetics model and the now clear that human control region sequences evolve estimated parameters therein. Therefore, population according to a complex pattern that makes analysis dif- genetics inference benefits from a better understanding ficult. For example, base composition is not uniform, of the substitution process of a genomic region. transitions occur in greater frequencies than transver- On the other hand, the findings of pedigree analyses sions, the number of pyrimidine transitions in the L-strand have generated much confusion about the frequency exceeds the number of purine transitions, and substitu- of mutations that affect the HVR (Howellet al. 1996; tion rates vary among sites (AquadroandGreenberg Parsonset al. 1997). From these studies, mutation rate 1983;KocherandWilson1991;TamuraandNei1993; estimates have been obtained that arez20-fold higher
Wakeley1993). than those derived from phylogenetic studies. The
ques-Probably the most enigmatic feature of HVR sequence tion of whether mutational hot spots can account for this evolution is the variation of rates among sites. Until enormous discrepancy in mutation rates has become recently, the importance of accounting for rate hetero- a hotly debated issue (Pa¨a¨bo 1996; Jazin et al. 1998; geneity to obtain unbiased estimates of the transition- ParsonsandHolland1998). To gauge the contribu-transversion ratio, unbiased dating of speciation events, tion of hot spots to the high rate estimate, we need to know the rate for each sequence position. Beyond being of use for the interpretation of the apparently conflict-Corresponding author: Arndt von Haeseler, Max-Planck-Institut fu¨ r
ing mutation rate estimates, knowledge of site-specific
evolutiona¨re Anthropologie, Inselstr. 22, D-04103 Leipzig, Germany.
E-mail: [email protected] rates is of great benefit to sequence analyses in general,
1104 S. Meyer, G. Weiss and A. von Haeseler
as it allows the refinement of phylogenetic models and purine transition parametert, and the rate-heterogene-ity parameterawas done using a phylogenetic approach a more precise interpretation of population sequence
data. This study provides a comprehensive survey of the and a subsampling procedure. More precisely, we drew a random sample of different sequences from the data nucleotide substitution pattern of HVRI and HVRII with
special attention to variation among sites. set containing either HVRI or HVRII sequences. From this random sample a tree was constructed and the parameters k, a, and t were estimated from the tree DATA
using approximate maximum likelihood and discrete G-distribution with eight categories as implemented in We used a publicly available collection of aligned
human mitochondrial control-region sequences that the PUZZLE program (Strimmerand von Haeseler 1996). From biological considerations, one should expect comprised 4079 HVRI and 969 HVRII sequences of
individuals from all over the world (Handtet al. 1998). a continuum of rates among sites (Uzzel andCorbin 1971;KocherandWilson1991). However, maximum-It can be retrieved via the worldwide web at URL http://
www.eva.mpg.de/hvrbase/. From this data collection we likelihood calculations with the continuous G-distribu-tion involve intensive computaG-distribu-tions and are feasible extracted all sequences that were sequenced without
ambiguities in the range from 16024 to 16382 in HVRI only for data sets up to six sequences (Yang1996). We repeated the entire estimation procedure 150 times for and from 57 to 371 in HVRII according to the
number-ing of Anderson et al. (1981). These sequence parts different random samples of a given size to obtain pa-rameter estimates that are not affected by the sample were chosen because they were the largest continuously
determined subregions in the majority of sequences but are representative for all HVRI or HVRII sequences, respectively. Subsequently, we averaged the values of in the collection. The alignments of the two regions
contained only a few gaps. The HVRI part enclosed the parameter estimates from the subsamples. To inves-tigate the effect of sample size on the estimates kˆ, tˆ, seven gaps of varying length at positions 16104.1,
16169.1, 16174.1, 16183.1–16183.4, 16227.1, 16259.1, andaˆ, the above procedure was carried out for samples of size 10, 20, 30, . . . , 80.
and 16366.1, whereas five gaps at positions 65.1, 190.1,
294.1, 302.1–302.4, and 310.1–310.2 were observed in Site-specific rates:In the following we assumed that the parametersk,t, andaare known or estimates are the alignment of the HVRII sequences. Positions in the
alignment that show a gap were excluded from the anal- given, for example, from the approach described in the previous section. To obtain estimates of the site-specific ysis. Because we pursued a phylogenetic approach, we
reduced the set of sequences such that each sequence rates, we used a discretizedG-distribution (Yang1993). Here, the range of possible rates was divided into eight type was represented only once in our set. This led to
a final data set comprising 1229 different HVRI and 385 categories such that each category was equiprobable under theG-distribution. Within each category we com-different HVRII sequences.
puted the median rate. Thus, we assumed that each site evolved according to one of these eight rates. The MODEL AND METHODS
following procedure was applied to estimate site-specific rates: For a random sample of 50 different sequences Model of sequence evolution:To quantify the
substi-tution process and rate heterogeneity among sites, we a maximum-likelihood tree was computed. On the basis of this tree, the likelihood of a specific site was computed used the Tamura-Nei (Tamura andNei1993) model
assuming G-distributed rates. It has been suggested for each of the eight rates using PUZZLE (Strimmer and von Haeseler 1996). The rate that yielded the (Weissandvon Haeseler1998) that this model is the
most appropriate to describe the evolutionary process of highest likelihood value was assigned to this site. From a Bayesian point of view this corresponds to choosing human HVR sequences. The Tamura-Nei (1993) model
withG-distributed rates includes the parameterspA,pC, the rate with the maximal posterior probability, because the way of discretizing theG-distribution resulted in a pG,pT,k,t, andathat have to be estimated from the
data.p 5(pA,pC,pG,pT) is the equilibrium distribution uniform prior distribution. Thus, for each site in the alignment of 50 sequences, a rate was computed. The of base frequencies, the parameter k adjusts for the
transition-transversion ratio, andtdescribes the ratio of entire procedure was repeated 50 times for different random samples. Therefore we obtained for each site pyrimidine transitions to purine transitions. The shape
parameter of theG-distributionais inversely related to 50 estimates of its specific rate. The relative rate for each site was simply the average value.
the extent of rate heterogeneity among sites.
Parameter estimation: The equilibrium distribution of base frequencies,p, was estimated from the data by
RESULTS averaging the base composition of all sequences. This
estimate should be very similar to the maximum-likeli- Figure 1 displays the averages of the transition-trans-version parameter k, the pyrimidine-purine transition hood estimate (Goldmann 1993). Estimation of the
Figure1.—The ordinate represents the value of the parameter estimate, calculated as the average from 150 repeats. The abscissa gives the number of different sequences in each sample.kˆHVRIandkˆHVRIIrepresent the estimated values for the transition-transversion parameter,tˆHVRIandtˆHVRIIare the estimated values for the transition-transversion parameter, andaˆHVRIandaˆHVRII denote the estimates of the rate-heterogeneity parameter for HVRI and HVRII, respectively. Asterisks reflect averaged values from 150 repeats each; bars reflect twofold standard deviation of the sample mean.
for HVRI and HVRII as a function of the number of more or less independently of the sample size. A similar picture emerges for the estimation of the pyrimidine-different sequences sampled (sample size). With
in-creasing sample size all estimates decrease and show purine transition parametert. In HVRI, the estimated value oftdecreases from 2.5 to 1.75, and the estimated few changes for samples of size 60 or more; this is also
reflected in the decrease of the variance of the sample value oftin HVRII varies between 1.07 and 1.18. Because larger subsamples reflect the transition-trans-mean. The observation that 60 or more sequences are
needed to reduce the bias in parameter estimates is due version ratio and the pyrimidine-purine transition ratio with smaller standard derivation than smaller subsam-to the fact that the sequences are very similar, and so
there is little information regarding the parameters. ples, we suppose that the estimated values ofk and t for the larger subsamples are closer to the true values. For more divergent sequences we do not expect such
a strong relationship between subsample size and bias. Small samples may contain none or too few transver-sions, and thuskis overestimated. Ifkwere not inferred In HVRI, the estimate of the transition-transversion
1106 S. Meyer, G. Weiss and A. von Haeseler
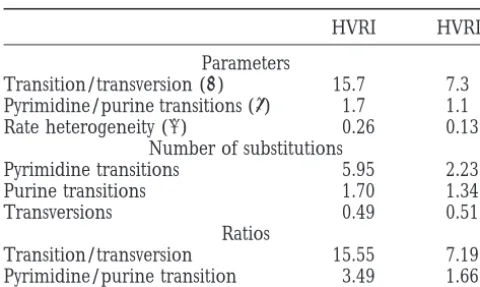
TABLE 1 In HVRI the fastest positions evolve with relative rates of 4.8. The proportion of sites in HVRII with relative Summary of estimated parameters and ratios
rates,0.001 (virtually not variable) is 0.54. This is al-most twice as high as the value of 0.28 that we found
HVRI HVRII
for HVRI. Parameters
Transition/transversion (kˆ) 15.7 7.3 Pyrimidine/purine transitions (tˆ) 1.7 1.1
DISCUSSION
Rate heterogeneity (aˆ) 0.26 0.13
Number of substitutions
Applying maximum-likelihood methods to randomly
Pyrimidine transitions 5.95 2.23
selected subsets of different sequences, we estimated
Purine transitions 1.70 1.34
from the subsets the parameters of the Tamura-Nei
Transversions 0.49 0.51
Ratios (1993) model with rate heterogeneity. The importance
Transition/transversion 15.55 7.19 of simultaneous parameter estimation, especially if rate Pyrimidine/purine transition 3.49 1.66 heterogeneity exists among sites, has become
increas-ingly clear (Wakeley1994, 1996;Swoffordet al. 1995). Parameter estimates for the Tamura-Nei (TamuraandNei
1993) model with G-distributed rates for HVRI and HVRII Our estimates agree by and large with results from other sequences of human mtDNA. The number of substitutions is studies, even though direct comparison is complicated the expected numbers of the different substitution types, by the different parts of the HVR studied. Moreover, which were calculated from the Tamura-Nei (1993) rate
ma-assessing the significance of the differences to published trix as follows: The expected number of pyrimidine transitions
estimates is demanding, because this requires determi-equals 8ktpTpC/(t 11), the expected number of purine
tran-sitions equals 8kpApG/(t 1 1), and the expected number nation of the variances of our estimation procedure. of transversions equals 2(pA1 pG)(pT1 pC). The ratios of In principle, this could be done by one of the usual transition-transversion and pyrimidine-purine transition are
resampling techniques (EfronandTibshirani1993). given by 4k(tpCpT 1 pApG)/(t 1 1)(pA 1 pG)(pT 1 pC))
However, the amount of iterations necessary is computa-and tpCpT/(pApG), respectively. Our estimates of the base
tionally very expensive. Hasegawaand Horai(1991) frequencies for HVRI (in percentage):pA, 32.7;pC, 33.8;pG,
11.4;pT, 22.1. Our estimates for HVRII:pA, 29.6;pC, 28.9;pG, analyzed a smaller sample composed of three data sets
16.5;pT, 25.0. that cover different positions of the control region. They
estimated transition-transversion ratios between 14.5 and 27.0, depending on the data set. Other estimates ples of size 10 were too small, whereas, for samples of
of the transition-transversion ratio range from 12 to 37 size 20 and larger, estimates ofaare close to 0.26 and
(Horai and Hayasaka 1990; Hasegawa and Horai
0.13 in HVRI and HVRII, respectively. Table 1
summa-1991;KocherandWilson1991;Vigilantet al. 1991; rizes the averaged values for samples of size 80 and 150
Pesoleet al. 1992;TamuraandNei1993).Tamuraand repeats. The estimated transition-transversion
parame-Nei (1993) obtained by parsimony analysis transition-ter k in HVRI is approximately twice as high as the
transversion ratios of 18.8, 12.2, and 15.7 for HVRI, corresponding HVRII value. Accordingly, the estimate
HVRII, and both (HVRI 1 HVRII), respectively. Our of the pyrimidine-purine transition parameter tfrom
estimated ratios (Table 1) are slightly lower than HVRI is higher than the estimate of t from HVRII.
TamuraandNei’s (1993), even though it is known that The smaller value of the estimated rate-heterogeneity
estimates of substitution parameter using parsimony are parameterain HVRII indicates that the mutation rate
likely to be underestimates. It is possible that inTamura of this region is more heterogeneous than in HVRI.
andNei’s (1993) data set transversions are underrepre-Calculation of the expected number of substitutions
sented and thus the transition-transversion ratio is over-from the Tamura-Nei (1993) rate matrix reveals that
estimated. For example,Wardet al. (1991), who exam-the expected number of transversions is approximately
ined the transition-transversion ratio from a sample of the same for both HVRs. The two regions differ mainly
28 sequences of HVRI, found no transversions at all. in the number of pyrimidine transitions, leading to the
This fits well with our observation that the transition-higher pyrimidine-purine transition ratio and transition-higher
transversion parameter for HVRI decreases with increas-transition-transversion ratio in HVRI. The total number
ing sample size. Estimates of the rate heterogeneity pa-of substitutions is twice as high in HVRI as in HVRII
rameterahave been reported to be 0.11 for the entire (8.14:4.08). The parameter estimates in Table 1 provide
control region (Kocher and Wilson 1991; Tamura a comprehensive model of HVRI and HVRII evolution.
andNei1993) and 0.47 for HVRI (Wakeley1993). No On the basis of this model, we estimated site-specific
separate estimates ofaare published for HVRII, but it rates, summarized in Figure 2. As expected from the
is known that HVRII has a higher heterogeneity of rates estimate of rate heterogeneity in HVRII, sites evolve
than HVRI (Aris-Brosou andExcoffier 1996). Our either with a small relative rate or with a high rate. The
estimate of 0.26 for ain HVRI is substantially smaller fastest positions in HVRII evolve more than six times
differ-1107
Heterogeneity
in
Human
mtDNA
Figure2.—Estimated relative rates vs. sequence positions of HVRI and HVRII. Lengths of bars reflect the respective rates for each site; the average substitution rate is
1. Blue and green bars are at positions that have also been classified as fast byWakeley(1993) orHasegawaet al. (1993). Red bars mark positions that have been identified
as fast by both. Arrows indicate positions where substitutions were observed in family studies. Yellow,Parsonset al. (1997); orange,Howellet al. (1996). Locations of major
regulatory functions are given below the graph. SP, trinucleotide stop-point for the 39ends of the 7S DNA strands (16104–16106;Dodaet al. 1981); 7S DNA, location of
the 7S DNA (Dodaet al. 1981) that ranges from position 16106 to at least position 110 but not beyond position 440 (Changand Clayton 1985); TAS,
termination-associated sequence (16157–16172;Dodaet al. 1981); CE, possible control element (16194–16208; Ohnoet al. 1991); OH, origin of heavy strand replication (110–440;
ChangandClayton 1985); CSB I–III, conserved sequence blocks I–III (216–235, 299–315, 346–363; Walbergand Clayton1981); TFB, mitochondrial
1108 S. Meyer, G. Weiss and A. von Haeseler
TABLE 2 proportion of almost invariable sites, 54% in HVRI and 28% in HVRII, is considerably smaller than the Hase-HVRI positions with rate of$2
gawaandHorai(1991) estimate of 70%. From neutral theory (Kimura 1983), the existence of almost
invari-Rate Positions
able sites suggests that these sites are subject to func-2–3 16093, 16111, 16148, 16166, 16183, 16219, 16256w, tional constraints. Although the control region is
non-16261, 16274w, 16292, 16319w, 16320w, 16343,
coding, it is known to contain the main regulatory 16355wh
elements for transcription and replication. It is the bind-3–4 16163, 16172wh, 16187wh, 16230, 16293wh, 16309
ing site for numerous molecules such as DNA and RNA 4–5 16051, 16126h, 16129h, 16189wh, 16223wh,
16278wh, 16294wh, 16311wh, 16362wh polymerases and other transcription and regulatory fac-tors and thus may well be subjected to various evolution-All sequence positions of HVRI having a substitution rate
ary pressures (Sacconeet al. 1991). HVRII is probably
.2. w and h mark positions that were classified as fast by
the more important functional part of the control
re-Wakeley(1993) orHasegawaet al. (1993).
gion because it contains the origin of heavy strand repli-cation (positions 110–440;ChangandClayton1985). The major regulatory features of HVRII that lie within ent data set and the bias inherent in the
parsimony-based inference of rate heterogeneity (Wakeley1993). the region studied here are three conserved sequence blocks (CSBs) that have been suggested to serve as con-Up to now, estimates for site-specific rates have been
derived only for HVRI by counting the numbers of sub- trol sequences involved in the transition from primer RNA synthesis to DNA synthesis (Walbergand Clay-stitutions in a most parsimonious tree (Hasegawaet al.
1993; Wakeley 1993). Hasegawa et al. (1993) esti- ton1981), the RNase MRP cleaving site (RMC; Clay-ton1991), and two mitochondrial transcription-factor mated the rates from only 14 HVRI sequences, studying
the whole HVRI region, whereasWakeley(1993) esti- binding sites (TFB;Clayton1991). Looking at the rates of these regulatory elements, we see that the majority mated rates from positions 16130 to 16379 in 322
se-quences. Positions that experienced more than five sub- of the positions in the CSBs (216–235, 299–315, and 346–363) and the RMC (317–321) evolve much more stitutions were classified as fast. Table 2 lists positions
that are, according to our approach, at least twice as slowly than an average site of HVRII, with the exception of position 357 in CSBIII, which has a rate of 2.29. The fast as the average rate in HVRI. The higher our rate
estimate, the higher the concordance with positions that TFBs (233–260 and 276–303) show four sites (236, 247, 295, and 297) that evolve more than twice as fast as have been classified as fast by either Wakeley(1993)
and/orHasegawaet al. (1993). Eight of the nine posi- the average rate, while the rest of the positions show moderate variability (range, 0.0001–1.28). The finding tions with rates.4 are also fast evolving according to
the other studies. Both studies classified five positions that the mitochondrial transcription factor has flexible sequence specificity (Fisheret al. 1989) might explain as fast, for which we estimated moderate rates between 1
and 2 (16209, 16290, 16291, 16298, and 16304). Position the slightly higher average variability found in the TFBs 16234 has been classified as fast by Wakeley (1993)
andHasegawaet al. (1993), for which we found a rate
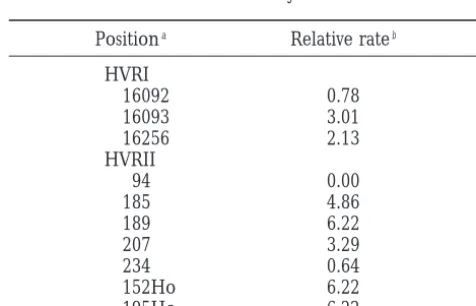
TABLE 3 close to 1. However, no position has been classified as
fast by either Wakeley (1993) or Hasegawa et al. Relative rates for positions where subsitutions were (1993), for which we found a relative rate of,1. observed in family studies
Our approach, however, detected quite a few
posi-Positiona Relative rateb
tions that are evolving moderately rapidly. The
devia-tions are due to the smaller data sets analyzed byWake- HVRI
ley(1993) andHasegawaet al. (1993). Moreover, they 16092 0.78
used different estimation methods. The parsimony 16093 3.01
method is known to be biased, because a parsimony 16256 2.13
HVRII reconstruction of the internal nodes of the tree gives
94 0.00
the minimum number of changes required at a site,
185 4.86
and the amount of rate heterogeneity therefore is
un-189 6.22
derestimated (Wakeley1993). Our results suggest that
207 3.29
maximum-likelihood methods in combination with the 234 0.64
subsampling strategy are an approach to detect rapidly 152Ho 6.22
evolving sites. Moreover, this approach has the advan- 195Ho 6.22
tage of rates estimated relative to the mean substitution a
Positions where substitutions were observed in the study rate. These rates are easier to interpret than actual num- ofParsonset al. (1997). Ho marks positions that have been bers of substitutions and furthermore simplify compari- observed as variable byHowellet al. (1996).
bThe relative rate estimate for the respective positions.
compared to the CSBs and the RMC. Positions 16104– mate substitution and demographic parameters simul-taneously by using a population genetics model. To this 16106 map the trinucleotide stop-point for the 39ends
of the 7S DNA strands (SP;Dodaet al. 1981). For these end, coalescence theory (Kingman1982a,b,c) provides an excellent tool to describe the ancestral relationship positions, as well as for a possible control element (CE;
Ohno et al. 1991; 16194–16208), most rates are close of a sample of sequences under various demographic scenarios (Donnelly and Tavare´ 1995). The muta-to 0. The termination-associated sequence TAS (Doda
et al. 1981; 16157–16172), which is a putative template tional process has been studied under demographic models of limited complexity (Lundstrom et al. stop signal for the elongation of the D-loop strands,
shows more variability than the functional regions men- 1992a,b). However, accurately modeling the dynamics of the worldwide population may result in an overly tioned above. This analysis provides the interesting
in-sight that functionally important regions do not neces- parameter-rich model. On the other hand, it seems worthwhile to put further effort into creating a more sarily have a small substitution rate.
Another question of interest is how well our site-spe- exact picture of the relative rates, as knowledge of the site-specific rates combined with the strength of the cific estimates correlate with positions that were variable
in pedigree analyses (Howell et al. 1996; Parsonset pedigree approach (Howellet al. 1996;Parsonset al. 1997) provides a powerful tool to unravel the absolute al. 1997). The rates for these 10 positions are given in
Table 3. Surprisingly, position 94 is invariant in our mutation rate in HVR. Our study is a step in this direc-tion, as relative rates for the HVR have been estimated collection of 969 HVRII sequences (Handtet al. 1998).
For positions 16092 and 234, the rates are,1. The 7 on the basis of a survey of a large amount of data. Our parameter estimates and rate estimates can be used to remaining positions show rates of.2. Among these are
3 positions with the highest rate of 6.22. Altogether our refine models of molecular structure and function as well as methods of phylogenetic inference. Thus, a bet-results suggest that the substitutions observed in family
studies occur preferentially but not exclusively at sites ter understanding of the forces and mechanisms that affect sequence evolution can be obtained and more with elevated rates. Even though diminishing the
dis-crepancy (Pa¨a¨bo1996;Jazinet al. 1998;Parsonsand sound conclusions about history of sequences and popu-lations can be drawn.
Holland1998) of rates estimated from family and
phy-logenetic studies, our observations do not fully explain We express our special thanks to Korbinian Strimmer, Roland Fleiß-thez20-fold higher rate of the latter. But one should ner, and Svante Pa¨a¨bo for stimulating discussions. We also thank Simon Tavare´ and two anonymous referees for helpful comments on
be aware that this time we exploited a method where
the manuscript. Financial support from the Deutsche
Forschungsge-rates are collected in eight categories. Thus the category
meinschaft is greatly appreciated.
representing the highest rate lumps together all sites that are extremely fast. That is to say, an upper limit for the relative rate at a position is introduced. Therefore, it
LITERATURE CITED is possible that the numerical values for some of the fast
positions are underestimated. The discreteG-approach Anderson, S., A. T. Bankier, B. G. Barell, M. H. L. de Bruijn, A. R. Coulsonet al., 1981 Sequence and organization of the human
(Yang 1993) yielded eight nonequidistant rates.
Espe-mitochondrial genome. Nature 290: 457–465.
cially small evolutionary rate factors are very close to Aquadro, C. F.,andB. D. Greenberg,1983 Human mitochondrial each other. Hence, for some site patterns the likelihood DNA variation and evolution: analysis of nucleotide sequences
from seven individuals. Genetics 103: 287–312.
values do not differ substantially between neighboring
Aris-Brosou, S.,andL. Excoffier,1996 The impact of population
categories. Because the final rate at a position is an expansion and mutation rate heterogeneity on DNA sequence average over many subsamples, possible inaccuracies in polymorphism. Mol. Biol. Evol. 13: 494–504.
Bertorelle, G.,andM. Slatkin,1995 The number of segregating
the rate assignment for a single subsample should have
sites in expanding human populations, with implications for
esti-no substantial effect. Certainly these problems could mates of demographic parameters. Mol. Biol. Evol. 12: 887–892. be circumvented if a continuous G-distribution were Cann, R., M. StonekingandA. C. Wilson, 1987 Mitochondrial
DNA and human evolution. Nature 325: 31–36.
applied. Unfortunately, this is at present
computation-Chang, D. D.,andD. A. Clayton,1985 Priming of human
mito-ally unfeasible. chondrial DNA replication occurs at the light-strand promotor.
In this article we used maximum-likelihood methods Proc. Natl. Acad. Sci. USA 82: 351–355.
Clayton, D. A.,1991 Nuclear gadgets in mitochondrial DNA
repli-to coestimate the parameters of the Tamura-Nei (1993)
cation and transcription. Trends Biol. Sci. 16: 107–111.
model including rate heterogeneity. By using a purely
Deng, H.,andY. Fu,1996 The effects of variable mutation rates
phylogenetic approach, we regarded the sequences as across sites on the phylogenetic estimation of effective population size or mutation rate of dna sequences. Genetics 144: 1271–1281.
an interspecies data set. Therefore, the analyses were
Doda, N. D., C. T. WrightandD. A. Clayton,1981 Elongation
based on a restricted set of sequences, where each
se-of displacement-loop strands in human and mouse mitochondrial
quence type of the data collection was represented only DNA is arrested near specific template sequences. Proc. Natl.
Acad. Sci. USA 10: 6116–6120.
once. This restriction may result in a loss of information
Donnelly, P.,andS. Tavare´,1995 Coalescents and genealogical
about the mutational process, because clearly the
hu-structure under neutrality. Annu. Rev. Genet. 29: 401–421.
esti-1110 S. Meyer, G. Weiss and A. von Haeseler
Fisher, R. P., M. A. Paraisi andD. A. Clayton, 1989 Flexible Parsons, T.,andM. M. Holland,1998 Response to: Mitochondrial mutation rate revisited: hot spots and polymorphism. Nat. Genet. recognition of rapidly evolving promotor sequences by
mitochon-18:110–110. drial transcription factor 1. Genes Dev. 3: 2202–2217.
Parsons, T. J., D. S. Muniec, K. Sullivan, N. Woodyatt, R. Allis-Garner, K. J.,andO. A. Ryder,1996 Mitochondrial DNA diversity
ton-Greineret al., 1997 A high observed substitution rate in in gorillas. Mol. Phyol. Evol. 6: 39–48.
the human mitochondrial DNA control region. Nat. Genet. 15:
Goldberg, T.,andM. Ruvolo,1997 The geographic
apportion-363–367. ment of the mitochondrial genetic diversity in east African
chim-Pesole, G., E. Sbisa, G. Preparataand C. Saccone,1992 The panzees, Pan Troglodytes schweinfurthii. Mol. Biol. Evol. 14: 976–
evolution of the mitochondrial D-loop region and the origin of 984.
modern man. Mol. Biol. Evol. 9: 587–598.
Goldmann, N.,1993 Statistical tests of models of DNA substitution.
Saccone, C., G. Pesole andE. Sbisa´, 1991 The main regulatory J. Mol. Evol. 36: 182–198.
region of mammalian mitochondrial DNA: structure-function
Handt, O., S. MeyerandA. von Haeseler,1998 Compilation of
model and evolutionary pattern. J. Mol. Evol. 33: 83–91. human mtDNA control region sequences. Nucleic Acids Res. 26:
Stoneking, M., S. T. Sherry, A. J. ReddandL. Vigilant,1992 New 126–129.
approaches to dating suggest a recent age for the human mtDNA
Hasegawa, M.,andS. Horai,1991 Time of the deepest root for
ancestor. Philos. Trans. R. Soc. Lond. 337: 167–175. polymorphism in human mitochondrial DNA. J. Mol. Evol. 32:
Strimmer, K.,andA. von Haeseler,1996 Quartet puzzling: a quar-37–42.
tet maximum likelihood method for reconstructing tree
topolo-Hasegawa, M., A. D. Rienzo, T. KocherandA. Wilson,1993
To-gies. Mol. Biol. Evol. 13: 964–969. ward a more accurate time scale for the human mitochondrial
Swofford, D. L., G. J. Olsen, P. J. WaddellandD. M. Hillis,1995 DNA tree. J. Mol. Evol. 37: 347–354.
Accommodating rate heterogeneity among sites, pp. 442–445 in
Horai, S.,andK. Hayasaka,1990 Intraspecific nucleotide sequence
Molecular Systematics, edited byD. M. Hillis, C. MoritzandB. K.
differences in the major noncoding region of human
mitochon-Mable.Sinauer, Sunderland, MA. drial DNA. Am. J. Hum. Genet. 46: 828–842.
Tajima, F.,1996 The amount of DNA polymorphism maintained in
Howell, N., I. KubackaandD. A. Mackey,1996 How rapidly does a finite population when the neutral mutation rate varies among the human genome evolve? Am. J. Hum. Genet. 59: 501–509. sites. Genetics 143: 1457–1465.
Jazin, E., H. Soodyall, P. Jalonen, E. Lindholm, M. Stonekinget Tamura, K.,andM. Nei,1993 Estimation of the number of nucleo-al., 1998 Mitochondrial mutation rate revisited: hot spots and tide substitutions in the control region of mitochondrial DNA polymorphism. Nat. Genet. 18: 109–110. in humans and chimpanzees. Mol. Biol. Evol. 10: 512–526.
Kimura, M.,1983 The Neutral Theory of Molecular Evolution. Cam- Uzzel, T.,andK. W. Corbin,1971 Fitting discrete probability
distri-bridge University Press, London. butions to evolutionary events. Science 172: 1089–1096.
Kingman, J. F. C., 1982a The coalescent. Stoch. Proc. Appl. 13: Vigilant, L., M. Stoneking, H. Harpending, K. HawkesandA. C.
235–248. Wilson,1991 African populations and the evolution of
mito-Kingman, J. F. C.,1982b On the genealogy of large populations. J. chondrial DNA. Science 253: 1503–1507.
Appl. Prob. 19A: 27–43. Wakeley, J.,1993 Substitution rate variation among sites in
hyper-Kingman, J. F. C.,1982c Exchangeability and the evolution of large variable region 1 of human mitochondrial DNA. J. Mol. Evol. 37: populations, pp. 97–112 in Exchangeability in Probability and Statis- 613–623.
tics, edited byG. KochandF. Spizzichino.North-Holland Pub- Wakeley, J.,1994 Substitution rate variation among sites and the estimation of transition bias. Mol. Biol. Evol. 11: 436–442. lishing Company, Amsterdam.
Wakeley, J.,1996 The excess of transitions among nucleotide
substi-Kocher, T. D.,andA. C. Wilson,1991 Sequence evolution of
mito-tutions: new methods of estimating transition bias underscore its chondrial DNA in humans and chimpanzees: control region and
significance. TREE 11: 158–163. protein-coding regions, pp. 391–413 in Evolution of Life: Fossils,
Walberg, M. W.,andD. A. Clayton,1981 Sequence and properties
Molecules and Culture, edited byS. OsawaandT. Honio.Springer
of the human KB cell and mouse L cell D-loop regions of mito-Verlag, Tokyo.
chondrial DNA. Nucleic Acids Res. 9: 5411–5421.
Krings, M., A. Stone, R. W. Schmitz, H. Krainitzky, M. Stoneking
Ward, R. H., B. L. Frazier, K. Dew-JagerandS. Pa¨a¨bo,1991
Exten-et al., 1997 Neanderthal DNA sequences and the origin of
mod-sive mitochondrial diversity within a single Amerindian tribe. ern humans. Cell 90: 19–30.
Proc. Natl. Acad. Sci. USA 88: 8720–8724.
Lundstrom, R., S. Tavare´andR. H. Ward,1992a Modelling the
Ward, R. H., A. Redd, D. Valencia, B. FrazierandS. Pa¨a¨bo,1993 evolution of the human mitochondrial genome. Math. Biosci.
Genetic and linguistic differentiation in the Americas. Proc. Natl. 112:319–335.
Acad. Sci. USA 90: 10663–10667.
Lundstrom, R., S. Tavare´andR. H. Ward,1992b Estimating
substi-Watson, E., K. Bauer, R. Aman, G. Weiss, A. von Haeseleret al.,
tution rates from molecular data using the coalescent. Proc. Natl.
1996 mtDNA sequence diversity in Africa. Am. J. Hum. Genet. Acad. Sci. USA 89: 5961–5965.
59:437–444.
Misawa, K.,andF. Tajima,1997 Estimation of the amount of dna Weiss, G., andA. von Haeseler, 1998 Inference of population polymorphism when the neutral mutation rate varies among sites. history using a likelihood approach. Genetics 149: 1539–1546.
Genetics 147: 1959–1964. Yang, Z.,1993 Maximum likelihood estimation of phylogeny from
Ohno, K., M. Tanaka, H. Suzuki, T. Ohbayashi, S. I. Ikebaet al., DNA sequences when substitution rates differ over sites. Mol.
1991 Identification of a possible control element, mt5, in the Biol. Evol. 10: 1396–1401.
major noncoding region of mitochondrial DNA by intraspecific Yang, Z.,1996 Among-site rate variation and its impact on phyloge-nucleotide conservation. Biochem. Int. 24: 263–272. netic analyses. TREE 11: 367–372.
Pa¨a¨bo, S.,1996 Mutational hot spots in the mitochondrial