Average Number of Nucleotide Differences in
a
Subpopulation:
A
Test for Population
Sample From
Subdivision
a Single
Curtis Strobeck
Department of Zoology, University of Alberta, Edmonton, Alberta, Canada T6G 2E9 Manuscript received November 24, 1986
Revised copy accepted May 20, 1987
ABSTRACT
Unbiased estimates of 8 = ~ N H in a random mating population can be based on either the number of alleles or the average number of nucleotide differences in a sample. However, if there is population structure and the sample is drawn from a single subpopulation, these two estimates of 8 behave differently. The expected number of alleles in a sample is an increasing function of the migration rates, whereas the expected average number of nucleotide differences is shown to be independent of
the migration rates and equal to 4 N ~ p for a general model of population structure which includes both the island model and the circular stepping-stone model. This contrast in the behavior of these two estimates of 8 is used as the basis of a test for population subdivision. Using a Monte-Carlo simulation developed so that independent samples from a single subpopulation could be obtained quickly, this test is shown to be a useful method to determine if there is population subdivision.
F the
D N A
sequences are known for several copiesI
of a gene sampled from a randomly mating pop- dation, there are two ways to estimate 8 = 4Np, whereN is the population size and p is the mutation rate. EWENS (1972) showed that the maximum likelihood estimate of 8 assuming the infinite alleles model (KI-
MURA and CROW 1964) is a function of only the number of alleles in the sample and not the frequen- cies of the alleles. O n the other hand, if the infinite sites model (KIMURA 1969) is assumed, then 8 can be estimated from the number of segregating sites (WAT-
TERSON 1975) or less efficiently from the average
number of nucleotide differences between copies of the gene (TAJIMA 1983). If there is random mating and nn intragenic recombination then both are un- biased estimates of 8. However, if either of these assumptions is not true, then these two methods may estimate different values. For example, intragenic re- combination is expected to increase the number of alleles in a sample but not affect the number of seg- regating sites or the average number of nucleotide differences (WATTERSON 1975; STROBECK and MOR-
GAN 1978; STROBECK and GOLDING 1983; HUDSON
198313).
In this paper it is shown that for a general model of population structure, the expected number of nucleo- tide differences between two genes which are ran- domly chosen from a single subpopulation is inde- pendent of the migration rates between subpopula- tions and equal to 4NTp where NT is the total number of individuals in the population. This model includes the island model of WRIGHT (1931) and the circular stepping-stone model (MARUYAMA 1970). In contrast, Genetics 117: 149-153 (September, 1987)
the distribution of the number of alleles in a sample from a single subpopulation is approximately the dis- tribution of alleles in a panmictic population with a 8’
which is an increasing function of the migration rates
(G. B. GOLDING, personal communication). For ex- ample, for the island model it has approximately the same sampling distribution as a panmictic population with a 8’ = 8
+
M ( n-
1)8/((n-
l)8+
M ) where n is the number of islands and M = 4Nm (SLATKIN 1982;GOLDING and STROBECK 1983). Thus it may be pos- sible to determine if a population is panmictic or structured by comparing the observed number of alleles with that expected from the estimate of 8 based on the average number of nucleotide differences be- tween the copies of the genes in the sample. Lastly, the power of this test to detect population subdivision is investigated using Monte-Carlo simulation to obtain independent samples from a population known to be
subdivided.
EXPECTED NUMBER OF NUCLEOTIDE
DIFFERENCES
In this section the expected number of nucleotide differences between two randomly chosen
D N A
se- quences is derived for three models of population structure; the island model (WRIGHT 193 l ) , the cir- cular stepping-stone model (MARUYAMA 1970) and a general conservative migration model. Unless other- wise stated, it is assumed throughout this section that the population consists of n subpopulations each withIn the island model the migration rate from one subpopulation to any of the other n
-
1 subpopula- tions is m / n-
l ( m=
O ( l / N ) ) . T h e recurrence equa- tions for the expected number of nucleotide differ- ences between two randomly chosen DNA sequences from the same subpopulation,&,,
and from two differ- ent subpopulations, [ q , areneglecting terms of O( 1 / N 2 ) or less. T h e first term on the righthand side of ( l a ) is the probability that the two sequences came from two distinct sequences in the previous generation, no new mutants occurred, and neither were migrants times the expected number of nucleotide differences. T h e second term is the probability that there was a mutation in one of the two sequences times the expected number of nucleo- tide differences plus one (because of the new muta- tion). T h e third term is the probability that one of the two sequences is a migrant times the expected number of nucleotide differences when the two sequences come from different subpopulations. The terms con- taining the probabilities that there were two muta- tions, one sequence was a migrant and there was a mutation, etc. have been neglected. Equation l b is derived in a similar fashion. T h e equations for the expected values of the stationary distributions for the number of nucleotide differences are therefore
( 2 b ) 4 N m A 4Nm
n - 1 &I
+
n - 1-
i,
= 4NP--
and the solution to these equations is
These results were first obtained by LI (1976) using generating functions.
In the circular stepping-stone model, the subpopu- lations are arranged in a circle with migration only between adjacent subpopulations. The migration rate from a subpopulation to each of the two adjacent subpopulations is m / 2 . As the number of subpopula- tions goes to infinity, the circular stepping-stone model converges to the stepping-stone model of Kr-
MURA and WEIS (1 964). T h e recurrence equations for the expected number of nucleotide differences when
the two sequences come from two subpopulations which are
i
steps apart,&,
are+
2m&-, if n = 2 k[L
= (1-
2P-
2m)& + 2 p ( 6+
+
m&,+
m&-, if n = 2k+
1.Thus the equations for the expected values of the stationary distribution for the number of nucleotide differences are
(1
+
4Nm)to-
4Nm& = 4 N p ( 5 4A A * .
&+I
-
2&+
ti-,
= -2m
f o r i = 1 , ..e, R - 1
P
112
1 1
&
-
&-I = 2 - if n = 2k+
1.The general solution to the inhomogeneous Equation 5b is
T h e constants C1 and CO are determined by substitut- ing (6) into (5c) and then into (5a). T h e complete solution for the expected number of nucleotide dif- ferences is
El
= n 4 ~ p+
-
CL i(n-
i> for i = 0 , . . . , k . (7)m
For both the island model and the circular stepping- stone model, the expected number of nucleotide dif- ferences when both sequences are drawn randomly from the same subpopulation is independent of the migration rate and equal to n 4 N ~ . This is the expected number of nucleotide differences if the total popula- tion, n N , were panmictic. This result also holds for any isotropic conservative migration model. Both the island model and the circular stepping-stone model are isotropic conservative migration models.
subpopulation the number of individuals migrating into the subpopulation is equal to the number of individuals migrating out of the subpopulation, i.e.,
N I m, = N l ( l - mtz) =
2
m,,N,,*I
or
0 =
x
mjiNj - N i .I
This implies that q(M
-
I ) = 0 where 77 = ( N I , N2,.
, N , ) is the row vector of the population sizes, M = (me) is the nXn migration matrix, and I = diag(1) is the n x n identity matrix. If all the Ni are of the same order of magnitude and the mi, fori
# j are of the order of l / N j then the recurrence equations forEii
andEq
areneglecting terms of O( 1 / N ? ) or less. Therefore the equations for the expected values of the stationary distributions of the number of nucleotide differences are
( X m i k k#i -k k+l m,k)iy
-
k#i1
midjk(9b)
- 2
m , & , = 2 p fori,
j = 1, -.e , n .k+J
Since
summarized as the matrix equation
m, = 1
-
mzl, these n2 equations can beD
-
( M-
I)(-
[ ( M T-
I)
= 2pU (10) where D = diag(ill/2Nl), E; = (&), and U = (1) is the nXn matrix consisting of all ones.Multiplying (10) by 2.11 = ( 2 N 1 , 2 N 2 ,
...
, 2N,) on the left and 2$ on the right, one obtainsI
where
NT
=xi
N I is the total population size. Thus the average of theill,
tZ2
= 2 N l i l l / 2 N ~ = ~ N T Pand is independent of the migration rates. If the migration model is isotropic, i . e . , the pattern of mi- gration for each subpopulation is identical to the migration pattern of any other subpopulation and N I = N for all
i,
then-
l
=
ct
= n 4 N p .Formally, the migration model is isotopic if for any
i
and j there exists a permutation such that i goes t o j and mkl = mkrlp where k goes to k ’ and E goes to 1’.
Both the island model and the circular stepping-stone model satisfies this condition. During the preparation of this paper, it was learned that SLATKIN (1987) has obtained similar results for the symmetric migration model.
TEST FOR POPULATION SUBDIVISION
As shown in the previous section, the expected number of nucleotide differences between two DNA
sequences from the same subpopulation is independ- ent of the migrations rates and equal to n 4 N p for a number of models of population structure, including the island model. However, for the island model it has been shown that the number of alleles in a sample from a single subpopulation has a EWEN’S distribution with a modified value of 0, 8’ = O
+
M ( ( n-
l ) O / [ ( n-
1)O
+
M I } where O = 4 N p and M = 4Nm (SLATKIN1982; GOLDINC and STROBECK 1983). As
M
goes from zero, i . e . , the subpopulations are completely isolated, to infinity, i . e . , the population is panmictic, 0’ goes from O to nO. Thus, if a population is effectively subdivided, the number of alleles in a sample from a single subpopulation should be much less than predi- cated using the O estimated from the average number of nucleotide differences found in the sample.This suggests the following test for population sub- division when the DNA sequences are known for s copies of a gene from a single population. First cal- culate the average number of nucleotide differences for the s(s
-
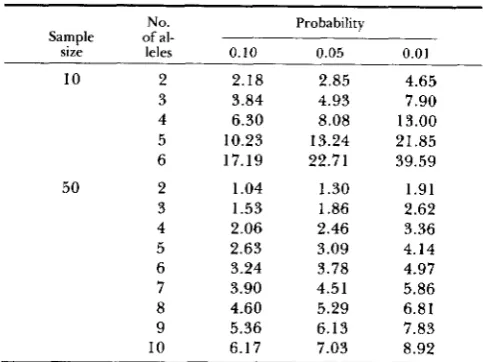
1)/2 pairs of genes. This is an unbiased estimate of t9 if the population were panmictic (TAJIMA1983). Then use this estimate of O to calculate the distribution for the number of alleles found in a sample of size s (EWENS 1 9 7 2 ) . If the probability of obtaining a sample with less than or equal to the number of alleles which were observed in the sample is less than a given value a, the null hypothesis that the population is panmictic is rejected at the a X
TABLE 1
Values which 0 = must exceed before the probability of
observing a given number of alleles in a sample of size 10 or 50 is less than 0.10, 0.05 or 0.01
No. Probability Sample of al-
size leles 0.10 0.05 0.01
10 2 2.18 2.85 4.65 3 3.84 4.93 7.90 4 6.30 8.08 13.00 5 10.23 13.24 21.85 6 17.19 22.71 39.59 50 2 1.04 1.30 1.91 3 1.53 1.86 2.62 4 2.06 2.46 3.36
5 2.63 3.09 4.14 6 3.24 3.78 4.97 7 3.90 4.51 5.86 8 4.60 5.29 6.81 9 5.36 6.13 7.83 10 6.17 7.03 8.92
a given number of alleles is less than a (a = 0.10, 0.05 and 0.01) are listed for sample sizes of s = 10 and 50.
Two questions about this test come quickly to mind: “What is the power of this test to detect population subdivision if it exists?” and “Since the number of alleles and the average number of nucleotide differ- ences are positively correlated, what is the true value of rejection of the null hypothesis?” Information about both of these questions can be obtained using Monte- Carlo simulation to obtain independent samples from populations with known structure, subpopulation size, migration rates, and mutation rate. A modification of the simulation method used by HUDSON (1983a) (see also TAJIMA 1983) provides an easy method to obtain independent sample for any given population struc- ture.
To obtain independent samples from a panmictic population of size N, HUDSON first constructs the phylogenetic tree of the sample and determines the time associated with each branch of the tree and then determines the number of mutations that occur along each branch. T h e phylogenetic tree and the associated times are constructed recursively. T h e probability that k copies of a gene in one generation are derived from k
-
1 copies of the gene in the previous generation is k(k-
1)/4N plus terms of O(l/N2). T h e probability that the k copies come from k copies in the previous generation is 1-
k(k - 1)/4N plus terms of O(1/N2). Therefore, the time, t, measured in 4N generations for k copies of a gene to have come from k-
1 copies is exponentially distributed, i . e . ,fit) = k(k
-
l)e-@-’]*.The cumulative distribution is F(t) = 1
-
e-Kk-’)‘Therefore a value o f t can be obtained by choosing x
from a uniform distribution on (0, 1) and setting
-1 k(k
-
1)t = log(1 - x).
The two copies of the gene that came a single copy in the previous generation are chosen randomly. T h e number of mutations along a branch with an associ- ated time T, measured in 4N generations is Poisson distributed with mean X = OT = 4NpT.
T o extend this method to the island model with islands, each island with a population size of N, and a migration rate m per gene per generation, it is only necessary to note that the probability that all k copies of a gene on an island one generation were all on the island the previous generation is 1
- mk
and the probability that one copy was an immigrant is mk. Therefore the time, measured in 4N generations, till one of the copies was an immigrant is exponentially distributedg(t,) = kM e-kMt*,
where M = 4”. Therefore a value of t, can be obtained by choosing x from a uniform distribution o n (0, 1) and setting
-1 kM
t, =
-
log(1-
x).To construct the phylogenetic tree of a sample to- gether with the associated time for each branch, it is necessary to obtain a value of t for each island that contains two or more copies of the gene (the distri- bution of t depends on the number of copies on each of the islands) and a value of t, for each island that contains at least one copy of the gene. If the minimum value of all of these values is a t value, then on that island two genes are randomly selected and replaced by a single copy of the gene. If the minimum value is a t, value, then on that island one copy of the gene is chosen to have been the immigrant and one island is chosen from which it had emigrated. A new set of t and t, values are chosen and the process repeated until only one copy of the gene remains. At this time the number of mutations along each branch of the phylogenetic tree is determined as before.
For the purpose of answering the question on the power of the proposed test, the number of islands was assumed to be n = 8; the sample size, s = 10 or 50; O
TABLE 2
Percentage of samples from a single subpopulation for which the null hypothesis of random mating was rejected when the
island model was assumed
TABLE 3
Percentage of samples from a population for which the null hypothesis of random mating was rejected when random mating
was assumed
Sample
size 4Nm
Level of significance (70)
10 5 1
10 0.125 0.250 0.500 1
.ooo
2.000 50 0.125 0.250 0.5001
.ooo
2.000
15 13 33 29 33 25 33 23 22 10 35 31 34 33 49 45 56 50 49 44
11 19 13 9 4 24 25 35 39 21 A hundred independent samples were obtained for each set of parameters. It was assumed that the number of islands was n = 8; 0
= 4Np = 0.5; 4Nm = 0.125, 0.250, 0.500, 1.000 or 2.00; and the sample size s = 10 or 50.
dation becomes completely isolated, whereas if M
becomes large, the whole population behaves as if it were panmictic.
T o answer the question of how conservative the proposed test is, 1000 independent samples were ob- tained for 8 = 0.50, 1.00 and 2.00 and s = 10 and 50. T h e results are shown in Table 3. T h e test is very conservative with s = 10, i.e., only 0.6 to 1.4% are rejected at the 10% level. With s = 50 the test is much less conservative, i.e., from 1.7 to 7.1% are rejected at the 10% level. It should be noted, however, that the test does not behave properly for 8 = 2.0 at the 1% level, i.e.,
2.2%
is rejected. This is not just a stochastic error since another run of 1000 independ- ent samples had approximately the same results. It seems to occur because although the probability of two, three, or four alleles in a sample is small with a high mutation rate, when such a sample does occur the average number of nucleotide differences in the sample is large and therefore more likely to be signif- icant. For example, in the simulation with 8 = 2.0 and s = 50, there were 115 samples with two, three or four alleles of which 25, 21 and 9 were significant at the 10, 5 and 1% level, respectively. On the other- hand, there were 128 samples with ten or more alleles of which only one was significant (at the 5% level).T o summarize, the Monte-Carlo simulations show that population structure can be detected by compar- ing the observed number of alleles in a sample to that expected when 8 = 4Np is estimated from the average number of nucleotide differences. However, it is a very conservative test for small sample sizes and it is not a proper statistical test if 8 is large. It may be possible to overcome these problems by developing a test based on the joint distribution of the number of
Level of significance (%)
size 4NP 10 5 1
10 0.5 0.6 0.1 0.0
1 .O 1.2 0.7 0.1 2.0 1.4 0.5 0.0 50 0.5 1.7 0.6 0.2 1
.o
5.8 3.3 0.8 2.0 7.1 5.2 2.2Sample
A thousand independent samples were obtained for each set of parameters. It was assumed that 0 = 4Np = 0.5, 1.0 or 2.0 and the sample size s = 10 or 50.
alleles and the average number of nucleotide differ- ences in a sample.
LITERATURE C I T E D
EWENS, W. J., 1972
GOLDING, G. B. and C. STROBECK, 1983
The sampling theory of selectively neutral alleles. Theor. Popul. Biol. 3: 87-1 12.
Variance and covariance of homozygosity in a structured population. Genetics 104: 533- 545.
HUDSON, R. R., 1983a Testing the constant-rate neutral allele model with protein sequence data. Evolution 37: 203-217. HUDSON, R. R., 1983b Properties of a neutral model with intra-
genic recombination. Theor. Popul. Biol. 23: 183-201. KIMURA, M., 1969 The number of heterozygous nucleotide sites
maintained in a finite population due to steady flux of muta- tions. Genetics 61: 893-903.
The number of alleles that can be maintained in a finite population. Genetics 4 9 725-738.
The stepping stone model of population structure and the decrease of genetic correlation with distance. Genetics 49: 561-576.
Distribution of nucleotide differences between two randomly chosen cistrons in a subdivided population: the finite island model. Theor. Popul. Biol. 10: 303-308.
Analysis of population structure. I. One dimensional stepping-stone models of finite length. Ann. Hum. Genet. 34: 201-219.
SLATKIN, M., 1982 Testing neutrality in a subdivided population. Genetics 100: 533-545.
SLATKIN, M., 1987 The average number of sites separating DNA sequences drawn from a subdivided population. Theor. Popul. Biol. In press.
The variance of linkage disequilibrium between three loci in a finite population. Can.
J. Genet. Cytol. 25: 139-145.
STROBECK, C. and K. MORGAN, 1978 The effect of intragenic recombination on the number of alleles in a finite population. Genetics 88: 829-844.
Evolutionary relationship of DNA sequences in finite populations. Genetics 105 437-460.
On the number of segregating sites in genetical models without recombination. Theor. Popul. Biol.
Evolution in Mendelian populations. Genetics
Communicating editor: W.-H. LI KIMURA, M. and J. F. CROW, 1964
KIMURA, M. and G. H. WEISS, 1964
LI, W.-H., 1976
MARUYAMA, T., 1970
STROBECK, C. and G. B. GOLDING, 1983
TAJIMA, F., 1983
WATTERSON, G. A., 1975
7: 256-276. WRIGHT, S., 193 1