ABSTRACT
KOROLOFF, SOPHIE NATACHA. Sensitivity Enhancement and Spectral Editing for Solid-State NMR of Oriented Membrane Proteins. (Under the direction of Dr. Alexander
Nevzorov).
Solid-state Nuclear Magnetic Resonance (ssNMR) of oriented membrane proteins
(MPs) in lipid bilayers is capable of providing structural and dynamic information at nearly
physiological conditions. However, utilization of high-power radiofrequency (rf) irradiation
for purposes of magnetization transfer and/or proton decoupling may give rise to sample
heating and its subsequent degradation. Here we have employed and optimized the Repetitive
Cross-Polarization (REP-CP) sequence to study the magnetization transfer efficiency at low rf
powers, and compared its performance with single-contact Hartmann-Hahn Cross-Polarization
(CP) and adiabatic transfer (ad-CP). It has been found that employing the REP-CP sequence
at 19 kHz instead of the commonly used 50 kHz can enhance the 15N signal detection by nearly
30% as compared to the already published REP-CP and 60% as compared to the widely used
CP-MOIST sequence. It was determined that low-power REP-CP sequence surpasses all of the
previous CP schemes in polarization transfer efficiency in addition of having the tremendous
advantage of decreasing the rf powers by a factor of seven, therefore preserving the biological
sample. Furthermore, Paramagnetic Relaxation Enhancement (PRE) effects by adding a free
radical into the bicelle sample allowed for a dramatic three-fold signal enhancement when
coupled to the low-power REP-CP at 19 kHz. We have also addressed the problem of spectral
crowding in assigning NMR spectra of oriented membrane proteins. Resolving
multidimensional spectra is challenging for large membrane proteins as the main NMR peaks
and their cross correlations often overlap, thus making the assignment task almost impossible.
magnetization transfer only to the nearby residues in a polypeptide chain, thus establishing a ‘seed step’ for its spectroscopic assignment. We have demonstrated the method on a
N-acetyl-leucine single crystal, and subsequently applied it to Pf1 coat protein reconstituted in
magnetically aligned bicelles. Addressing two of the most critical problems in ssNMR of
oriented MPs such as low sensitivity and spectral crowdedness, paves way to new
© Copyright 2016 Sophie Koroloff
Sensitivity Enhancement and Spectral Editing for Solid-State NMR of Oriented Membrane Proteins
by
Sophie Natacha Koroloff
A dissertation submitted to the Graduate Faculty of North Carolina State University
in partial fulfillment of the requirements for the degree of
Doctor of Philosophy
Chemistry
Raleigh, North Carolina
2016
APPROVED BY:
_______________________________ _______________________________
Dr. Alexander A. Nevzorov Dr. David A. Shultz
Committee Chair
_______________________________ _______________________________
ii
DEDICATION
I dedicate this work to my parents, Odile and Claude, who have let me follow my
dreams when those took me far away from home. To you, mom, the strongest woman I know.
Thank you for setting the best example for me to follow. To you, dad, I hope you are proud
and peaceful wherever you are.
~·~·~·~·~·~·~·
Je dédie ce travail à mes parents, Odile et Claude, qui m’ont laissé poursuivre mes rêves
quand ces derniers m’ont emmené loin de chez eux. À toi, maman, la femme la plus forte que je connaisse. Merci de m’avoir donné le meilleur exemple à suivre. À toi, papa, j’espère que
iii
BIOGRAPHY
The author, Sophie Koroloff, was born on November 10th, 1987 in Lyon, France. After
studying the violin for 12 years and getting her Music Theory degree in 2002 from the
Conservatoire de Lyon, she became fascinated by Science in high-school. After two years of
preparatory program for engineering school, she was admitted at CPE Lyon (Chemistry,
Physics and Electronics engineering school) where she studied Chemical Engineering and got
her B.S. degree in 2008. In 2009-2010, she did a one-year internship at SCYNEXIS, Inc.
located in the Research Triangle Park in Durham, NC, USA, in the analytical support group
under the supervision of Dr. Darryl LeBlanc, where she worked on structure elucidation by
liquid-state Nuclear Magnetic Resonance (NMR) of a hundred of small and medium sized
pharmaceutical compounds during the earliest step of development. She graduated from CPE
Lyon with a M.S. degree in Chemical Engineering and Formulation in 2011 and did a
six-month internship in one of the most renowned NMR research laboratory in which the
highest-field NMR spectrometer was at that time (1 GHz), the CRMN in Lyon (European center for
high field NMR) under the supervision of Prof. Lyndon Emsley, Dr. Meghan Halse and Dr.
Maria Baias. Her projects consisted in i) improving the identification of good decoupling pulse
sequences in solid-state NMR (ssNMR) under Magic Angle Spinning and ii) decreasing the
experimental time by using doping agents. Sophie started her graduate studies in the
department of Chemistry at North Carolina State University in 2011 under the guidance of Dr.
Alexander Nevzorov and her research focused on developing pulse sequences to facilitate the
study of oriented membrane proteins in ssNMR. After her dad passed away in September 2013,
she lost a little focus and took a couple more semesters to complete her Ph.D. She received the
iv
research award in the area of Bioanalytical, Biophysical and Chemical Education for a poster
presentation at the 15th Annual Department of Chemistry Poster Session in 2014. She was
nominated twice for an Outstanding Teaching Assistant Award across the entire NC State
University in 2011 and 2013. She was also awarded a handful of travel grants to attend
prestigious NMR conferences (ENC, SEMRC, ICMRBS…) in California, Alabama, Vermont
and even France. Finally, she received an inaugural Chemistry Scholars Graduate Research
v
ACKNOWLEDGMENTS
First, I would like to express my sincere gratitude to my advisor, Professor Nevzorov,
who have given me enough freedom during my graduate studies to allow me to pursue the
projects I was the most passionate about. His understanding during a couple of rough times I
went through made this adventure more bearable. I would also like to thank Dr. David Shultz,
Dr. Alex Smirnov and Dr. Jerry Whitten who accepted to serve in my committee. A special
thanks to Dr. Whitten for giving me the opportunity to give a lecture on Quantum Physics
related to the NMR field during a class. It reinforced my will to help students and maybe teach.
I would like to deeply thank Dr. Darryl LeBlanc for being the most wonderful mentor.
I fell in love with NMR thanks to his eagerness to patiently explain difficult NMR concepts. I
would also like to thank Jack Thornquest for always being helpful and fun to be around. I also
thank Meghan and Maria at the CRMN who reinforced my love for NMR.
I could not have go through my Ph.D. “that easily” without my two best friends. Lamya,
your unconditional support through our endless skype sessions comforted me so much,
especially during the writing of this thesis. Nédia, our many phone calls and texts to share our “parallel” life and to cheer me up gave me the strength to go through all this.
I would like to thank few people who have been part of my life at some point during
my Ph.D. and who have helped me grow to be a better person. Amol, thanks for teaching me
about life, happiness and trust. Thanks to Deanna and Kira, for allowing me to rebound in life
when I needed support. Helen, Melissa, Jordan, and Margaux: thank you for being great
roommates and friends! I would also like to thank my new friends from BB who are always up
vi
A very special thanks to Dr. Erica Vogel, who made working in lab more enjoyable.
Also, thanks to you and Paul for taking care of my ‘annoying’ cat during my redaction. Getting
enough sleep was priceless!
I would like to thank my family, especially my mom for always being understanding,
and my sister, Julie, who I have never been so close to than since I moved to the US.
I want to thank a thousand times my new family, Lina and Jake, for opening their arms
and home to me and making me feel part of their family. You cured my home-sickness by
welcoming me so warmly into your life.
Last, but definitely not least in my heart, the sweetest thanks to Luis, for always being
supportive and patient, especially toward the end of this Ph.D. You brought a smile on my face
whenever I was feeling down, you encouraged me whenever I doubted my capabilities, and
you helped me take my mind away whenever I was going nuts. I am grateful to have you by
vii
TABLE OF CONTENTS
LIST OF TABLES………..………..…………xi
LIST OF FIGURES………..………...….xii
LIST OF DIAGRAMS………...…....…xvii
LIST OF ABBREVIATIONS………...…....xviii
LIST OF SYMBOLS………..…..…..xxi
CHAPITRE I: INTRODUCTION………..……1
1.1. MEMBRANE PROTEINS………...………..….1
1.1.1. Significance and challenges………..………1
1.1.2. Methodology for MPs structure determination………...……3
1.1.3. Identification of the problem………...…..…...…… 4
1.1.4. Goals and systems of interest………..….…… 5
1.2. SOLID-STATE NMR: PRINCIPLES AND METHODS………7
1.2.1. Hamiltonian and density matrix evolution……….…….. 7
1.2.2. One-dimensional pulse sequence for detection of the low-gamma spins……… 8
1.2.2.1. Hartmann-Hahn cross-polarization……….…8
1.2.2.2. Spin temperature hypothesis……….……….……...9
1.2.3. Two-dimensional pulse sequences for structure determination…...……..……11
1.2.3.1. Separated local field sequences……….……….11
1.2.3.2. Magnetization transfer for cross correlations………..…...12
1.2.3.3. Methodology for structure determination and spectroscopic assignment………. 14
1.3. SUMMARY OF RESEARCH AND OBJECTIVES………...………...… 16
REFERENCES……...……….……….………..………. 18
APPENDICES Appendix 1-A: Expression and purification of Pf1 coat protein……….. 23
Appendix 1-B: NMR sample preparation……….……...….25
Appendix 1-C: Standard pulse programs in TOPSPIN 2.0………..….26
CHAPITRE II: REPETITIVE CROSS-POLARIZATION AT LOW RF B1 FIELDS..27
2.1. ABSTRACT……….….…27
viii
2.3. MATERIALS AND METHODS………..……..….. 31
2.3.1. NMR samples………...31
2.3.2. NMR spectroscopy………....…...32
2.3.3. Data processing……….…... 32
2.3.4. NMR pulse sequences………...…. 33
2.4. RESULTS AND DISCUSSION……….……..…...…. 34
2.4.1. Adiabatic cross-polarization……….…... 34
2.4.2. Repetitive cross-polarization at 50 kHz rf amplitudes………..… 39
2.4.3. Repetitive cross-polarization at lower rf amplitudes………... 43
2.5. CONCLUSIONS………...………...………..…..…… 50
REFERENCES………..….. 53
APPENDICES Appendix 2-A Experimental NMR calibrations and supplementary NMR data….… 57 Appendix 2-B: Location of the NMR data………….……….……...…. 61
Appendix 2-C: Pulse programs in TOPSPIN 2.0……… 62
Appendix 2-D: MATLAB codes for spin dynamics simulations………..……….…. 64
CHAPITRE III: REPETITIVE CROSS-POLARIZATION AT LOW RF B1 FIELDS COMBINED WITH PARAMAGNETIC RELAXATION ENHANCEMENT…….….. 82
3.1. ABSTRACT………..…...…… 82
3.2. INTRODUCTION………..……….……. 83
3.3. MATERIALS AND METHODS………...….. 85
3.3.1. NMR samples………...………...… 85
3.3.2. NMR spectroscopy………...…...… 86
3.3.3. Data processing………..…..…. 86
3.3.4. NMR pulse sequences……….…..…...…. 86
3.4. RESULTS AND DISCUSSION……….…….….... 87
3.4.1. Applications in normal bicelles……….…… 87
3.4.1.1. REP-CP sequence and its characteristics………...……. 87
3.4.1.2. REP-CP vs CP-MOIST………...……. 88
3.4.2. Applications in tilted bicelles………...…….. 93
ix
3.4.2.2. REP-CP sequence and its characteristics……….….……..95
3.4.2.3. T1Z measurement for optimal recycle delay……….………....98
3.4.2.4. REP-CP vs CP-MOIST………....……99
3.4.2.5. 2D SLF PISEMA experiments ……….……….…102
3.4.2.6. 15N-15N spin exchange spectra……….…….…104
3.5. CONCLUSIONS………...………..…...….106
REFERENCES………..… 108
APPENDICES Appendix 3-A: Experimental NMR calibrations and supplementary NMR data…...111
Appendix 3-B: Location of the NMR data………..116
Appendix 3-C: Pulse programs in TOPSPIN 2.0………118
CHAPITRE IV: SPECTRAL EDITING BY SELECTIVE EXCITATION…….…… 123
4.1. ABSTRACT………..…..123
4.2. INTRODUCTION……….………..……124
4.3. MATERIALS AND METHODS………..…..126
4.3.1. NMR samples……….……..……126
4.3.2. NMR spectroscopy………..…….126
4.3.3. Data processing………..….. 127
4.3.4. NMR pulse sequences………..……...…. 127
4.4. RESULTS AND DISCUSSION………...………….127
4.4.1. Selective one-dimensional experiments……….……..………127
4.4.1.1. Excitation profiles of the most common selective pulses………….….127
4.4.1.2. Simulations……….…..……129
4.4.1.3. Experimental data……….…..……131
4.4.2. Selective two-dimensional experiments………..……...…..134
4.4.2.1. Goals and expectations……….……….134
4.4.2.2. Selective spin-exchanged SAMPI4: correlations through cross- peaks……….. 134
4.4.2.3. Selective spin-exchanged SAMPI4: correlations through main peaks……….. 137
x
REFERENCES………..……… 145 APPENDICES
Appendix 4-A: Location of the NMR data……….……..……..148 Appendix 4-B: Parameters for the NMR experiments………..………..149 Appendix 4-C: Pulse programs in TOPSPIN 2.0………153 Appendix 4-D: MATLAB codes for spin dynamic simulations………….………….157
CHAPITRE V: SUMMARY AND PERSPECTIVES……….….……160
xi
LIST OF TABLES
Table 2-A.1. Table summarizing the integrals, % increase from CP-MOIST and absolute intensities for each CP sequence acquired with 128 scans and integrated from 150 to 50 ppm 15N chemical shift range in Figure 2.8. ... 60
Table 2-A.2. Table summarizing the integrals, % increase from CP-MOIST and absolute intensities for each CP sequence acquired for 12 minutes and 45 seconds and integrated from 150 to 50 ppm in Figure 2.8. ... 60
Table 3.1. Table of integrals, signal-to-noise, % gain for S/N compared to CP-MOIST, integral weighed for 128 scans and % gain of the weighed integral compared to CP-MOIST values for the six spectra acquired at identical experimental time: CP-MOIST, REP-CP at 50 kHz, re-optimized REP-CP at 50 kHz, REP-CP at 18 kHz, REP-CP at 50 kHz and 0.6 s recycle delay and REP-CP at 18 kHz and 0.6 s recycle delay. ... 90
Table 3.2. Signal-to-noise, integrals and percentage signal enhancement compared to CP-MOIST for the spectra acquired with 1024 scans for REP-CP at 35 kHz, REP-CP at 50 kHz and CP-MOIST at 50 kHz... 99
Table 3.3. Signal-to-noise, integrals, integrals scaled to the same noise and percentage signal enhancement compared to CP-MOIST for the spectra of REP-CP at 35 kHz, REP-CP at 50 kHz and CP-MOIST at 50 kHz, acquired with 1172. 1172 and 256 respectively. ... 101
Table 3.4. Table of integrals and signal-to-noise values for the peaks in the 2D PISEMA (Figure 3.10) acquired with 256 scans for the sequence using CP-MOIST (black), REP-CP at 50 kHz (blue) and REP-CP at 35 kHz (red). Those values were extracted from the NMRPipe software after processing the data. ... 115
Table 4-B.1. Experimental parameters for the selective excitation spectra acquired on the 0.7 mg NAL crystal on the 500 MHz spectrometer. ... 150
Table 4-B.2. Experimental parameters for the selective excitation spectra acquired on the 18 mg NAL crystal on the 500 MHz spectrometer. ... 151
xii
LIST OF FIGURES CHAPTER I - INTRODUCTION
Figure 1.1. Representation of a cell membrane constituted of a phospholipid bilayer,
glycolipids, cholesterols and proteins (Taken from the website:
http://www.nature.com/scitable/nated/topicpage/protein-function-14123348). ... 1
Figure 1.2. Progress in structure determination of membrane proteins to date (Taken from the website: http://blanco.biomol.uci.edu/mpstruc/)... 2
Figure 1.3. Representation of the three systems studied in this work: A. NAL crystal, B. Pf1 phage, and C. Pf1 in DMPC/DHPC bicelles (B and C taken from the publications (Opella, 2008) and (Park, 2010)). ... 5
Figure 1.4. Membrane mimetic systems and their alignment depending on the q ratio of long-chain to short-long-chain lipids: micelles (q=0), small isotropic bicelles (q≤0.5), bicelles (q=3) and bilayers (q>3.5). (Taken from the publication (De Angelis, 2005)). ... 6
Figure 1.5. PISEMA spectra calculated for a 19-residue α-helix with regular 3.6 residues per turn and uniform dihedral angles (φ = -65°, ψ = -40°) at tilt angles varying from 0° to 90° relative to the bilayer normal. (Taken from Dr. Wenxing Tang’s dissertation). ... 14
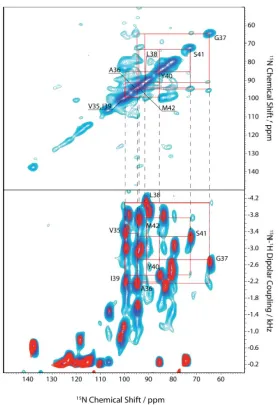
Figure 1.6. Top: 15N-15N spin correlation spectrum with mismatch Hartmann-Hahn, and bottom: SAMPI4 (red) and spin-exchange SAMPI4 (blue) spectra overlapped for structure determination of the Pf1 coat protein. (Taken from the publication (Tang, 2012)). ... 15
CHAPTER II - REPETITIVE CROSS-POLARIZATION AT LOW RF B1 FIELDS Figure 2.1.A. Adiabatic CP (red), REP-CP (green) and CP-MOIST (black) spectra overlapped for the NAL crystal. An adiabatic contact time of 25 ms was applied and the 1H/15N RF ramps were experimentally optimized both at 24 kHz. The REP-CP sequence was acquired with 6 contacts of 300 us each and a 2 second z-filter. The CP-MOIST sequence was run at high rf powers with a 1 ms CP contact. The experiments utilized 64 scans at a B1 rf field of 54.7 kHz.
B.-C. Spin dynamics simulations for the CP and adiabatic CP in an ideal polyalanine α-helix performed for 6 to 12 spins using 50 kHz for CP and 24 kHz for both rf ramps and 1000 increments for a total adiabatic CP contact time of (B) 25 ms (same as the experimental parameters on NAL, spectrum shown on the left) and (C) 5 s (best simulation for an optimal polarization transfer). ... 36
xiii
Figure 2.3. A. Experimental optimization of the CP contact time for the REP-CP (red), CP-MOIST (black) and CP (blue) sequences acquired on the NAL crystal at a B1 rf field of 50 kHz, 2 scans and a LB of 0 Hz. Five CP-MOIST contacts ranging from 20 to 80 µs each and separated with a 0.15 s z-filter were used for the REP-CP sequence. A single CP-MOIST or CP contact ranging from 20 to 80 µs was implemented. B. Superposition of the best spectra for REP-CP (red), CP-MOIST (black) and CP (blue) sequences with CP contact time of 52 µs, 2 scans and a LB of 0 Hz. ... 41
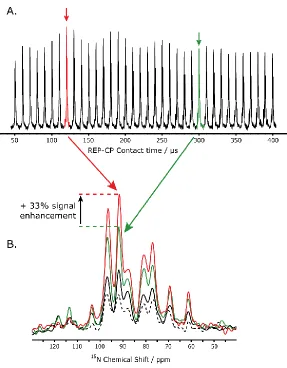
Figure 2.4. A. REP-CP spectra acquired with five CP-MOIST contacts from 50 to 400 µs each on Pf1 in bicelles. A 0.15 second z-filter, 256 scans, a B1 rf amplitude of 50 kHz and a 150 Hz exponential LB were used. B. Optimized REP-CP spectrum (red) acquired with five CP-MOIST contacts of 120 µs each overlapped with REP-CP acquired with the old parameters (green) using five CP-MOIST contacts of 300 µs each, CP-MOIST (black) and CP (dashed line) on Pf1 in bicelles. A 0.15 s z-filter was used in the REP-CP sequences and all the spectra were acquired with B1 rf amplitudes of 50 kHz, 128 scans and processed with a 50 Hz exponential LB. CP and CP-MOIST used a CP contact of 1 ms. ... 43
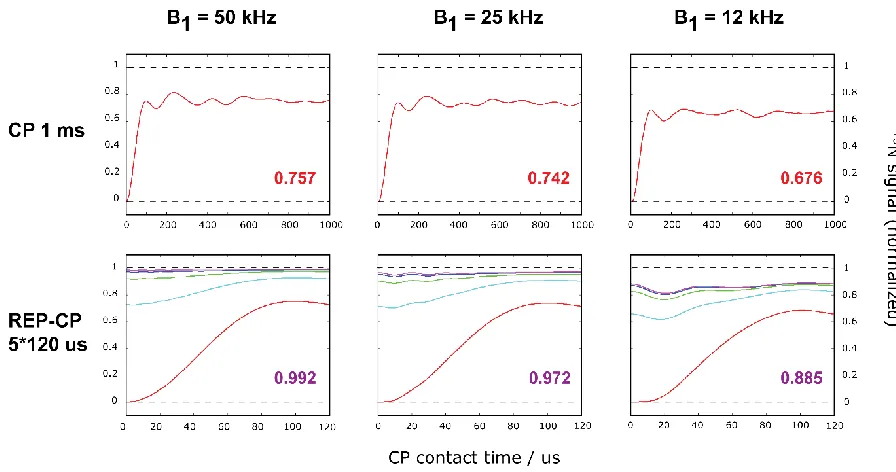
Figure 2.5. Quantum mechanical simulations for the CP sequence (1st row) and REP-CP sequence (2nd row) at B1 rf field of 50 kHz (left column), 25 kHz (middle column) and 12 kHz (right column). The final magnetization on the 15N spin is reported on the bottom right of each graph. 12 spins were used for the simulations. CP schemes use a unique 1 ms CP contact while REP-CP use five contacts of 120 µs each (color code from 1st to 5th contact: red, light blue, green, dark blue and purple). ... 45
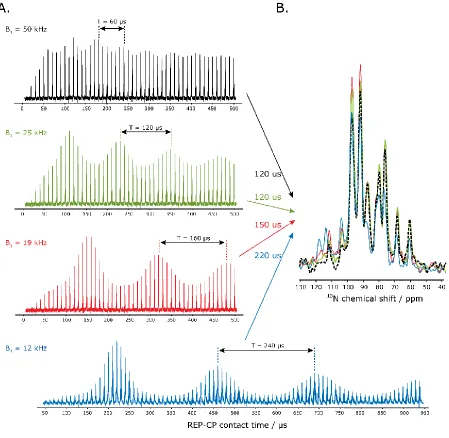
Figure 2.6. A. Experimental optimization of the CP contact time for REP-CP sequences acquired on Pf1 in bicelles at a B1 rf field of 50 kHz (black), 25 kHz (green), 19 kHz (red) and 12 kHz (blue) with five CP-MOIST contacts ranging from 10 to 500 µs (up to 950 µs) each and separated with a 0.15 s z-filter. 256 scans and a 150 Hz LB were used. B. Superposition of the best REP-CP spectra for each B1 rf field: 50 kHz (black), 25 kHz (green), 19 kHz (red) and 12 kHz (blue) with CP contact time of 120 µs, 120 µs, 150 µs and 220 µs, respectively. A 0.15 s z-filter, 5 CP-MOIST contacts, 128 scans and a LB of 50 Hz were applied. ... 47
Figure 2.7. Simulations for the REP-CP sequence with contact times ranging from 10 µs to 1 ms at B1 rf amplitudes of A. 50 kHz, B. 25 kHz, C. 19 kHz and D. 12 kHz. A total of 200 15N magnetization build-up simulations were generated per simulated curve and 10 spins were included. The REP-CP sequences uses five CP-MOIST contacts and a 150 ms z-filter. The oscillations of the transferred magnetization as a function of the single-contact CP time correlate with the amplitudes of the used B1 field. ... 49
xiv
CHAPTER III - REPETITIVE CROSS-POLARIZATION AT LOW RF B1 FIELDS COMBINED WITH PARAMAGNETIC RELAXATION ENHANCEMENT
Figure 3.1. Optimization of the REP-CP sequence at 50 kHz for A. the contact time, B. the number of contacts and C. the z-filter length for Pf1 in normal bicelles with radical. 128 scans and a 100 Hz LB were used. ... 88
Figure 3.2. Superposition of CP-MOIST (dashed back), first REP-CP (orange), re-optimized REP-CP at 50 kHz (blue), REP-CP at 18 kHz (purple), REP-CP at 50 kHz with 0.6 s recycle delay (green) and REP-CP at 18 kHz with 0.6 s recycle delay (red) spectra for the Pf1 in normal bicelles and a 2% of 5-DOXYL. ... 91
Figure 3.3. Superposition of SAMPI4 spectra acquired with the REP-CP block at 50 kHz and 6 s recycle delay (black), REP-CP at 50 kHz and 2 s recycle delay (blue) and REP-CP at 18 kHz and 2 s recycle delay (red). A total of 128 transients and 64 t1 points were acquired. ... 93
Figure 3.4. A.31P spectrum for the Pf1 inserted into bicelles containing a 2% molar ratio of free radical to the lipids and 3 mM of Yb3+ lanthanide ions. B. 31P spectrum of the same sample after adding 3 extra mM of Yb3+ and doing a few temperature cycles. ... 94
Figure 3.5.A. Experimental optimization of the z-filter length for REP-CP sequence at 50 kHz and B. experimental optimization of the number of CP-MOIST contacts for REP-CP sequence at 50 kHz for Pf1 in flipped bicelles. ... 96
Figure 3.6. Experimental optimization of the CP contact time for REP-CP sequences acquired on Pf1 in tilted bicelles containing a free radical at a B1 rf field of 50 kHz (green), 35 kHz (red), 25 kHz (blue) and 19 kHz (black) with five CP-MOIST contacts ranging from 10 to 400 µs and separated with a 0.15 s z-filter. 1024 scans and a 150 Hz exponential line broadening were used. ... 97
Figure 3.7.15N-detected 1H inversion-recovery experiment for Pf1 in tilted bicelles containing a 2% molar ratio of 5-DOXYL stearic acid to the lipids. 256 scans and a 150 Hz LB were used. The crossover of 0.4 s corresponds to a T1z value of 0.7 s. ... 98
Figure 3.8. REP-CP spectrum at 35 kHz spectrum (red) overlapped with REP-CP at 50 kHz (dashed green) and CP-MOIST (black) acquired on Pf1 in flipped bicelles with the same number of scans (1024). The two REP-CP experiments used a 0.7 second recycle delay (due to the presence of 5-DOXYL radical) while the CP-MOIST used a 6 seconds recycle delay. The spectra are displayed with the same noise. ... 100
xv
Figure 3.10. Superposition of the PISEMA spectra acquired with CP-MOIST (black), REP-CP at 50 kHz (blue) and REP-REP-CP at 35 kHz (red). 256 scans, 64 t1 points and a 3 second recycle delay were used. ... 102
Figure 3.11. Superposition of the PISEMA spectra acquired at same experimental time (7 hours and 1 minute) with CP-MOIST (black) and REP-CP at 35 kHz (red). 64 and 186 scans as well as a recycle delay of 6 and 1.5 s were respectively used. 64 t1 points were acquired. ... 103
Figure 3.12. Superposition of 15N-15N spin-exchange spectra acquired with a mismatch of 5 ms at 10 kHz (red) and 14 kHz (blue). The powers on the 15N were set at 35 kHz and on the 1H at 45 kHz for the 10 kHz mismatch and 49 kHz for the 14 kHz mismatch. The REP-CP block at 35 kHz was implemented and 2048 scans, 104 t1 points and a 1 second recycle delay were used. ... 105
CHAPTER IV - SPECTRAL EDITING BY SELECTIVE EXCITATION
Figure 4.1. Envelops of few main selective pulses (left) and their resulting excitation profiles (right) centered on the offset frequency after Fourier transform. Those pulses were taken from the publications (Bodenhausen, 1976) (Bauer, 1984) (Emsley, 1990) and (Geen, 1991). ... 128
Figure 4.2. Simulations of the excitation profiles for a A. single and C. double selective truncated Gaussian pulse at 6% applied for respectively 2.1 ms with a maximum amplitude of 645 Hz and 1.2 ms at 911 Hz, and their corresponding experimental 1D 15N spectra (in red) respectively B. and D. acquired on a 0.7 mg NAL crystal and overlapped to a fully excited spectrum (dotted black line)... 130
Figure 4.3. 1D selective 15N spectra overlapped with fully excited spectra (in black) for A. 18 mg NAL crystal, and B. Pf1 in bicelles. Two different truncated gaussian pulses at 6% (exhibiting a single selectivity profile) were used for the crystal: a 1.6 ms pulse at 911 Hz (red spectrum) and a 3.3 ms pulse at 1,021 Hz (blue spectrum) with the carrier frequency centered respectively on peak #1 (50.702187 MHz) and peak #4 (50.6983943 MHz). A single 3.2 ms pulse at a maximum amplitude of 692 Hz was experimentally implemented for the Pf1 in bicelles (red spectrum). About 50% of the residue G37 is positively selected and 45% of S41 is inverted, the more dynamic region to the left is also excited at a smaller extend... 133
Figure 4.4.A. 1D selective 15N spectrum (red) using a 1.2 ms truncated Gaussian at 6% pulse with a maximum rf amplitude of 911 Hz with double phase selectivity superimposed with a fully excited spectrum (black) for the 0.7 mg NAL crystal. B. 2D SAMPI4 spectrum (blue) superimposed to a selective SAMPI4 spectrum (green = + intensity, red = - intensity) using the same gaussian pulse as for the 1D. C. Selective spin-exchanged SAMPI4 (light green: +, orange: -) superimposed with the previous selective SAMPI4 (in B.). Cross-peaks are seen with a positive intensity if the magnetization was issued from the positively selected peak #1 while they appear negative when the signal originates from the negatively selected peak #2. All the parameters used can be found in table 2-B.1. ... 136
xvi
between peak #1 and peak #2. Every four peak is connected to the others and displays four cross-peaks. B. Selective SAMPI4 spectrum on peak #1 (red) superimposed to a selective spin-exchanged SAMPI4 (grey) on the crystal. Now, the peaks coupled to peak #1 are directly displayed as main peaks. The blue arrow shows the direct connection between peak #1 and peak #2. All the parameters of the experiments can be found in table 4-B.2. ... 139
Figure 4.6. Selective SAMPI4 spectrum on peak #4 (red) overlapped to a selective spin-exchanged SAMPI4 spectrum (grey) for the 18 mg NAL crystal. The SAMPI4 spectrum was acquired with 2 scans while the spin-exchange spectrum used 32 scans. Both experiments were done with 64 t1 points, a 3.3 ms Gaussian pulse at 1,021 Hz maximum, and the 15N carrier frequency moved at 50.6983943 MHz... 140
xvii
LIST OF DIAGRAMS
Diagram 1.1. Pulse sequences for A. CP and B. CP-MOIST. ... 8
Diagram 1.2. Pulse sequence for the 2D SLF PISEMA experiment. (Taken from the publication (Opella, 1994)). ... 11
Diagram 1.3. Pulse sequence for the 2D SLF SAMPI4 experiment. (Taken from the publication (Nevzorov, 2007)). ... 12
Diagram 1.4. Pulse sequences for A. 15N-15N exchange with mismatch Hartmann-Hahn, B.
spin exchange SAMPI4 and C. 15N-15N exchange using proton-driven spin diffusion experiments. (Taken from the publication (Tang, 2012)). ... 13
Diagram 2.1. Pulse sequences for A. adiabatic cross-polarization, B. repetitive cross-polarization and C. low-power repetitive cross-polarization. The two dashed red boxes are identical and were added to facilitate the ‘reading’ of the differences between the high and lower power REP-CP sequences. ... 34
Diagram 4.1. 1D pulse sequence including a -π/2 selective gaussian pulse on the 15N spins while locking (or decoupling) the 1H spins... 132
Diagram 4.2. Selective spin-exchanged SAMPI4 pulse sequence revealing correlations between neighboring coupled 15N sites as cross-peaks. After charging the 15N bath through cross-polarization, the 1H-15N dipolar couplings (DCs) are evolved over the entire span of the 15N spectrum. Then, the selection of a specific 15N frequency is done with a -π/2 selective Gaussian pulse while locking (or decoupling) the 1H spins. Finally, the remaining magnetization is then transferred to the closest coupled 15N spins though the MMHH block. The correlations will appear as cross-peaks having the chemical shift of the directly detected 15N spins and the DC of the selected 15N site. ... 135
xviii
LIST OF ABBREVIATIONS
1D, 2D one dimensional, two dimensional
Ad-CP adiabatic cross-polarization
ADLF/ADRF adiabatic de-magnetization in the laboratory/rotating frame
ARLF/ARRF adiabatic re-magnetization in the laboratory/rotating frame
CP = HHCP Hartmann-Hahn cross-polarization
CP-MOIST cross-polarization with mismatch-optimized IS transfer
CRDSD cross relaxation driven spin diffusion
CS chemical shift
CSA chemical shift anisotropy
DANTE delays alternating with nutations for tailored excitation
DC dipolar coupling
DHPC 1,2-dimyristoyl-sn-glycerol-3-phosphocoline (14:O PC)
DMPC 1,2-dihexanoyl-sn-glycero-3-phosphocoline (6:O PC)
eBURP experimental band-selective, uniform response, pure-phase pulse
FID free induction decay
FSLG frequency-switched Lee-Goldburg decoupling
HEPES N-(2-hydroxyethyl)piperazine-N’-2-ethanesulfonic acid
LB exponential line broadening
LF laboratory frame
LW line width at half height
MAS magic angle spinning
xix
MP membrane protein
NAL 15N-acetyl-leucine crystal
NMR nuclear magnetic resonance
OD600 optical density at 600 nm
OS oriented sample
PDB protein data bank
PDSD proton-driven spin diffusion
PISA polarity index slant angle
PISEMA polarization inversion with spin exchange at the magic angle
ppm parts per million
PRE paramagnetic relaxation enhancement
REP-CP repetitive cross-polarization
rf radio frequency
RF rotating frame
SAMPI4 SLF pulse sequence based on “magic sandwiches” to cancel the homonuclear
term in the average Hamiltonian, with a π/4 pulse correction
SL spin lock
SLF separated local field
S/N signal-to-noise ratio
SPINAL small phase incremental alteration decoupling
ssNMR solid-state nuclear magnetic resonance
TM transmembrane
xx (xy) plane transverse plane
z-axis axis parallel to the external B0 field = same z-axis for LF and RF
xxi
LIST OF SYMBOLS
Å ångström = 10-10 m
B0 external magnetic field
Brf = B1 radiofrequency magnetic field
Da Dalton
H Hamiltonian
HD, Hrf, HZ Hamiltonians for the dipolar, rf and Zeeman interactions
i complex number (i2 = -1)
I high-γ nucleus = 1H spin
Ix, Iy, Iz spin operators for nucleus I
k Boltzmann constant = 1.381 x 10⁻²³ J.K-1
NI population of spins I
NS population of spins S
q molar ratio of long-chain lipids over short-chain lipids
S low-γ nucleus = 15N spin
Sx, Sy, Sz spin operators for nucleus S
t time
T temperature
TL lattice temperature
T1 longitudinal relaxation time = spin-lattice relaxation time
T1d relaxation of the dipolar bath
T1ρ spin-lattice relaxation time constant in the rotating frame
xxii
x, -x, y, -y pulse phase corresponding respectively to 0, π, 𝜋 2 and
3𝜋 2
x̅ = -x pulse with a π phase
y̅ = -y pulse with a 3𝜋 2 phase
---
+ / - positive peak intensity / negative peak intensity
---
γ gyromagnetic ratio
ε enhancement factor
ħ Planck constant = 1.055 x 10⁻³⁴ J.s.rad-1
π 180°
ρ density matrix
σ chemical shift tensor
1
CHAPTER I INTRODUCTION
1.1. MEMBRANE PROTEINS
1.1.1. Significance and challenges
Proteins can be organized into three main families: fibrous, globular and membrane
proteins (MPs). The first two categories are mainly water-soluble and can easily be crystalized
for X-ray crystallography or solubilized for solution NMR spectroscopy, which has already
lead to the determination of more than 110,000 structures in the Protein Data Bank (PDB). By
contrast, the third family of MPs contributes to over 30% of all genes encoded in the animal
Figure 1.1. Representation of a cell membrane constituted of a phospholipid bilayer, glycolipids, cholesterols and
2
and human genomes [1] and represents about 25% of the total number of proteins. MPs are
either bound to or embedded within a cell membrane (Figure 1.1) and are responsible for cell
metabolism and signaling, cell-cell and cell-ligand interactions, membrane receptor and
transport channel of ions or molecules. Due to their biological significance, they constitute
targets of over 50% of the pharmaceuticals nowadays [2] and MPs are mainly hydrophobic and form α-helices or β-barrels in the transmembrane (TM) domain. Elucidating their tertiary
structure, dynamics, folding, aggregation, stability and orientation would greatly facilitate
better drug design and would offer insight into their function within the membrane.
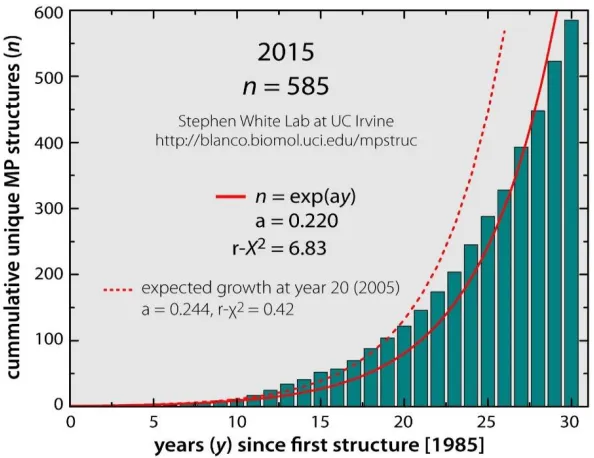
Unfortunately, even though the determination of their structure is following an exponential
trend for the past 30 years (Figure 1.2), only 630 unique MPs structures [3] have been resolved
to this day, mainly due to the difficulty of obtaining high-quality samples for further structural
studies.
Figure 1.2. Progress in structure determination of membrane proteins to date
3
1.1.2. Methodology for MPS structure determination
Various analytical methods help providing detailed structure and dynamic information
of those membrane proteins (MPs) either in a crystal form or in their biological environment;
however, these techniques have significant limitations.
X-ray crystallography can resolve MPs primary structures at atomic-level resolution
but some concerns may be raised regarding their biological relevance because MPs require the
presence of lipids and a pure and homogeneous sample is not always obtainable [4] or when
obtained, may contain a misfolded or inactive form of the protein.
MPs are also often analyzed by liquid-state NMR either as solubilized in a detergent
[5] or inserted in a lipid membrane environment such as micelles [6], small isotropic bicelles
or large vesicular assemblies (liposomes) [7]. Nevertheless, the micelles have significant
curvature which is too pronounced to mimic correctly the cell membrane, whereas liposomes
have a very slow molecular tumbling, which results in broad spectral lines when solution NMR
methods are applied.
In view of the above, solid-state NMR (ssNMR) is probably the most versatile tool to
determine the three-dimensional structure of MPs in their native-like conformation because
they can be analyzed as virus particles [8] or inserted inside lipid bilayers [9, 10]. The MPs of
which the structure was resolved using those methods include gramicidin [11], AchR M2
domain [12], M2 domain of the influenza A virus [13], fd phage [14], Pf1 phage [8], Pf1 coat
protein [15], phospholamban [16], Vpu [17] or MerF [18]. Two distinct ssNMR techniques are
commonly employed. The first one, ssNMR at the magic angle spinning (MAS), averages out
the anisotropic interactions (dipolar couplings and chemical shifts anisotropy) by spinning the
4
field B0. This clever technique allows acquisition of solution-like NMR spectra. The second
method, ssNMR of oriented samples (OS), involves either mechanically orienting the sample
on glass plates [19] and anodized aluminum oxide (AAO) nanopores [20] or magnetically
aligning it in the external magnetic field [21] in a phage form or inserted in a magnetically oriented bilayer. This “immobilization” of the MPs in the external magnetic field allows the
observation of the anisotropic parameters that are normally averaged out by the fast tumbling
in solution NMR or MAS. Even though the spectral lines are broader in this case, the entire
spectral range extends over tens of kHz, from which information on the MPs dynamics,
structure and orientation can be extracted.
1.1.3. Identification of the problem
Structural characterization of membrane proteins in their native-like lipid environment
is of crucial interest in Biochemistry aimed at better understanding of their behavior, folding,
insertion in the membrane and interaction with their environment. Unfortunately, two main
problems arise with ssNMR experiments on oriented samples. The first one is a relatively low
sensitivity of the detected nuclei (usually 13C or 15N). The second is the difficult task for peak
assignment of crowded spectral regions.
Several techniques can be used in attempt to counter those issues. First, isotopic spin
labeling is usually employed to bring the population of the observed spins close to 100%. Second, the “shotgun” approach consists of spin labeling only certain residues in order to
acquire less crowded spectra [22]. Even though this technique is very expensive and time
consuming, it is the most widely employed one as a starting point for peak assignment. Third,
improving spectrometers and probes for sensitivity enhancement can be a long (but rewarding)
5
Enhancement (PRE) [23] and/or Dynamic Nuclear Polarization (DNP) is an emerging
developing field, which may also be, arguably, the most interesting one [24]. Fifth, probably
the easiest technique to gain sensitivity is to develop advanced pulse sequences though
quantum and thermodynamic-bounds on spin dynamics can severely limit polarization
transfer.
1.1.4. Goals and systems of interest
In this present Dissertation, various pulse sequences have been developed for three
different systems exhibiting different degree of motional dynamic: a static N-Acetyl Leucine
crystal (NAL) (Figure 1.3.A), a semi-dynamic filamentous virus bacteriophage Pf1 (Pf1 phage)
(Figure 1.3.B) and the dynamic Pf1 coat protein reconstituted in magnetically aligned lipid
bilayers (Pf1 in bicelles) (Figure 1.3.C). The phage and Pf1 peptide were synthesized in-house
following the protocol in Appendix 1-A and reconstituted in lipid bilayers following the
protocol presented in Appendix 1-B.
The Pf1 coat protein is a relatively small peptide of 46 amino acids (4.6 kDa) which
structure has already been determined in virus particle (phage) [8] and lipid bilayer [25], thus
A. B. C.
Figure 1.3. Representation of the three systems studied in this work: A. NAL crystal, B. Pf1 phage, and
6
making it a good candidate for pulse sequences development. It exhibits two helical domains,
of which one is a 23 amino-acid transmembrane (TM) α-helix (residues 23-45) tilted of about
24-30° with respect to the bilayer normal.
Phospholipid membranes play an essential role for recreating the native-like
environment in which the MPs will behave as closely as they do in the cell membrane. Oriented
bicelles consist of a mixture of long and short-chain phospholipids obtained at a ratio 𝑞 =
𝑛𝑙𝑜𝑛𝑔
𝑛𝑠ℎ𝑜𝑟𝑡 greater than 2.5 so that the bicelles spontaneously orient in the external magnetic field B0 (Figure 1.4). In the present work, DMPC/DHPC lipid bilayers will mainly be used at a ratio
q of 3.2 leading to an orientation of their normal perpendicular to the external magnetic field
[26]. As a result, MPs can be inserted in those bilayers and magnetically oriented for structural
analysis.
Figure 1.4. Membrane mimetic systems and their alignment depending on the q ratio of long-chain to
short-chain lipids: micelles (q=0), small isotropic bicelles (q≤0.5), bicelles (q=3) and bilayers (q>3.5).
7
1.2. SOLID-STATE NMR: PRINCIPLES AND METHODS 1.2.1. Hamiltonian and density matrix evolution
Numerical solutions of the many-spin density matrix equation were obtained using a
MATLAB script (Appendices of Chapters 2 and 4). The spin coordinates were taken from an
ideal poly-alanine α-helix tilted of 30º with respect to the B0 field, and the dipolar couplings
were scaled by -0.4 to account for the perpendicular orientation and uniaxial rotation [17] of
the protein in bicelles. Up to twelve spins were used for the simulations.
In solid-state NMR, the total energy of the system can be described by the following
Hamiltonian in the laboratory frame:
𝐻 = 𝐻𝐼𝑍+ 𝐻
𝑆𝑍+ 𝐻𝐼 𝑟𝑓
+ 𝐻𝑆𝑟𝑓+ 𝐻𝐼𝐼𝐷+ 𝐻
𝑆𝑆𝐷 + 𝐻𝐼𝑆𝐷 (Eqn. 1.1)
with HZ, Hrf and HD being respectively the Zeeman, rf and dipole-dipole interactions.
In the rotating frame, the spin system evolves during the cross-polarization under the simplified
Hamiltonian operator, in which the chemical shift anisotropy (CSA) is neglected:
𝐻 = 𝜔𝐼𝐼𝑥𝑡𝑜𝑡𝑎𝑙+ 𝜔
𝑆𝑆𝑥𝑡𝑜𝑡𝑎𝑙 + ∑ 𝑎𝑖𝑗[𝐼𝑧(𝑖)𝐼𝑧 (𝑗)
− 1 2(𝐼𝑥
(𝑖) 𝐼𝑥(𝑗)+ 𝐼𝑦(𝑖)𝐼𝑦(𝑗))] 𝑁𝐼 𝑖<𝑗 + ∑ ∑ 𝑏𝑘𝑙𝑆𝑧(𝑘)𝐼𝑧(𝑙) 𝑁𝑙 𝑙=1 𝑁𝑆 𝑘=1 (Eqn. 1.2)
Before the application of any rf pulse, the initial magnetization of the system is described by the normalized density matrix ρ(0):
𝜌(0) = 𝐼𝑥 (𝑖𝑛𝑖𝑡𝑖𝑎𝑙)
2𝑁−2 (Eqn. 1.3)
which is then evolved in time under the exponential Hamiltonian operator:
〈𝑆𝑥(𝑘)〉 = 𝑇𝑟𝑎𝑐𝑒 (𝑆𝑥(𝑘) 𝑒−𝑖𝐻𝑡 𝜌(0) 𝑒𝑖𝐻𝑡) (Eqn. 1.4)
The real part of Sx(t) represents the 15N magnetization at any given time t during the pulse
8
1.2.2. One-dimensional pulse sequences for detection of the low-gamma spins 1.2.2.1. Hartmann-Hahn cross-polarization
NMR experiments involving the low-γ nuclei in proteins generally suffer from poor
sensitivity due to their small gyromagnetic ratios, low natural abundance and dilution relative
to the strongly proton-coupled surrounding system. The most widely used sequence to
overcome this difficulty, the Hartmann-Hahn Cross-Polarization (HHCP or CP) scheme [27],
allows the magnetization to flow under the Hartmann-Hahn matching conditions from the
abundant spins I (often 1H) to the rare spins S (usually 13C or 15N) (Diagram 1.1.A). During
the pulse, both spins are spin-locked which consists of applying a strong continuous B1
radiofrequency (rf) field to the magnetization already tilted in the transverse (xy) plane, with
the phase and Larmor frequency corresponding to the magnetization of those spins, so that polarization appears to be locked along the “static” B1 field in the rotating frame, and is no
9
longer affected by the external magnetic field B0. As a result, relaxation processes are
eliminated (except for the spin-lock relaxations or T1ρ).
1.2.2.2. Spin temperature hypothesis
The cross-polarization fundamental principle and theoretical enhancement factor are
derived below from a thermodynamics point-of-view by considering the spin temperature
hypothesis.
During the spin lock (SL), the thermal contact between the spins I and S is possible
only if the Hartmann-Hahn matching conditions are satisfied:
𝛾𝐼 𝐵1𝐼 = 𝛾𝑆 𝐵1𝑆 (Eqn. 1.5)
Before the 90º pulse, the Boltzmann equilibrium distribution in the high-temperature
approximation is: 𝑁↓
𝑁↑= 𝑒𝑥𝑝 ( − ħ 𝜔0
𝑘 𝑇𝑆 ) ≈ 1 − ħ 𝜔0
𝑘 𝑇𝑆 (Eqn. 1.6)
By setting the following conventions:
𝛽𝑆 = ħ
𝑘 𝑇𝑆 ; ∆𝑁 = 𝑁↑− 𝑁↓ ; 𝑁↑/↓ ≈ 𝑁
2 (1 ± 𝛽𝑆 𝜔0
2 ) (Eqn. 1.7-1.9) The magnetization of the I spins before the 90° pulse can be written, at the inverse lattice
temperature 𝛽𝐿 as:
∆𝑁 = 𝑁 𝛽𝐿 𝜔0
2 (Eqn. 1.10)
After the 90° pulse and SL, a new Boltzmann distribution of the I spins is quickly established
such that:
∆𝑁 = 𝑁 𝛽𝐼 𝜔1𝐼
2 (Eqn. 1.11)
Since the difference in populations, ΔN, is initially preserved, we get:
10 Therefore, 𝛽𝐼 𝛽𝐿 = 𝑇𝐿 𝑇𝐼 = 𝜔0 𝜔1𝐼=
𝐵0
𝐵1𝐼 (Eqn. 1.13)
The I spins are now at a very low temperature relative to the lattice temperature TL, as given
by the ratio 𝐵0 𝐵1𝐼.
The main assumption for the Hartmann Hahn process is that during the SL by B1S, the S spin
temperature becomes equal to that of the I spins:
𝛽𝑆 = 𝐵0
𝐵1𝑆 𝛽𝐿 (Eqn. 1.14)
And, thus, under the Hartmann-Hahn condition the two spin systems thermally equilibrate, and
assuming that the abundant spin temperature does not change during the equilibration as NI >>
NS, we finally obtain:
𝛽𝑠′= 𝛽𝐼 = 𝐵0𝛽𝐿
𝐵1𝐼 = ( 𝛾𝐼 𝛾𝑆)
𝐵0
𝐵1𝑆 𝛽𝐿 (Eqn. 1.15)
Therefore, the theoretical efficiency of CP is equal to the quotient of the gyromagnetic ratios: γ𝐼
γ𝑆 which is about 10 when the I and S spins are
1H and 15N, respectively. In reality, however,
the quantum-mechanical and thermodynamics bounds result in a considerably lower
enhancement. In addition, rf mismatches, protein dynamics, loss of spin-lock, relaxation
processes, and sample heating reduce the CP efficiency even further. A multitude of CP
schemes have emerged to try to overcome those experimental limits such as, for example,
ramp-CP [28], CP with mismatch-optimized IS transfer (CP-MOIST) [29, 30] (Diagram
1.1.B), repetitive CP (REP-CP) [31] or adiabatic CP [32, 33], enhancing the low-γ nucleus
signal but still struggling to overcome the thermodynamic limits. Those techniques will be
11
1.2.3. Two-dimensional pulse sequences for structure determination 1.2.3.1. Separated local field sequences
Multidimensional Separated Local Field (SLF) experiments [34-37] are capable of
indirectly measuring the 1H-15N dipolar coupling of the protein amide sites which depends on
the angle between the N-H bond and the external magnetic field as well as the bond length,
adding an important dimension to the 2D experiments (Equation 1.16).
The PISEMA sequence (Polarization Inversion Spin Exchange at the Magic Angle)
(Diagram 1.2) [35] was introduced in 1994 and was the first powerful tool for high resolution
solid-state NMR of MPs. It combines polarization inversion of the S spins (15N in this work)
with the flip-flop Lee-Goldburg homonuclear decoupling on the abundant I spins (1H spins).
Therefore, only the ISheteronuclear dipolar couplings are evolved during the t1 period and the
two-dimensional spectrum obtained displays the 15N chemical shifts in the direct dimension
versus the 1H-15N heteronuclear dipolar couplings in the indirect dimension. However, the
PISEMA sequence is sensitive to the choice of the 1H carrier frequency and suffers from
Diagram 1.2. Pulse sequence for the 2D SLF PISEMA
experiment. (Taken from the publication (Opella, 1994)).
𝑑𝑁𝐻 = − 𝜇0 4𝜋
𝛾𝐻𝛾𝑁ħ 𝑟𝑁𝐻3
1
2 (3𝑐𝑜𝑠 2𝜃
12
unstable performances when the 1H range of frequencies is too broad, which is often the case
for MPs refolded in their native like environment. To counter this defect, the SAMPI4
sequence (Diagram 1.3) [37] based on the Average Hamiltonian Theory (AHT) was
implemented and a “magic sandwich” scheme replaced the frequency-switched Lee-Goldburg
irradiations and proved to be less sensitive to the 1H carrier frequency, as long as the span of
frequencies was not too spread.
1.2.3.2. Magnetization transfer for cross correlations
Sequences involving spin diffusion are an additional support for the peak assignment
task. Proton Driven Spin Diffusion (PDSD) [38, 39] allows the short-range 15N-15N
spin-exchange between close coupled sites to occur through space by using very long mixing times
(few seconds). The Cross Relaxation Driven Spin Diffusion (CRDSD) [40] enhances the
previous method by transforming the long mixing time into a low spin-lock rf field applied to
the 15N, forcing the magnetization to transfer during the SL. In addition to being faster, it allows
for cross-correlations between more distant sites (up to 5 Å). Nevertheless, those two methods
rely heavily on the direct 15N-15N dipolar coupling which becomes very small as the distance
Diagram 1.3. Pulse sequence for the 2D SLF SAMPI4
13
between spins increases (inversely proportional to the cube of the distance). An alternative
sequence using proton mediated polarization transfer via the proton bath under 10-20%
mismatched Hartmann-Hahn (MMHH) conditions [41] relies essentially on the strong 1H-1H
dipolar couplings to transfer magnetization from a 15N site to its 15N neighbors and can perform
at least up to 6.7 Å. When the MMHH is implemented with the SAMPI4 sequence (Diagram
1.4.B) in the so-called spin-exchanged SAMPI4 (Figure 1.6, bottom, blue spectrum),
cross-peaks arise in the 2D SLF spectrum between 15N sites close in space and permit to walk down
the protein backbone when overlapped to the SAMPI4 spectrum (Figure 1.6, bottom, red
spectrum).
Diagram 1.4. Pulse sequences for A.15N-15N exchange with mismatch Hartmann-Hahn,
14
An additional set of 2D experiments is often required due to the lack of enough
resolution in the previous SLF experiments. It also adds another dimension by plotting the 15N
chemical shifts in both dimension and acquiring cross-peaks off-diagonal when 15N spins are
coupled (Figure 1.6, top). The pulse sequence can either include a PDSD period of a few
seconds after the evolution of the CS in the indirect dimension (Diagram 1.4.C) or force the
transfer of magnetization through a much shorter MMHH period (Diagram 1.4.A).
1.2.3.3. Methodology for structure determination and spectroscopic assignment
From the SAMPI4 spectrum of Pf1 in bicelles (Figure 1.5, bottom, red), a “wheel” can
be drawn through the successive amino-acids. This PISA (Polarity Index Slant Angle) wheel
[8] (Figure 1.5) and the resulting dipolar waves profile [42] are highly characteristic of TM
α-helices and give specific information on their tilt angle from the membrane normal and their
deviation from an ideal helix (kinks, periodicity, etc.).
Figure 1.5. PISEMA spectra calculated for a 19-residue α-helix with regular 3.6 residues per turn
15
The aim of ssNMR applied on oriented MPs is to define their tertiary structure from a
rigorous attribution of the experimentally resolved resonances of the backbone (shotgun
approach, 15N-15N CS correlations, SLF and spin-exchanged SLF experiments) followed by
computational calculations to determine the protein structure. Nevertheless, NMR data of large
proteins or clusters of proteins can easily become unusable due to peaks overlapping as a result
of poor spectral resolution.
Figure 1.6. Top: 15N-15N spin correlation spectrum with mismatch Hartmann-Hahn, and bottom: SAMPI4 (red) and spin-exchange SAMPI4 (blue) spectra overlapped for structure
16
1.3. SUMMARY OF RESEARCH AND OBJECTIVES
The aim of this Dissertation is to develop a methodology to improve the two mains
issues in ssNMR of membrane proteins which are the low sensitivity of the observed dilute
spins and the crowdedness in multidimensional spectra which make the peak attribution
process difficult, and therefore hurdle the structure determination of biological
macromolecules.
The second Chapter will focus on applying and developing cross-polarization schemes
using low-power B1 rf field on a fully 15N-labelled Pf1 protein reconstituted in an oriented lipid
bilayer. Indeed, hydrated samples are difficult to stabilize as they usually degrade fast due to
rf heating during the NMR acquisition and other intrinsic problems such as impurities in the
sample. The adiabatic CP sequence [33] as well as an improved version of the REP-CP
sequence [31] will be investigated at lower rf powers.
The third Chapter will incorporate the Paramagnetic Relaxation Enhancement (PRE)
effect that a free radical have on its surroundings to the low-power REP-CP sequence in order
to i) enhance the cross-polarization scheme, and ii) decrease the recycle delay between each
transient therefore leading to an impressive signal gain per unit time. The technique will be
applied to Pf1 in oriented bilayers with their normal perpendicular or parallel to the external
magnetic field B0.
Finally, the fourth Chapter will introduce an implementation of the 2D SLF sequences
by adding a selective pulse to facilitate the spectroscopic assignment process for crowded
spectral regions. Two pulse sequences will be developed on a 15N-doped crystal sample and
then applied on the oriented Pf1 protein with the aim of decreasing the number of
17
as main peaks which will facilitate the protein backbone walk and therefore eliminate any
18
REFERENCES
[1] Wallin E, von Heijne G. Genome-wide analysis of integral membrane proteins from eubacterial, archaean, and eukaryotic organisms. Protein Sci. 1998;7:1029-38.
[2] Drews J. Drug discovery: A historical perspective. Science. 2000;287:1960-4. [3] White S. Membrane proteins of known 3D. UC Irvine. 2016.
[4] Ostermeier C, Michel H. Crystallization of membrane proteins. Current Opinion in Structural Biology. 1997;7:697-701.
[5] Tamm LK, Liang BY. NMR of membrane proteins in solution. Progress in Nuclear Magnetic Resonance Spectroscopy. 2006;48:201-10.
[6] Arora A, Tamm LK. Biophysical approaches to membrane protein structure determination. Current Opinion in Structural Biology. 2001;11:540-7.
[7] Watts A, Spooner PJR. Phospholipid phase-transitions as revealed by NMR. Chemistry and Physics of Lipids. 1991;57:195-211.
[8] Thiriot DS, Nevzorov AA, Zagyanskiy L, Wu CH, Opella SJ. Structure of the coat protein in Pf1 bacteriophage determined by solid-state NMR Spectroscopy. Journal of Molecular Biology. 2004;341:869-79.
[9] Sanders CR, Landis GC. Reconstitution of membrane-proteins into lipid-rich bilayered mixed micelles for NMR-studies. Biochemistry. 1995;34:4030-40.
[10] Chou JJ, Kaufman JD, Stahl SJ, Wingfield PT, Bax A. Micelle-induced curvature in a water-insoluble HIV-1 Env peptide revealed by NMR dipolar coupling measurement in stretched polyacrylamide gel. Journal of the American Chemical Society. 2002;124:2450-1. [11] Ketchem RR, Roux B, Cross TA. High-resolution polypeptide structure in a lamellar phase lipid environment from solid state NMR derived orientational constraints. Structure. 1997;5:1655-69.
[12] Opella SJ, Marassi FM, Gesell JJ, Valente AP, Kim Y, Oblatt-Montal M, et al. Structures of the M2 channel-lining segments from nicotinic acetylcholine and NMDA receptors by NMR spectroscopy. Nature Structural Biology. 1999;6:374-9.
[13] Wang JF, Kim S, Kovacs F, Cross TA. Structure of the transmembrane region of the M2 protein H+ channel. Protein Science. 2001;10:2241-50.
19
[15] Park SH, Marassi FM, Black D, Opella SJ. Structure and dynamics of the membrane-bound form of Pf1 coat protein: Implications of structural rearrangement for virus assembly. Biophysical Journal. 2010;99:1465-74.
[16] Traaseth NJ, Buffy JJ, Zamoon J, Veglia G. Structural dynamics and topology of phospholamban in oriented lipid bilayers using multidimensional solid-state NMR. Biochemistry. 2006;45:13827-34.
[17] Park SH, De Angelis AA, Nevzorov AA, Wu CH, Opella SJ. Three-dimensional structure of the transmembrane domain of Vpu from HIV-1 in aligned phospholipid bicelles. Biophysical Journal. 2006;91:3032-42.
[18] De Angelis AA, Howell SC, Nevzorov AA, Opella SJ. Structure determination of a membrane protein with two trans-membrane helices in aligned phospholipid bicelles by solid-state NMR spectroscopy. Journal of the American Chemical Society. 2006;128:12256-67. [19] Opella SJ, Ma C, Marassi FM. Nuclear magnetic resonance of membrane-associated peptides and proteins. Nuclear Magnetic Resonance of Biological Macromolecules, Pt B. 2001;339:285-313.
[20] Smirnov AI, Poluektov OG. Substrate-supported lipid nanotube arrays. Journal of the American Chemical Society. 2003;125:8434-5.
[21] Cross TA, Opella SJ. Protein-structure by solid-state NMR. Journal of the American Chemical Society. 1983;105:306-8.
[22] Marassi FM, Opella SJ. Simultaneous assignment and structure determination of a membrane protein from NMR orientational restraints. Protein Science. 2003;12:403-11. [23] Solomon I. Relaxation processes in a system of two spins. Physical Review. 1955;99:559-65.
[24] Carver TR, Slichter CP. Experimental verification of the Overhauser nuclear polarization effect. Physical Review. 1956;102:975-80.
[25] Park SH, Opella SJ. Triton X-100 as the "short-chain lipid" improves the magnetic alignment and stability of membrane proteins in phosphatidylcholine bilayers for oriented-sample solid-state NMR spectroscopy. Journal of the American Chemical Society. 2010;132:12552-3.
[26] Sanders CR, Hare BJ, Howard KP, Prestegard JH. Magnetically-oriented phospholipid micelles as a tool for the study of membrane-associated molecules. Progress in Nuclear Magnetic Resonance Spectroscopy. 1994;26:421-44.
20
[28] Metz G, Wu XL, Smith SO. Ramped-amplitude cross-polarization in magic-angle-spinning NMR. Journal of Magnetic Resonance Series A. 1994;110:219-27.
[29] Levitt MH, Suter D, Ernst RR. Spin dynamics and thermodynamics in solid-state NMR cross-polarization. Journal of Chemical Physics. 1986;84:4243-55.
[30] Levitt MH. Heteronuclear cross polarization in liquid-state nuclear-magnetic-resonance mismatch compensation and relaxation behavior. Journal of Chemical Physics. 1991;94:30-8. [31] Tang WX, Nevzorov AA. Repetitive cross-polarization contacts via equilibration-re-equilibration of the proton bath: Sensitivity enhancement for NMR of membrane proteins reconstituted in magnetically aligned bicelles. Journal of Magnetic Resonance2011. p. 245-8. [32] Chingas GC, Garroway AN, Moniz WB, Bertrand RD. Adiabatic-J cross-polarization in liquids for signal enhancement in NMR. Journal of the American Chemical Society. 1980;102:2526-8.
[33] Hediger S, Meier BH, Kurur ND, Bodenhausen G, Ernst RR. NMR cross-polarization by adiabatic passage through the Hartmann-Hahn condition (APHH). Chemical Physics Letters. 1994;223:283-8.
[34] Waugh JS. Uncoupling of local field spectra in nuclear magnetic-resonance - determination of atomic positions in solids. Proceedings of the National Academy of Sciences of the United States of America. 1976;73:1394-7.
[35] Wu CH, Ramamoorthy A, Opella SJ. High-resolution heteronuclear dipolar solid-state NMR-spectroscopy. Journal of Magnetic Resonance Series A. 1994;109:270-2.
[36] Nevzorov AA, Opella SJ. A "Magic Sandwich" pulse sequence with reduced offset dependence for high-resolution separated local field spectroscopy. Journal of Magnetic Resonance. 2003;164:182-6.
[37] Nevzorov AA, Opella SJ. Selective averaging for high-resolution solid-state NMR spectroscopy of aligned samples. Journal of Magnetic Resonance. 2007;185:59-70.
[38] Cross TA, Frey MH, Opella SJ. N-15 Spin exchange in a protein. Journal of the American Chemical Society. 1983;105:7471-3.
[39] Marassi FM, Gesell JJ, Valente AP, Kim Y, Oblatt-Montal M, Montal M, et al. Dilute spin-exchange assignment of solid-state NMR spectra of oriented proteins: Acetylcholine M2 in bilayers. Journal of Biomolecular NMR. 1999;14:141-8.
21
[41] Nevzorov AA. Mismatched Hartmann-Hahn conditions cause proton-mediated intermolecular magnetization transfer between dilute low-spin nuclei in NMR of static solids. Journal of the American Chemical Society. 2008;130:11282-+.
22
23
APPENDIX 1-A Expression and purification of Pf1 coat protein.
This protocol was adapted from Dr. Opella’s lab [8] by Dr. Erica Vogel & Sophie Koroloff,
then further adjusted by Deanna Tesch. The amounts used are to prepare 200 mL of Pf culture
which yields about 20-25 mg of lyophilized Pf1 peptide.
Solutions and compounds
Pseudomonas Aeruginos (P.A.) in glycerol stock
Luria Broth (LB) (autoclaved)
Na2HPO4.7H2O (autoclaved)
KH2PO4 (autoclaved)
NaCl (autoclaved)
15NH4Cl (>99% pure)
MgSO4.7H2O at 0.25 mg/mL (sterile filtered, 0.22 μm)
CaCl2.2H2O at 0.25 mg/mL (sterile filtered, 0.22 μm)
Dextrose at 0.5 g/mL (autoclaved)
Thiamine hydrochloride at 0.1 g/mL (sterile filtered, 0.22 μm)
MEM vitamin (sterile filtered, 0.22 μm)
Polyethylene glycol (PEG)
Tetrafluoroethylene (TFE)
Trifluoroacetic acid (TFA)
Hard agar (HA) (autoclaved): 0.67 g beef extract + 1 g peptane + 3 g agar in 200 mL R.O. water
Soft agar (SA) (autoclaved): 0.17 g beef extract + 0.25 g peptane + 0.25 g agar in 50 mL R.O. water
Pf liquid culture expression (make fresh before each expressions in the following paragraph)
100 µL of P.A. + 3 mL of LB
Incubate at 37°C / 250 rpm / 24 h
Pour HA into 5 plates until it hardens
Add 0.4 mL of P.A. to 20 mL of SA and transfer 4 mL into each plates until it hardens
Spread 0.5 mL of Pf liquid culture from previous batch into each plate Incubate at 37°C / 0 rpm / 24 h
Scrap SA into one 50 mL cone tube
Centrifuge at 21°C / 3,000 rpm / 30 mins (repeat the process another time)
24 Pf1 expression and purification
--- BSL-2 requirements
100 µL of P.A. + 3 mL of LB
Incubate at 37°C / 250 rpm / 6 h
Transfer 1.5 mL of culture to 10 mL Pf1 medium Incubate at 37°C / 250 rpm / 17 h
Transfer 5 mL of culture in 15 mL tube
Centrifuge at 4°C / 3,000 rpm / 30 mins
Resuspend pellet in the 200 mL Pf1 medium
Incubate at 37°C / 250 rpm / 4-6 h, until OD600 = 0.35-0.45
Add 1mL of freshly prepared Pf liquid culture Incubate at 37°C / 250 rpm / 22 h
Transfer culture to 4 tubes of 50 mL
Centrifuge at 4°C / 3,000 rpm / 30 mins
Pour supernatant into 4 new tubes
Centrifuge at 4°C / 3,000 rpm / 30 mins
Transfer supernatant to bottle of 8 g of PEG and 6 g of NaCl Store in fridge at 4°C overnight
Transfer culture to 4 tubes of 50 mL each
Centrifuge at 4°C / 3,000 rpm / 30 mins
Pour supernatant into 4 new tubes
Centrifuge at 4°C / 3,000 rpm / 30 mins
--- End of BSL-2 requirements
Resuspend pellet from the 8 tubes in 8 mL of R.O. water
Transfer into 2 filtration units (10,000 kDa MW)
Centrifuge at 21°C / 3,000 rpm / 30 mins or until about 1 mL is left
Repeat filtration about 5-6 times with 2-3 mL of R.O. water
Centrifuge at 21°C / 3,000 rpm / 30 mins or until about 1 mL is left
Resuspend each pellet in 2 mL of R.O. water
Transfer to tared Eppendorf tubes and lyophilize overnight
Weigh amount of Pf1 phage in each Eppendorf tubes
Resuspend each lyophilized powder with 1 mL of TFE/TFA Vortex and centrifuge at 21°C / 12,000 rpm / 20 mins
Transfer supernatant to new tared Eppendorf tubes Lyophilize overnight
Weigh amount of Pf1 phage in each Eppendorf tubes
Add 1 mL of R.O. water
Vortex and centrifuge at 21°C / 12,000 rpm / 20 mins
Discard water and repeat process a few times Lyophilize overnight