Copyright2001 by the Genetics Society of America
An Amplified Fragment Length Polymorphism Map of the Silkworm
Yuan-De Tan,*
,†Chunling Wan,
†Yufang Zhu,
†Chen Lu,
‡Zhonghuai Xiang
‡and Hong-Wen Deng*
,§*Laboratory of Molecular and Statistical Genetics, College of Life Science, Hunan Normal University, Changsha 410081, People’s Republic of China,†College of Life Science, Nangjing Normal University, Nanjing 210097, People’s Republic of China,‡Key Laboratory of
Agricultural Ministry, College of Sericulture, Southwest Agricultural University, Chongqing 400716, People’s Republic of China and§Osteoporosis Research Center and Department of Biomedical Sciences, Creighton University, Omaha, Nebraska 68131
Manuscript received June 9, 2000 Accepted for publication November 26, 2000
ABSTRACT
The silkworm (Bombyx moriL.) is a lepidopteran insect with a long history of significant agricultural value. We have constructed the first amplified fragment length polymorphism (AFLP) genetic linkage map of the silkwormB. mori at a LOD score of 2.5. The mapping AFLP markers were genotyped in 47 progeny from a backcross population of the cross no. 782⫻od100. A total of 1248 (60.7%) polymorphic AFLP markers were detected with 35PstI/TaqI primer combinations. Each of the primer combinations generated an average of 35.7 polymorphic AFLP markers. A total of 545 (44%) polymorphic markers are consistent with the expected segregation ratio of 1:1 at the significance level ofP⫽ 0.05. Of the 545 polymorphic markers, 356 were assigned to 30 linkage groups. The number of markers on linkage groups ranged from 4 to 36. There were 21 major linkage groups with 7–36 markers and 9 relatively small linkage groups with 4–6 markers. The 30 linkage groups varied in length from 37.4 to 691.0 cM. The total length of this AFLP linkage map was 6512 cM. Genetic distances between two neighboring markers on the same linkage group ranged from 0.2 to 47 cM with an average of 18.2 cM. The sex-linked geneodwas located between the markers P1T3B40 and P3T3B27 at the end of group 3, indicating that AFLP linkage group 3 was theZ(sex) chromosome. This work provides an essential basic map for constructing a denser linkage map and for mapping genes underlying agronomically important traits in the silkwormB. moriL.
L
INKAGE maps have become powerful research tools important traits requires more informative markers in genetic studies of many organisms (e.g., Wada than RFLP. This is especially the case for marker-assistedet al.1995;Knapiket al.1996;Dibet al.1997;Dietrich selection (Ro¨ deret al.1998).
et al. 1997). A complete linkage map is necessary to Recently, the amplified fragment length polymor-efficiently carry out molecular-based analyses such as phism (AFLP) technique (Voset al. 1995) has proved molecular marker-assisted selection (Cho et al. 1994; to be a convenient and reliable tool to generate highly
Ro¨ der et al. 1998), quantitative trait loci (QTL) map- polymorphic molecular markers that greatly facilitate ping of agronomically important traits (Lander and building linkage maps (Beckeret al.1995;Qiet al.1997;
Botstein1989;Ro¨ deret al.1998), prediction of hetero- Waughet al.1997). AFLP is a PCR-based technique that sis, and comprehensive investigations of genomic evolu- avoids the laborious steps involved in RFLP mapping tion between lineages (Morizot et al. 1977;Morizot and generally shows a much higher level of
polymor-1983;Lyons et al.1997). phism and informativeness than any other marker
sys-Although there has been steady progress in con- tem in the organisms examined so far (Mackill et al. structing molecular linkage maps, many available tech- 1996). In the AFLP technique, dozens of restriction niques are limited for various reasons. Gene mapping fragments (ⵑ50–100) from a total digest of genomic employing restriction fragment length polymorphisms DNA are amplified in PCR by using oligonucleotide (RFLPs) is often limited because of the relatively low adaptor and restriction site DNA sequences as target level of RFLPs in many organisms, such as wheat (Chao sites for primer annealing (Voset al.1995). The main
et al. 1989; Kam-Morgan et al. 1989; Liu et al. 1990; value of this technique is that a very large array of
poly-Cadalenet al.1997) and the silkworm (Shiet al.1995), morphisms is efficiently and quickly sampled, although and thus requires the use of populations derived from each individual polymorphism may not be as highly wide crosses (Ro¨ deret al.1998). However, in an
intra-informative as microsatellite markers. specific context, QTL mapping of many agronomically
Since their relatively recent discovery, AFLP markers have been widely employed to construct linkage maps of a variety of agronomically important organisms, such
Corresponding author:Hong-Wen Deng, Osteoporosis Research Ctr.,
as barley (Beckeret al.1995;Castiglioniet al.1998), Creighton University, 601 N. 30th St., Suite 6787, Omaha, NE 68131.
E-mail: [email protected] melon (Cucumis meloL.;Wanget al.1997), the oomycete
The original AFLP procedure as described by Zabeau and
(Phytophthora infestans;Van Der Leeet al.1997), soybean
Vos(1993) andVoset al.(1995) was followed using a minor
(Gycine; Keim et al. 1997), chicken (Gallus domesticus;
modification as follows. The restriction enzymes used were Herbergset al.1999;Knorret al.1999), and rice (Oryza PstI andTaqI, which produce polymorphic DNA fragments in sativa;Zhuet al. 1999). AFLP markers have also been the silkworm. Adapters used were as follows:
successfully employed to map agronomically important
CORE ENZ
genes such as the cystnematode resistance locus Gpa2
in potato (Rouppe van der Voortet al.1997), theMlo 5⬘-GACGTGACGGCCGTC ATGCA-3⬘
gene in barley (Simons et al. 1997), the Rx gene for 3⬘-GCACTGCCGGCAG T-5⬘
PstI adapter
extreme resistance to potato virus X in tetraploid potato (Bendahmaneet al. 1997), and QTL for resistance to
CORE ENZ
Bacillus thuringiensis toxins in the diamondback moth
(Heckelet al.1999). 5⬘-GACGATGAGTCCTGA G-3⬘
3⬘-TACTCAGGACT CGC 5⬘
The silkworm (Bombyx moriL.) is an important insect
TaqI adapter
with a long history of great agronomic value. Under-standing its genome organization using molecular
mark-The primers corresponding to the PstI adapter and TaqI
ers is important for genetic studies and for breeding adapter were as follows: purposes.Promboonet al.(1995) constructed a linkage
CORE ENZ EXT
map for the silkworm with 169 markers using randomly
amplified polymorphic DNA (RAPD) and Yasukochi Primer-PstI-1, 5⬘GACGGCCGTCA TGCAG A 3⬘
(1998) built a dense RAPD linkage map, containing Primer-TaqI-1, 5⬘GATGAGTCCTGAG CGA A 3⬘
1018 genetic markers on all the 27 autosomes and the Primer-PstI-2, 5⬘GACGGCCGTCA TGCAG NNN 3⬘ Primer-TaqI-2, 5⬘GATGAGTCCTGAG CGA NNN 3⬘
Z (sex) chromosome. Although RAPD is a convenient tool to generate polymorphic markers in general, the
The primer-PstI-1 and primer-TaqI-1 were used for the
pre-polymorphic level of RAPD markers is much lower than amplification reaction. The 10-l PCR preamplification reac-that of AFLP markers (Sharma et al.1996). However, tion system contained 2.5 ng template DNA, 30 ng of both a linkage map of the silkworm constructed using AFLP primer-PstI-1 and primer-TaqI-1, 0.2 units Taq polymerase, 0.2 mmof each dNTP, 1.5 mmMgCl2, 50 mmKCl, 10 mm
Tris-markers has never been reported. In addition, the RAPD
HCl (pH 9.0), and 0.1% Triton X-100. The preamplification
linkage maps were constructed employing an F2
popula-reaction conditions and steps employed were as described by
tion, which may not be appropriate for dominant type Vos et al. (1995). After the preamplification reaction, the markers such as RAPD and AFLP, since recombination 10-l PCR amplification reaction system contained 1l prod-occurs only in males in the silkworm. Our purpose here uct of the diluted preamplification reaction, 30 ng
primer-PstI-2, 15 ng primer-TaqI-2, 0.2 units Taq polymerase, 0.2 mm is to build the first AFLP-based linkage map of the
silk-of each dNTP, 1.5 mmMgCl2, 50 mmKCl, 10 mmTris-HCl
worm using a backcross population.
(pH 9.0), and 0.1% Triton X-100. The amplification reaction conditions and steps were as described byVoset al.(1995). All amplification reactions were performed in a PTC200 (Gene MATERIALS AND METHODS
Company). The primer-PstI-2 and primer-TaqI-2 used in the second amplification reactions are listed in Table 1. There Insect material:The silkworm (B. moriL.) strains employed
were 35 primer combinations. were no. 782 and od100. No. 782 is a bivoltine variety from
Gel analysis:The products of the second amplification reac-Japan, whose body color in the larval stage is white. od100 is
tion were detected by silver staining on a large denaturing a Chinese multivoltine variety, whose larval body color is
dis-polyacrylamide gel (Promega, Madison, WI) as described by tinct oily translucence, which is controlled by a recessive
muta-Chalhoub et al. (1997) and by Q4132 silver stain kits for tion, od, on the Z (sex) chromosome. The variety no. 782
sequencing (Promega) containing 500 l bind silane, 10⫻ has a dominant allele of the od gene (wild type). Genetic
2 g AgNO3(Promega), 20⫻3 ml 37% formalin (formalde-recombination occurs only in males inB. moriand other
lepi-hyde), 10⫻60 g Na2CO3(Promega), and 10⫻1 ml 100 mg/ dopteran insects. This Lepidoptera-related phenomenon
ml sodium thiosulphate. leads to the fact that marker loci derived from the female and
Linkage analysis and map construction:We performed2 -male parents cannot be integrated into a single map using an
tests for each of the AFLP bands generated to determine F2population. Because of this, our mapping was performed
whether the segregation ratio of presence/absence in BC1 on a backcross population. An F1male moth of the cross no.
was significantly different from the expected ratio of 1:1. We 782⫻od100 was crossed to a female moth of the recurrent
eliminated the AFLP data showing an unexpected segregation parent od100 to generate a BC1 population. The crossing
ratio at theP⫽0.05 level of significance. A data matrix was experiments were performed in the Institute of the Silkworm
constructed from the presence/absence of all polymorphic and Mulberry, Southwest Agricultural University of the
Peo-bands for all 47 backcrossed individuals. This data matrix was ple’s Republic of China. Mapping was performed with 47
input into the program package MAPMAKER/EXP (version silkworm pupae after anchoring the geneodin the backcross
3.0;Landeret al.1987). The “GROUP” command (LOD 3.0, population.
maximum recombination fraction 0.3) was used to segregate AFLP analysis:Genomic DNA of individual silkworms was
all informative markers into linkage groups. The “SUGGEST extracted from pupae as described by Benderet al. (1983)
SUBSET” command was employed to find highly informative and byPromboonet al.(1995). It was purified by extraction
and well-spaced markers within each group. The framework with phenol/chloroform, precipitated by ethanol, and
TABLE 1
The primers used in the second amplification
Primer-PstI-2 Primer-TaqI-2
P1: 5⬘-GACGGCCGTATGCAGAAT-3⬘ T1: 5⬘-GATGAGTCCTGAGCGAAAT-3⬘
P2: 5⬘-GACGGCCGTATGCAGAAG-3⬘ T2: 5⬘-GATGAGTCCTGAGCGAAAC-3⬘
P3: 5⬘-GACGGCCGTATGCAGAAC-3⬘ T3: 5⬘-GATGAGTCCTGAGCGAACA-3⬘
P4: 5⬘-GACGGCCGTATGCAGATA-3⬘ T4: 5⬘-GATGAGTCCTGAGCGAAAG-3⬘
P5: 5⬘-GACGGCCGTATGCAGATC-3⬘ T5: 5⬘-GATGAGTCCTGAGCGAAGA-3⬘
P6: 5⬘-GACGGCCGTATGCAGATG-3⬘ T6: 5⬘-GATGAGTCCTGAGCGAAGC-3⬘
P7: 5⬘-GACGGCCGTATGCAGAGA-3⬘
within each of the major linkage groups. The “ORDER” and the total length of the map led to a reduction from the “COMPARE” commands were used to identify the most 6807.6 to 6512.0 cM. Relatively larger changes were ob-probable marker order within a linkage group. The order was
served in the major linkage groups. Groups 1, 2, 4,
verified using the “RIPPLE” command. Markers were retained
and 5 were shortened by 20.5, 13.5, 18.3, and 18.5%,
within the framework of this map only if the LOD value for
RIPPLE was at least 2.5. The “TRY” command was used to respectively. Other linkage groups were shortened by
assign additional markers to intervals within the LOD 2.5 no more than 10%. The reduction (4.33%) of our map framework, followed by the process of submitting marker or- was, in total length, much less than that (40.3%) of ders to COMPARE and reconfirming the framework of this
the AFLP map of barley reported byCastiglioniet al.
map with a LOD⬎2.5 using the RIPPLE command. Typing
(1998).
errors were detected with the ERROR DETECTION option
and the map distance between neighboring markers was calcu- The distributions of the mapping AFLP markers
lated according to the Kosambi function (Kosambi1944). among the primer combinations:Data in Table 2
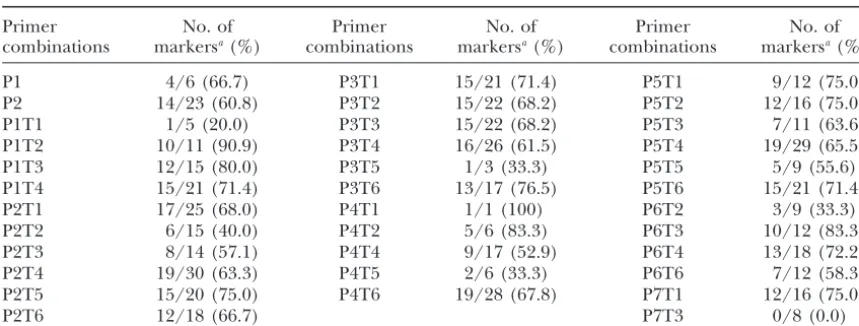
pro-vide information on the distribution of mapping AFLP markers among the 35 primer combinations for the
RESULTS
cross of no. 782⫻ od100. The proportion of markers
The AFLP linkage map: A total of 2056 AFLP bands employed for mapping to those consistent with the
ex-were clearly detected with the 35PstI/TaqI primer com- pected segregation ratio of 1:1 was, on average, 62.0%. binations, of which 1248 bands were polymorphic. For most primer combinations,ⵑ10–15 markers is use-Those bands that were not readable enough were not ful for mapping; only P1T1, P3T5, P4T1, P4T5, and employed in this study. The frequency of polymorphic P6T2 generated poorly informative markers for map-AFLP markers from the clearly detected bands in the ping, and the distributions of mapping markers among no. 782⫻od100 cross in the silkworm was 60.7%, sig- their primer combinations ranged from 5 to 19. Only nificantly higher than that (14.0%) in the Proctor ⫻ one primer combination, P7T3, did not produce any Nudinka cross reported in barley (Castiglioni et al. informative marker for mapping. Overall, primers P1,
1998). Each primer combination generated an average P2, P3, P5, T3, T4, and T6 were more efficient in gener-of 35.7 polymorphic markers. A total gener-of 545 polymor- ating informative markers than P4, P6, T1, T2, and T5 phic markers fell in the expected segregation ratio of 1:1 in these two strains. These data showed that the AFLP at theP⫽0.05 level. About 56% polymorphic markers technique produces highly informative markers for showed deviation from the expected 1:1 ratio of the gene mapping in the silkworm. We did not find that
P ⫽ 0.05 significance level. A total of 356 of the 545 markers from any primer combination were clustered markers were assigned to 30 linkage groups. The num- on only one linkage group or in only one region. ber of markers on linkage groups ranged from 4 to 36.
There were 21 major linkage groups with 7 to 36 markers and 9 relatively small linkage groups with 4 to 6 markers
DISCUSSION
in this AFLP linkage map (Figure 1). Linkage groups
A total of 61% of AFLP bands that were clearly read-ranged in length from 37.4 to 691.0 cM. The total length
able and thus evaluated were polymorphic between the for this AFLP linkage map was 6512 cM. The distances
no. 782 and od100 strains of the silkworm. This high between two neighboring markers ranged from 0.2 to
level of polymorphism between the two strains may be 47.5 cM with an average of 18.24 cM. Theodgene on
due to the fact that only bands representing relatively theZ chromosome of the classical map (Xiang1995)
small fragments that were well scattered and readable was located between the markers P1T3B40 and P3T3B27
from the middle to the bottom of the gels were counted. on one end of group 3. Hence group 3 was probably
About 60% of the total bands obtained in the genotyp-theZchromosome.
ing efforts were monomorphic and/or relatively large. After typing errors were detected with the
Figure1.—AFLP genetic linkage map of the silkworm based on 47 backcrossed progeny derived from the no. 782⫻od100 cross. The markers are represented by
PstI primer number, TaqI primer number, and band number. Theodgene on the
Zchromosome of the classi-cal map of the silkworm is located on group 3. The numbers on the left-hand side of each linkage group are the genetic distances in each interval measured in centimorgans.
top of the gels, these large bands were not counted in The high level of polymorphic AFLP markers in those bands counted may be due to several factors. First, no. our mapping research. About 40% of the total bands
were polymorphic. About 56% of the polymorphic 782 and od100 are two distinct silkworm strains. The former was from the Japanese bivoltine system and the markers showed deviation from the expected 1:1
segre-gation ratio at the P⫽ 0.05 significance level. Hence, latter was from the Chinese multivoltine system. A high level of DNA polymorphisms is not unexpected between 22.4% of all the markers deviated from the expected
Figure1.—Continued.
high levels of polymorphisms (Huyset al.1996;Latorra elements (Bmmar1), long terminal repeat transposons (LTRs), nonlong terminal transposons (nonLTRs), and
et al.1996;Mackillet al.1996;Wanet al.1999). Dozens
of restriction fragments (ⵑ50–100) from a total digest so on (Uedaet al.1986;HerrerandWang1991;Xiong
andEickbush1993;Xionget al.1993;Robertsonand of genomic DNA are amplified in PCR by using
oligonu-cleotide adaptor and restriction site DNA sequences as Asplund1996;Tomitaet al.1997;Shimizuet al.2000;
Wang et al. 2000). The chromosomal distribution of target sites for primer annealing (Voset al.1995). Third,
a large fraction of the silkworm genome consists of these transposable elements has been shown to vary between silkworm strains. If some sites of restriction families of transposable elements such asBm1, BMC1
TABLE 2
The distribution of the AFLP mapping markers among primer combinations
Primer No. of Primer No. of Primer No. of
combinations markersa(%) combinations markersa(%) combinations markersa(%)
P1 4/6 (66.7) P3T1 15/21 (71.4) P5T1 9/12 (75.0)
P2 14/23 (60.8) P3T2 15/22 (68.2) P5T2 12/16 (75.0)
P1T1 1/5 (20.0) P3T3 15/22 (68.2) P5T3 7/11 (63.6)
P1T2 10/11 (90.9) P3T4 16/26 (61.5) P5T4 19/29 (65.5)
P1T3 12/15 (80.0) P3T5 1/3 (33.3) P5T5 5/9 (55.6)
P1T4 15/21 (71.4) P3T6 13/17 (76.5) P5T6 15/21 (71.4)
P2T1 17/25 (68.0) P4T1 1/1 (100) P6T2 3/9 (33.3)
P2T2 6/15 (40.0) P4T2 5/6 (83.3) P6T3 10/12 (83.3)
P2T3 8/14 (57.1) P4T4 9/17 (52.9) P6T4 13/18 (72.2)
P2T4 19/30 (63.3) P4T5 2/6 (33.3) P6T6 7/12 (58.3)
P2T5 15/20 (75.0) P4T6 19/28 (67.8) P7T1 12/16 (75.0)
P2T6 12/18 (66.7) P7T3 0/8 (0.0)
Percentage of mapping markers per primer combination: 63.5.
aThe number to the left of the slash is the number of mapping markers; the number to the right of the slash is the number of markers consistent with the expected segregation ratio of 1:1 atP⫽0.05 significance level; the number in parentheses is the proportion of the less to the more.
combinations distribute on such mobile DNA sequences neighboring markers in the recurrent parent—a conse-quence of a low density of markers in the region. How-in the silkworm genome, they could account for some
of the polymorphic AFLP markers that were detected. ever, these markers may be used together with markers obtained from other AFLP, RFLP, RAPD, and microsa-Therefore, a high degree of polymorphism between the
no. 782 and od100 is not too surprising. tellite analyses to obtain a denser AFLP map of the
silkworm. Deviations from Mendelian segregation ratios have
been seen in previous efforts to construct genetic link- The haploid genome of the silkworm has 28 chromo-somes and 28 conventional linkage groups have been age maps using molecular markers (see Faris et al.
1998); 26% of RFLP markers showed distorted segrega- recognized (Doira1992). Our AFLP map is composed of 30 linkage groups, of which some linkage groups are tion ratios in the potato (Gebhardtet al.1989), and
the corresponding number is 44% in barley (Graner from the same chromosome. Development of a denser collection of markers may be able to link some of these
et al.1991). For the AFLP markers, distorted segregation
ratios were seen 65% of the time in the clubroot (Voor- linkage groups together. Nonequivalence between the number of linkage groups and the number of
chromo-rips et al.1997) and 54% of the time in the silkworm
as reported here. Distorted segregation of molecular somes has also been reported in other studies ( Prom-boon et al. 1995; He 1998; Young et al. 1998).
Yasu-markers may result from competition among gametes
for preferential fertilization (Lyttle 1991), sampling kochi (1998) indicated that the large number of chromosomes in the haploid silkworm genome (n ⫽
in finite mapping populations, breaking of DNA chains
during extraction of DNA samples from tissues, or am- 28), typical of lepidoptera, makes it difficult to construct maps without missing some chromosomes.
plification of a single-sized fragment derived from
sev-eral different regions (Fariset al.1998). Markers ampli- Analysis of distributions of informative markers among primer combinations indicated that neither all primers fied from near centromeric regions of chromosomes
also tend to have distorted segregation ratios (Fariset nor all primer combinations could produce informative polymorphic markers for mapping. This suggests that,
al.1998). As mentioned earlier, some markers may have
been amplified from transposable elements and such similar to the RAPD technique, AFLP analysis of the whole genome such as we performed here is required to markers may not follow Mendelian segregation ratios.
About 30% of markers showing Mendelian segrega- search for primer combinations with highly informative markers. In an F2population of the Proctor⫻Nudinka
tion ratios were unlinked in our study. Higher
propor-tions of unlinked markers were observed in mapping cross in barley, on average, a primer combination ampli-fied 87.5 markers, the frequency of AFLP polymorphic studies with other species (Gebhardt et al. 1989;
Al-Janabiet al.1993;GrattagliaandSederoff1994; markers was 14.0%, and the proportion of informative markers for mapping to polymorphic ones was 61.3%
He1998). In our results for dominant-recessive AFLP
markers, all the unlinked markers detected come from (Castiglioniet al.1998). In comparison, the frequency of AFLP markers that were polymorphic in the backcross the nonrecurring parent,i.e., no. 782. Therefore, many
walking and jumping to isolate DNA from theAceandrosyloci per primer combination were amplified and the
propor-and the bithorax complex inDrosophilia melanogaster.J. Mol. Biol. tion of informative markers for mapping to polymorphic 168:17–33.
ones was 63.5%. Therefore, the frequency of polymor- Cadalen, T., C. Boeuf, S. Bernardand M. Bernard, 1997 An intervarietal molecular marker map in Triticum aestivum L. Em. phic AFLP markers in the silkworm was much higher
Thell. and comparison with a map from a wide cross. Theor. than in barley, but the proportion of informative mark- Appl. Genet.94:367–377.
ers for mapping to all the polymorphic ones was similar Castiglioni, P., C. Pozzi, M. Heun, V. Terzi, K. J. Mulleret al., 1998 An AFLP-based procedure for the efficient mapping of in both species.
mutations and DNA probes in barley. Genetics149:2039–2056. Our AFLP map with an average of 18.24 cM per inter- Causse, M. A., T. M. Fulton, Y. G. Cho, S. N. Ahn, J. Chumwongse val was not particularly dense and had several gaps⬎30 et al., 1994 Saturated molecular map of the rice genome based on an interspecific backcross population. Genetics138:1251– cM. The relatively large gaps led to the increased length
1274.
of our map and need to be filled in with additional Chalhoub, B. A., S. Thibault, V. Laucou, C. Rameau, H. Hofte markers. The distance between neighboring markers et al., 1997 Silver staining and recovery of AFLP(TM) amplifica-tion products on large denaturing polyacrylamide gels. Biotech-on a map is not strBiotech-ongly related to a mapping populatiBiotech-on
niques22:216–218. size but is determined mainly by the likelihood values
Chao, S., P. J. Sharp, A. J. Worland, E. J. Warham, R. M. D. Koebner
of their order when using MAPMAKER/EXP (version et al., 1989 RFLP-based genetic maps of wheat homoeologous group7 chromosomes. Theor. Appl. Genet.78:495–504. 3.0;Y. D. Tan, C. L. WanandY. F. Zhu,unpublished
Cho, Y. G., M. Y. Eun, S. R. McGouchandY. A. Chae,1994 The results). In addition, typing errors may also be partially
semi-dwarf gene, sd-1 of rice. II. Molecular mapping and marker-responsible for map expansion (Lincoln andLander assisted selection. Theor. Appl. Genet.89:54–59.
Dib, C., S. Faure, C. Fizames, D. Samson, N. Drouotet al., 1997 A 1992). Castiglioni et al.(1998) reported that use of
comprehensive genetic map of the human genome based on the ERROR DETECTION option of MAPMAKER
re-5264 microsatellites. Nature380:152–154.
duced the map length from 2673 to 1597 cM, shortening Dietrich, W. F., J. Miller, R. Sten, M. A. Merchant, D.
Damron-boleset al., 1997 A comprehensive genetic map of the mouse it by 40.3%. After typing errors were detected using
genome. Nature380:149–151. the ERROR DETECTION option, our map length was
Doira, H.,1992 Genetical stocks and mutations of Bombyx mori: shortened by only 4.33% and we did not find the “inver- important genetic resources. Linkage maps and list of genetical sion” of marker order reported in Castiglioni et al. stocks maintained in Kyushu University. Institute of Genetic
Re-sources, Kyushu University, Japan. (1998). This result suggests that there were only a few
Faris, J. D., B. LaddomadaandB. S. Gill,1998 Molecular mapping typing errors in our study, which led to the slight in- of segregation distortion loci in Aegilops taushii.Genetics 149: crease in length of our map.TanandMa(1998) demon- 319–327.
Gebhardt, C., E. Ritter, T. Debener, U. Schachischarel, B.
Wal-strated theoretically that with additional markers typed
kemeieret al., 1989 RFLP analysis and linkage mapping in
Sola-the map length may increase when marker density is num tuberosum.Theor. Appl. Genet.78:65–75.
not saturated or may decrease when marker density is Graner, A., A. Jahoor, J. Schondelmaier, H. Siedler, K. Pilieret al., 1991 Construction of an RFLP map of barley. Theor. Appl. in a saturation state. For example,Causseet al.(1994)
Genet.83:250–256.
constructed a rice map with 762 markers covering Grattapaglia, D.,andR. Sederoff, 1994 Genetic linkage maps of 4026.3 cM, whereasHarushimaet al.(1998) obtained Eucalyptus grandis and Eucalyptus urophylla using a pseudo-testcross: mapping strategy and RAPD markers. Genetics 137: a 2275-marker genetic map of rice covering 1521.6 cM.
1121–1137.
This may explain why the length of our AFLP map is Harushima, Y., M. Yano, A. Shomura, M. Sato, T. Shimanoet al., more than that ofYasukochi’s (1998) RAPD map. 1998 A high-density rice genetic linkage map with 2275 markers
using a single F2 population. Genetics148:479–494. We are particularly grateful to two anonymous reviewers and Dr.
He, N. J.,1998 Construction of the molecular linkage map of the
Simmons for their constructive comments that greatly improved the silkworm (
Bombyx moriL.). Ph.D. Thesis, Southwest Agricultural manuscript. This study was supported by grants 39870568, 3970730, University, Chongqing, China.
A1078, and 21075 from the Natural Science Foundation of China, Heckel, D. G., L. J. Gahan, Y. B. LiuandB. E. Tabashnik,1999 Key Natural Science Foundation of China, Natural Science Fund Genetic mapping of resistance to Bacillus thuringiensis toxins in Agency, and Education Ministry Agency in JiangSu province, respec- diamondback moth using biphasic linkage analysis. Proc. Natl.
Acad. Sci. USA96:8373–8377. tively. H.-W. Deng is supported by grants from the National Institutes
Herbergs, J., M. Siwek, R. P. Crooijmans, J. J. Van der Poeland of Health, Health Future Foundation, Creighton University, and
Hu-M. A. Groenen, 1999 Multicolour fluorescent detection and nan Normal University.
mapping of AFLP markers in chicken (Gallus domesticus). Anim. Genet.30:274–285.
Herrer, R. J.,andJ. Wang,1991 Evidence for a relationship be-tween the Bombyx mori middle repetitive Bm1 sequence family
LITERATURE CITED and U1 snRNA. Genetica84:31–37.
Huys, G., R. Coopman, P. Janssen, K. Kersters,1996
High-resolu-Al-Janabi, S. M., R. J. Honeycutt, M. McClelland and B. W.
tion genotypic analysis of the genus Aeromonas by AFLP
finger-Sobral,1993 A genetic linkage map of Saccharum spontaneum
printing. Int. J. Syst. Bacteriol.46:572–580. L. ‘SES 208’. Genetics134:1249–1260.
Kam-Morgan, I. N. W., B. S. GillandS. Muthurrishnan, 1989
Becker, J., P. Vos, M. Kuiper, F. SalaminiandM. Heun,1995
Com-DNA restriction fragment length polymorphisms: a strategy for bined mapping of AFLP and RFLP markers in barley. Mol. Gen.
genetic mapping of D genome of wheat. Genome32:724–732. Genet.249:65–73.
Keim, P., J. M. Schupp, S. E. Travis, K. Clayton, T. Zhuet al., 1997
Bendahmane, A., K. KanyukaandD. C. Baulcombe,1997
High-A high-density soybean genetic map based on High-AFLP markers. resolution genetical and physical mapping of the Rx gene for
Crop Sci.37:537–543. extreme resistance to potato virus X in tetraploid potato. Theor.
Knapik, E. W., A. Goodman, O. S. Atkinson, C. T. Roberts, M.
Appl. Genet.95:153–162.
(Danio rerio) anchored with simple sequence length polymor- al., 2000 Extrachromosomal transposition of the transposable element minos occurs in embryos of the silkworm bombyx mori. phisms. Develoment123:451–460.
Insect Mol. Biol.9:277–281.
Knorr, C., H. H. ChengandJ. B. Dodgson,1999 Application of
Simons, G., T. Van der Lee, P. Diergaarde, R. Van Daelen, J.
AFLP markers to genome mapping in poultry. Anim. Genet.30:
Groenendiijket al., 1997 AFLP-based fine mapping of the Mlo 28–35.
gene to a 30-kb DNA segment of the barley genome. Genomics
Kosambi, D. D.,1944 The estimation of map distances from
recom-44:61–70. binaton values. Ann. Eugen.12:172–175.
Tan, Y. D., and R-L. Ma,1998 Estimates of lengths of genome
Lander, E. S.,andD. Botstein,1989 Mapping Mendelian factors
and chromosomes of rice using molecular markers. J. Biomath. underlying quantitative traits using RFLP linkage maps. Genetics
(Chinese)13:1022–1027. 121:185–199.
Tomita, S., B. H. SohnandT. Tamura,1997 Cloning and
character-Lander, E. S., P. Green, J. Abrahamson, A. Barlow, M. J. Daly
ization of a mariner-like element in the silkworm, Bombyx mori.
et al., 1987 MAPMAKER: an interactive computer package for
Genes Genet. Syst.72:219–228. constructing primary genetic linkage maps of experimental and
Ueda, H., S. MizunoandK. Shimura,1986 Transposable genetic natural populations. Genomics1:174–181.
element found in the 5⬘-flanking region of the fibroin H-chain
Latorra, D.,andM. S. Schanfield, 1996 Analysis of human
speci-gene in a genomic clone from the silkworm Bombyx mori. J. ficity in AFLP systems APOB, PAH, and D1S80. Forensic Sci. Int.
Mol. Biol.190:319–327. 83:15–25.
Van Der Lee, T., I. De Witte, A. Drenth, C. AlfonsoandF. Govers,
Lincoln, S. E., and E. S. Lander,1992 Systematic detection of
1997 AFLP linkage map of the oomycetePhytophthora infestans.
errors in genetic linkage data. Genomics14:604–610.
Genet. Biol.21:278–291.
Liu, Y. G., N. MoriandK. Tsunfwaki,1990 Restriction fragment
Voorrips, R. E., M. C. JogeriusandH. J. Kanne,1997 Mapping length polymorphism (RFLP) analysis in wheat. I. Genomic DNA
of two genes for resistance to clubroot (Plasmodiophora brassicas) library construction and RFLP analysis in common wheat. Jpn.
in a population of doubled haploid lines of brassica oleracea by J. Genet.65:365–380.
means of RFLP and AFLP markers. Theor. Appl. Genet.94:75–82.
Lyons, L. A., T. F. Laughlin, N. G. Copeland, N. A. Jenkins, J. E. Vos, P., R. Hogers, M. Bleeker, M. Reijans, T. Van de Leeet al., Womack et al., 1997 Comparative anchor tagged sequences 1995 AFLP: a new technique for DNA fingerprinting. Nucleic
(CATS) for intergrative mapping of mammalian genomes. Nat. Acids Res.23:4407–4414.
Genet.15:47–56. Wada, H., K. Naruse, A. Shimada andA. Shima, 1995 Genetic
Lyttle, T. W.,1991 Segregation distorters. Annu. Rev. Genet.25: linkage map of a fish, the Japanese medaka Oryzias latips. Mol.
511–557. Mark. Biol. Biotech.4:263–274.
Mackill, D. J., Z. Zhang, E. D. RedonaandP. M. Colowit,1996 Wan, C. L., Y. F. Zhu, Y. D. TanandC. Lu,1999 Application of
Level of polymorphism and genetic mapping of AFLP markers AFLP markers to detection of genetic polymorphic loci in the
in rice. Genome39:969–977. silkworm (Bombyx mori, L.). Biotechnology (Chinese)9:4–9.
Morizot, D. C.,1983 Tracing linkage groups from fishes to mam- Wang, Y. H., C. E. ThomasandR. A. Dean,1997 A genetic map
mals. J. Hered.74:413–416. of melon (Cucumis melo L.) based on amplified fragment length
Morizot, D. C., D. A. WrightandM. J. Siciliano,1977 Three polymorphism (AFLP) markers. Theor. Appl. Genet.95:791–798. linkage enzyme loci in fishes: implications in the evolution of Wang, W., L. SweversandK. Iatrou,2000 Mariner (Mos1)
transpo-vertebrate chromosomes. Genetics86:645–656. sase and genomic integration of foreign gene sequences in
Bom-Promboon, A., T. Shimada, H. FujiwaraandM. Kobayashi,1995 byx mori cells. Insect Mol. Biol.9:145–155.
Linkage map of random amplified polmorphic DNAs (RAPDs) Waugh, R., N. Bonar, E. Baird, B. Thomas, A. Graneret al., 1997 Homology of AFLP products in three mapping populations of in the silkworm, Bombyx mori. Genet. Res.66:1–7.
barley. Mol. Gen. Genet.255:311–321.
Qi, X., P. StamandP. Lindhout,1997 Use of the locus specific
Xiang, Z. H.,1995 Genetics and Breeding of the Silkworm, pp. 273–289. AFLP markers to construct a high density molecular map in
Chinese Agriculture Press, Beijing. barley. Theor. Appl. Genet.96:376–384.
Xiong, Y.,andT. H. Eickbush,1993 Dong, a non-long terminal
Robertson, H. M.,andM. L. Asplund,1996 Bmmar1: a basal
lin-repeat (non-LTR) retrotransposable element from Bombyx mori. eage of the mariner family of transposable elements in the
silk-Nucleic Acids Res.21:1318. worm moth, Bombyx mori. Insect Biochem. Mol. Biol.26:945–
Xiong, Y., W. D. BurkeandT. H. Eickbush,1993 Pao, a highly 954.
divergent retrotransposable element from Bombyx mori
con-Rouppe van der Voort, J. N. A. M., P. Van Zandvoort, H. J. Van
taining long terminal repeats with tandem copies of the putative
Ecr, R. T. Folkertsma, R. C. B. Hutteret al., 1997 Use of
R region. Nucleic Acids Res.21:2117–2123. allele specificity of comigrating AFLP markers to align genetic
Yasukochi, Y.,1998 A dense genetic map of the silkworm,Bombyx
maps from different potato genotypes. Mol. Gen. Genet.255:
mori, covering all chromosomes based on 1018 molecular mark-438–447.
ers. Genetics150:1513–1525.
Ro¨ der, M. S., V. Korzun, K. Wendehake, J. Plaschke, M. H. Tixier
Young, W. P., P. A. Wheeler, V. H. Coryell, P. KeimandG. H.
et al., 1998 A microsatellite map of wheat. Genetics149:2007–
Thorgaard, 1998 A detailed linkage map of rainbow trout 2023.
produced using doubled haploids. Genetics148:839–850.
Sharma, S. K., M. R. KnoxandT. H. N. Ellis,1996 AFLP analysis Zabeau, M.,andP. Vos,1993 Selective restriction fragment amplifi-of the diversity and phylogeny amplifi-of Lens and its comparison with cation: a general method for DNA fingerprinting. European
Pa-RAPD analysis. Theor. Appl. Genet.93:751–758. tent Application no. 92402629.7, publication no. 0 534 858 Al.
Shi, J., D. G. HeckelandM. R. Goldsmith,1995 A genetic linkage Zhu, J. H., P. Stephenson, D. A. Laurie, W. Li, D. Tanget al., 1999
map for the domesticated silkworm, Bombyx mori, based on Towards rice genome scanning by map-based AFLP
fingerprint-restriction fragment length polymorphisms. Genet. Res.66:109– ing. Mol. Gen. Genet.261:184–195. 126.