ABSTRACT
LEE, ELAINE XIN HUI. A Simulation of Drug Diversion in a Healthcare Setting with the Use of Control Charts to Detect Diversion Activities. (Under the direction of Dr. Julie Ivy, Dr. Anita Vila-Parrish and Dr. James Wilson.)
Cost control is a key issue within any industry. In the healthcare industry, costs have been rising much faster than inflation for several years, and it is essential for the future viability of the system to control these rising costs. One central factor in this is the control of the theft or diversion of drugs. In addition to the cost of the loss of drugs, the mismanagement of drug inventories can lead to high regulatory fines.
It is noted that the misuse of the diverted drugs is much higher among healthcare workers than the general public, which raises concerns about the improper treatment of patients by these potentially impaired workers, and the associated additional liability risks for the hospital. The challenge is to detect this misuse when it is being managed by highly educated medical practitioners who regularly handle controlled substances and who are able to conceal the signs of their addiction.
This study assesses the use of control charts to detect the loss or diversion of drugs, based on a simulation of the process flow of the drugs, patients and healthcare workers in the hospital. The objective is to quickly highlight potential diversions so that checks and improved controls can be implemented before the losses become significant.
Simulations were then run to assess the effect of diversions, and comparisons were made with the control charts to assess which chart was most sensitive for the detection of diversion. It was found that overall, the tabular cusum control chart is better for the detection of
diversion than the Shewhart and moving-range control chart.
Overall it is concluded that the tabular cusum control chart is very powerful for the identification and prioritization of areas of potential concern. At present it cannot be concluded that this method alone will be sufficient to confirm that diversion has occurred, especially for lower diversion rates, due to the occurrence of false positives in the tabular cusum control charts. However, where areas of concern have been identified using this method, additional follow-up may then be performed using such measures as more intensive drug testing, stock taking, and possibly more intensive monitoring.
A Simulation of Drug Diversion in a Healthcare Setting with the Use of Control Charts to Detect Diversion Activities
by
Elaine Xin Hui Lee
A thesis submitted to the Graduate Faculty of North Carolina State University
in partial fulfillment of the requirements for the Degree of
Master of Science
Operations Research
Raleigh, North Carolina
2015
APPROVED BY:
___________________________ _________________________ Dr. Julie Ivy Dr. Anita Vila-Parrish Co-Chair of Advisory Committee Co-Chair of Advisory Committee
__________________________ Dr. James Wilson
BIOGRAPHY
The author, Elaine Xin Hui Lee, was born in Miri, Malaysia, in 1989. She attended college at Lewis-Clark State College in Lewiston, Idaho, from August 2007 to May 2010 before transferring to the University of Idaho in August 2010. In 2012, she received the Bachelor of Science degree in Applied Mathematics with an emphasis in Operations Research and Statistics from the University of Idaho. As of August 2012, she joined the North Carolina State University as a Master’s of Science student in the Operations Research
ACKNOWLEDGEMENTS
TABLE OF CONTENTS
LIST OF TABLES ... vi
LIST OF FIGURES ... viii
CHAPTER 1 – INTRODUCTION AND LITERATURE REVIEW ... 1
CHAPTER 2 – METHODOLOGY ... 9
2.1 The Process Flow Model ... 9
2.1.1 The Drug Process Flow Model ... 9
2.1.2 The Patient Process Flow Model ... 11
2.1.3 The Healthcare Worker Process Flow Model ... 12
2.1.4 The Drug, Patient and Healthcare Worker Process Flow Model ... 14
2.2 The Process Attributes ... 16
2.3 The Process Values ... 17
2.3.1 The Drug Process Values ... 17
2.3.2 The Patient Process Values ... 19
2.3.3 The Healthcare Worker Process Values ... 20
2.3.4 Diversion Values ... 21
2.4 The ARENA® Model ... 24
2.5 Control Charts ... 34
2.5.1 The Shewhart Control Chart for Individual Measurements... 34
2.5.2 The Moving-Range Control Chart ... 39
2.5.3 The Cumulative (Cusum) Control Chart ... 41
2.5.4 The Average Run Length (ARL) ... 43
CHAPTER 3 – RESULTS ... 45
3.1 Ward Drug Inventory Levels ... 45
CHAPTER 4 – EXPERIMENTATION/SENSITIVITY ANALYSIS ... 57
4.1 Changing the Diversion Rate ... 57
4.1.1 Increasing the Diversion Rate ... 57
4.1.2 Decreasing the Diversion Rate ... 62
4.2 Changing the Demand Function ... 65
CHAPTER 5 – DISCUSSION AND CONCLUSION ... 67
LIST OF TABLES
Table 1.1 How and where diversion occurs. ... 4
Table 1.2 Some recent and developed systems to detect and screen diversion activities. ... 6
Table 2.1 Drug attributes and values ... 18
Table 2.2 Patient attributes and values ... 19
Table 2.3 Healthcare worker attributes and values ... 21
Table 2.4 Diversion attributes and values for oxycodone ... 22
Table 2.5 Simulation results of ward inventory for 180 days without diversion ... 36
Table 2.6 Simulation results of the ward inventory for the seventh and eighth month with diversion ... 38
Table 3.1 Performance of the Shewhart and tabular cusum control charts on ward drug ... 46
inventory with diversion in month 7and 8 ... 46
Table 3.2 Performance of the Shewhart control chart and tabular cusum control charts on .. 49
ICU drug inventory with diversion in month 7 and 8 ... 49
Table 3.3 Performance of the Shewhart control chart and tabular cusum control charts on OR drug inventory with diversion in month 7 and 8 ... 52
Table 3.4 Performance of the Shewhart and tabular cusum control charts on ER drug ... 55
inventory with diversion in month 7 and 8 ... 55
Table 3.5 Summary results of the Shewhart and tabular cusum control charts on ward, ICU, OR and ER for month 7 and 8 with diversion ... 56
Table 4.1 Detection of ward drug diversion when diversion probability amount increases ... 58
Table 4.2 Detection of ICU drug diversion when diversion probability amount increases .... 59
Table 4.3 Detection of OR drug diversion when diversion probability amount increases ... 60
Table 4.4 Detection of ER drug diversion when diversion probability amount increases ... 61
LIST OF FIGURES
Figure 2.1 Drug process flow model ... 10
Figure 2.2 Patient process flow model ... 11
Figure 2.3 Healthcare worker process flow model ... 13
Figure 2.4 Drug, patient and healthcare worker process flow model ... 15
Figure 2.5 Probability density function of 2*(1%)*BETA (4, 4) ... 23
Figure 2.6 Record the daily inventory at the end of each day submodel in ARENA ... 25
Figure 2.7 Pharmacy daily inventory update submodel ... 26
Figure 2.8 Ward, ICU, ER and OR daily inventory update submodel ... 28
Figure 2.9 Ward daily inventory update submodel ... 29
Figure 2.10 Patient process flow and demand submodel ... 31
Figure 2.11 Ward patient process flow and demand submodel ... 32
Figure 2.12 Shewhart control chart for individual measurements of ward inventory ... 39
Figure 2.13 Moving-range control chart of ward inventory ... 40
Figure 2.14 Tabular cusum bar chart of ward inventory ... 42
Figure 3.1 Shewhart control chart for individual measurements of ICU inventory ... 47
Figure 3.2 Moving-range control chart of ICU inventory ... 48
Figure 3.3 Tabular cusum control chart of ICU inventory ... 48
Figure 3.4 Shewhart control chart for individual measurements of OR Inventory ... 50
Figure 3.5 Moving-range control chart of OR Inventory ... 51
Figure 3.6 Tabular cusum control chart of OR Inventory... 51
Figure 3.7 Shewhart control chart for individual measurements of ER Inventory ... 53
Figure 3.8 Moving-range control chart of ER Inventory ... 53
CHAPTER 1 – INTRODUCTION AND LITERATURE REVIEW
The healthcare system in the United States has recently seen some positive changes with the introduction of the Affordable Care Act signed by President Obama in 2010. [1] Since the enactment of the law, citizens and businesses have wider health coverage, lower health care costs and better patient care. [2][3] Prior to the law, many Americans and small businesses could not afford to pay for health insurance.[1][4] In addition, reports show that the U.S. healthcare system fares poorly against other developed nations despite being the most expensive healthcare system in the world. [5][6][7] Compared with other similarly developed countries, the U.S. healthcare system is relatively weak in terms of quality, access,
efficiency, equity and healthy lives. [5] These reports are particularly discouraging because the U.S spends approximately $2.3 trillion annually on healthcare. [6]
One of the contributors to high healthcare spending is the fact that “money is diverted
from patient care toward wasteful practices, overburdened bureaucracies and excessive profits to businesses.” [6]
In addition to this, expenditure is high due to pharmaceutical companies selling drugs at prices that are many times higher than the drug prices sold in other countries. [7] Therefore, even with the introduction of the Affordable Care Act, it comes as no surprise that financial challenges “ranked No. 1 on the list of hospital CEOs’ top concerns in 2013.” [8]
Healthcare expenses include but are not limited to labor costs, patient care supplies and other capital expenses such as depreciation or interest costs. [9] Although total medication costs only amount to 11% of total health care expenditure, “double-digit increases in prescription drug expenditures have been common.” [10]
unlawful channeling of regulated pharmaceuticals from legal sources to the illicit marketplace.”[13]
According to a paper on healthcare diversion by Ann Bittinger and Lorri Hall
Abramowitz, the “non-medical use of prescription painkillers costs more than $72.5 billion each year in direct health care costs.” [14]
Instances of drug theft and loss in hospitals are pervasive and contribute to these high amounts in hospital costs. Recently, a former pharmacy director was charged with diverting 193,376 pills, costing the hospital about $212,000. [15] In another report, a former pharmacy technician was sentenced to prison for stealing $23,475 worth of narcotics. [16] The University of Maryland was fined $500,000 for losing large dosages of OxyContin, a narcotic that reduces pain. [17] These costs can be lessened and even avoided if hospitals can quickly detect and control drug diversion.
Though substance abuse and diversion can occur in many ways and are carried out by different individuals in the general population, drug diversion “is often associated with the misuse of prescription drugs by health care workers.” [13]
Studies have shown that in 1992, approximately 13% – 23% of female physicians and 14% – 23% of male physicians were reported to use prescription opioids. [18] These rates are high when compared to a more recent study of the general population in 2005 where “rates of nonmedical use of prescription opioids in the general population had reached only 4.9%.” [18]
Because healthcare workers are given the responsibility for handling and administering drugs to patients, the impact of substance abuse among these individuals carries greater consequences. Substance abuse among healthcare workers harms the health of patients, the health of the abusers themselves, their fellow healthcare workers, and introduces risk to their employers. [19]
Additionally, because healthcare workers are highly educated about medical treatments and drug use, they often normally opt to self-treat and they are “particularly adept at hiding the symptoms of their addiction.” [12] [18]
Hectic schedules and the work environment tempt healthcare professionals, especially anesthesia providers to take the drugs for their own personal use to relieve pain or stress and to stay alert during long shift hours. [21] Other professionals may divert drugs to supply to other people such as their family members or friends, while some may even divert the drugs to sell to others. [20]
A study of 423 cases of drug diversion by healthcare workers in Cincinnati, Ohio, showed that the type of healthcare workers most involved in drug diversion activities in descending order were nurses, physicians, medical assistants, pharmacists, nursing assistants and physical therapists. [13]
The categories of drugs commonly diverted by these healthcare workers in the Cincinnati study include: opioids, benzodiazepines, barbiturates, and amphetamines and other
stimulants. [13] “In addition, case reports have shown a new trend for abuse of sublingual intravenously administered analgesics (e.g., fentanyl) and anesthetic drugs (e.g., propofol) among healthcare professionals.” [18] The literature also shows that, “the drugs most likely to be abused are those found in everyday anesthesia care because they are easily accessible.” [21]
Additional categories of drugs diverted that are not mentioned above but are found in
anesthesia care include narcotic agonist-antagonists, dissociative drugs and inhalation agents.
[21]
Even in a healthcare setting, diversion can occur in many different ways and at different points in a healthcare supply chain. This reality adds to the complication of detecting
diversion activity. A compilation of how and where diversion occurs is summarized in Table 1.1. Table 1.1 shows that the key activities/places associated with diversion include drug storage, transportation, at patient care and at wastage. The probability of drug diversion is highest in these places and situations because of the conventional and frequent employee access and handling. Though diversion has been reported to happen according to the
key places of diversion can range from one unit of a drug to hundreds and even thousands of units of several drugs, depending on the type of healthcare worker, location of diversion, size of the hospital, patient demands and the diverter’s mental state.
Table 1.1 How and where diversion occurs.
Situation where diversion occurs How does it occur?
While drugs are in storage
A nurse may use another nurses' password to gain multiple access to
the storage area multiple times and then take drugs for personal use.
[20]
At the point of purchase
Whenever orders need to be filled, a pharmacy purchasing manager
may order more products than necessary and get or take the excess
drugs. [22]
During transfer of drugs from
storage to a nursing unit
A pharmacy technician may divert some amount of drug from what
was intended to be delivered to the cabinet of a nursing unit. [22]
Through forging a transaction
A technician may enter a specific patient drug need into the system
but instead of delivering the drug to the patient, the technician
pockets the drug and reconciles the transaction by forging the
signature of the patient. [22]
During preparation of IV
admixtures
A pharmacist may remove a specific amount of drug (multidose
vials) from the cabinet but only use half to create the admixture. The
next time the pharmacist creates the same admixture, the pharmacist
will remove a new amount of drug and pocket the previously opened
vial. [22]
At the patient care area
A nurse may replace the prescribed drug with saline solution while
sedating patients and keep the opioids or sedatives for personal use.
Another example is a radiology technician may “remove the needle
from a syringe, replace it with a smaller gauge needle for
self-injection, and then reattach the original needle to the syringe.” [19]
Actions of addicted providers cause risk to their own health, their career, the patients they care for, and to their employers. Therefore, it is important to prevent and detect diversion to ensure the safety and well-being of everyone involved. Some recommended measures to prevent and motivate early detection of diversion are to incorporate the following procedures for controlling the use of controlled substances: have healthcare providers report a suspected substance abuser, [21] conduct periodic audits and record keeping, [20][22] [23] employ proper documentation, [20] [23] use diversion detection software, [20] conduct drug testing, [24] increase education, programs and training in substance abuse risks, [25] and incorporate treatment and supervised re-entry into the workforce. [25] These methods are all good efforts to prevent and detect diversion; however some may not be as effective as others and may require some improvement and further development. A survey conducted in 2002 finds that increasing “the
control and accounting procedures for controlled substance, as well as increased mandatory education,” [26] has done little to decrease the incidence of drug abuse.
Table 1.2 Some recent and developed systems to detect and screen diversion activities.
Screening and detection efforts Description
1) Analyzing the databases from the
anesthesia information management system (AIMS), pharmacy information
management system (PIMS) and the operating room (OR) information management system (ORIMS). [27]
a. A data mining approach is used to explore potential relationships among data stored in the ORIMS, AIMS and PIMS. b. Diversion behaviour is suspected in the system when there is high usage/wastage of drugs and mismatched
transactions/practices
c. Database queries were then developed using SQL to extract records meeting the specified criteria or area where diversion is suspected.
d. A graphical approach was then performed to identify outliers.
2) Conduct a series of reports on a monthly basis with proactive diversion report. [28]
Studying and reducing variation in healthcare processes can help improve the quality and performance of hospital administration and services. [29] Statistical process control charts plot values along with the mean, upper limit and lower limit to detect unusual variability. [29] Control charts are used to monitor variables in processes, and for testing and validating the effects of new procedures. [29] Some examples in healthcare include monitoring “infection rates, mortality rates, number of patient falls, post-operative lengths of stay, “door-to-needle” times, counts of adverse events, as well as many others.” [29]
There are many types of statistical process control charts but typically, Shewhart control charts such as the and R chart, the and s chart, the individuals control chart and the moving-range control chart are used to monitor process variability. The and R chart monitors the mean of the process while also controlling the range between the process values. On the other hand, the and s chart also monitors the mean of the process but while controlling the standard deviation of the process and is more suitable for sample sizes that are larger than 10 or 12. [30] The moving-range control chart, like the and R chart monitors the range of the process but is suitable for monitoring the performance of a system whose sample consists of individual measurements.
[32] [30]
In a healthcare setting, the and R chart may be used to observe the impact of a new medication on patient health, monitor time-persistent health conditions and study patient survival rates.[31] The moving-range control chart has been used to monitor the proportion of patients that are seen within the four hour Accident & Emergency (A&E) waiting time target.
[32]
Shewhart control charts are not very sensitive to small shifts [30] and may be unable to detect potential drug diversion activity if the diversion rate is very low. Alternatives to the Shewhart charts are the cumulative sum (cusum) control chart and the exponentially
weighted moving average control chart. [30] The cusum and exponentially weighted moving average (EWMA) control charts are especially effective in detecting small process shifts. [30] The use of the cusum chart method was demonstrated in a study on monitoring different variables in individual patients. [33] Among the variables monitored in that study included peak expiratory flow rate in asthma patients and systolic blood pressure in patients with
“simple, low-cost, effective tools with good sensitivity and specificity characteristics.” [33]
Steiner, Grant, Coory and Kelly (2010) explored the application of the EWMA control charts in detecting influenza outbreaks.[34] They found the EWMA method was effective for
monitoring of influenza outbreaks and may be useful “for the rapid detection of other diseases.”[34]
In events pertaining to drug diversion, control charts may be used to scope out values that differ greatly from a normal situation without diversion.
In order to prevent or detect drug diversion activity, it is important to “identify
high-risk/high lethality clinical areas where increased stress and access to controlled substances are consistent features.” [25] In other words, identifying key factors that are high risk for drug diversion also include identifying individuals who are more inclined to divert drugs than others and locations where most diversion happens. In this study these factors are
CHAPTER 2 – METHODOLOGY
The purpose of this study is to create a simulation of the process flow of drugs in the hospital setting and to use simulation data to develop control charts that can help to detect diversion activities. Diversion can occur at different points in a hospital, and drugs may be diverted by more than one type of healthcare worker. The process flow will enable us to systematically identify different factors that may contribute to the likelihood of diversion activity, while control charts will provide visual tools to easily detect potential diversion activities.
The simulation process starts with the arrival of drugs from the distributor or
manufacturer at hospital storage and ends with the usage of drugs on the patients. The model is focused on the process internal to the hospital and does not consider the drug supply chain external to the facility. To build the model, we start by mapping the process flows for each of the three entities: drugs, patients and healthcare workers. In addition to the drug entities, patients are listed as entities because the patients are what drive the demand for the drug entities in the model. Healthcare workers are also entities in the simulation model because the healthcare workers handle, transport and administer the drug entities.
2.1 The Process Flow Model
Before creating the drug process flow, it is important to define the types of the processes to be included in the model. As a guide for this, the following questions were considered:
Where are the drugs being diverted?
When and how do the drugs go from one location to another?
The critical processes were identified by referencing information on drug diversion activities from the literature review as described in Table 1.1.
2.1.1 The Drug Process Flow Model
with connections to the aforementioned points of diversion. At Mayo Clinic, procedures to decrease improper handling of controlled substances started in the Department of
Anesthesiology and with a particular focus on the OR, where the use of anesthetic drugs is prevalent. [19] Later on, these prevention methods were extended to the ER, ICU and other patient care units. [19] In addition to Mayo Clinic’s study, an experienced and Certified Occupational Health Nurse Specialist stated in an article in 2013, that with respect to substance abuse among nurses, “the specialties with the highest prevalence of substance
abuse users are ICU, ER, OR and anesthesia.” [35] Therefore, we considered four hospital areas (OR, ER, ICU and ward) and hypothesized that diversion behaviors would be different depending on the unit due to the patient volume and type of patient care.
Boxes Representation: Drugs kept in pharmacy storage
Drugs are on transport to
Emergency (ER) unit
Drug usage on ER patient Drugs are on transport to ER patient
Drugs kept in ER storage
Distribute to appropriate hospital units
Drugs are on transport to Ward Drugs are on
transport to Operating Room (OR)
Drugs are on
transport to Intensive Care Unit (ICU)
Drugs kept in Ward storage Drugs kept in
OR storage Drugs kept in
ICU storage
Drugs are on transport to ICU patient
Drugs are on transport to Ward patient Drugs are on
transport to OR patient
Drug usage on Ward patient Drug usage on
OR patient Drug usage on
ICU patient Drugs
As shown in Figure 2.1, when drugs arrive in a hospital, they enter the pharmacy/storage unit and stay there. The inventory remains unchanged until either a regular stock
replenishment is completed or a request is made to transfer the drugs to the cabinet of the ER, ICU, OR, and ward units. The hospital has been divided into these four units because the literature most commonly refers to diversion happening in these units. In addition, the amounts and types of drugs being delivered to these units are different. Drugs that are transported to ER, ICU, OR and ward units are kept in the storage at their respective units until they are transported to the patient. When a drug is prescribed for a patient, it is transported to the patient bedside and then administered to the patient.
2.1.2 The Patient Process Flow Model
The patient process model, shown in Figure 2.2, characterizes patient demand with the four hospital units. ER, ICU, OR and ward patients will flow into and out of these four units.
Figure 2.2 Patient process flow model
Patient goes to ER
Patient goes to ICU
Patient goes to Ward
Patient goes to OR Patient receives medication at ER Patient receives medication at OR Patient receives medication at Ward Patient receives medication at ICU Patient is discharged from ER Patient is discharged from OR Patient is discharged from Ward Patient is discharged from ICU Patients
The patient flow model begins with the assignment to units. Note that since a patient’s condition will change according to the severity of the illness and the need for further
treatment, a patient that initially started in the ER, ICU, OR or ward unit may be transferred to another unit for further treatment and observation; but for the purpose of this simulation we will not depict these situations in detail due to lack of information/data. According to the distributions from a 1000-bed hospital in Israel with 45 medical units, 245 patients/day (60% of total patients) arrive into the ER while 161 patients/day (40% of total patients) arrive into other medical units. [36] Currently, there is no data source on the number of patients/day that go into the ICU, OR and ward. However, it will be assumed that 10% of patients will enter the ICU since 10% of inpatient beds are ICU beds. [37] Also, it will be assumed that the number of patients that enter the ICU is the same as OR patients, which leaves the remaining 20% of patients entering to the ward each day. The patient will then receive medication at his or her assigned unit. After receiving medication, the patients will be discharged from their assigned unit. To simplify the analysis of this study, we assumed that each day, all patients that enter the system will leave by the end of the day.
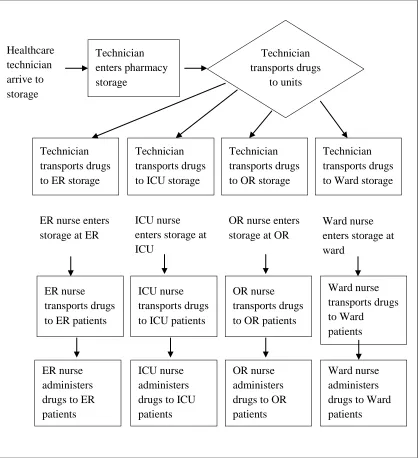
2.1.3 The Healthcare Worker Process Flow Model
Figure 2.3 Healthcare worker process flow model Technician enters pharmacy storage Technician transports drugs to units Technician transports drugs to ER storage
Technician transports drugs to ICU storage
Technician transports drugs to OR storage
Technician transports drugs to Ward storage
ER nurse enters storage at ER
ICU nurse enters storage at ICU
OR nurse enters storage at OR
Ward nurse enters storage at ward
ER nurse transports drugs to ER patients
ICU nurse transports drugs to ICU patients
OR nurse transports drugs to OR patients
Ward nurse transports drugs to Ward patients ER nurse administers drugs to ER patients
ICU nurse administers drugs to ICU patients
OR nurse administers drugs to OR patients
Ward nurse administers drugs to Ward patients Healthcare
Healthcare technicians handle drug inventory at the pharmacy by ordering drugs and transporting drugs from central storage to the smaller storage areas of the hospital units. When drug requests are made for specific hospital units or when regular cabinet unit replenishment needs to be performed, the technicians will transport the drugs from the pharmacy storage to their respective hospital units. In this model, nurses are assigned to the ER, ICU, OR and Ward. When a patient had a need for a drug, the assigned nurses will transport the drug to the patient and then administer the drug to the patient.
2.1.4 The Drug, Patient and Healthcare Worker Process Flow Model
Figure 2.4 Drug, patient and healthcare worker process flow model Drugs kept in
pharmacy storage Distribute drug to hospital units Tech transports drugs to ER
Tech transports drugs to ICU
Tech transports drugs to OR
Tech transports drugs to ward
(2) Drugs kept in storage at ER (2) Drugs kept in storage at ICU (2) Drugs kept in storage at OR (2) Drugs kept in storage at ward ER nurse transports drugs to ER patients
ICU nurse transports drugs to ICU patients
OR nurse transports drugs to OR patients
Ward nurse transports drugs to Ward patients
ER nurse administers drug to ER patients
ICU nurse administers drug to ICU patients
OR nurse administers drug to OR patients
Ward nurse administers drug to ward patients
Assign patients to unit Patient arrives at hospital ER nurse enters ER storage ICU nurse enters ICU storage OR nurse enters OR storage Ward nurse enters Ward storage Drugs arrive by order of tech
Technician (Tech) arrives at storage
Patient is discharged
a)
b)
a) Drug process flow and Healthcare worker process flow sub models b) Patient process flow sub model
Note: The numbers in parentheses, e.g., (3) are defined below.
(1) (1)
(1)
(1) (1) (1)
(1)
(1)
(1) (1) (1)
(3)
(3)
(3) (3)
(3)
(4) (4) (4) (4)
(4) (4) (4) (4)
(4) (4) (4) (4)
Given below is the key to the numbers in Figure 2.4:
(1) Drugs arrive at the pharmacy storage in response to an order bya technician. The drugs are then kept in pharmacy storage until an order is placed for them to be distributed to the ER, ICU, OR or Ward storage units. The technicians are in charge of transporting the requested orders to their appropriate units.
(2) When the drugs arrive at their assigned units, they will stay in the storage until there is patient demand for the drugs.
(3) Patients who arrive at the hospital will be assigned to the different units based on their illness and treatment type. A patient entering a unit signifies a demand for a certain amount of drug.
(4) When there is demand for a drug, the nurses will enter the storage units and then transport the drugs to administer to the patients.
(5)After drugs are administered to a patient by a nurse, the patient will be discharged from the system and the nurse will return to attend to another patient.
2.2 The Process Attributes
Now that the process flow has been created, the model needs to be populated with information and characteristics of the drugs, patients and healthcare workers that will be included as model attributes in the model. The attributes will help to generate the flow of the entities and create metrics of measurement for our control charts.
As shown in Figure 2.4, drugs arrive into the system in response to an order from a technician. The following information about the order is needed for the model:
Type of drug ordered,
Amount ordered, and
Time the order is placed.
Time the drug is transported.
When patients enter the hospital, they will go through diagnosis for their disease type and then are assigned to a unit for treatment. Therefore, the data needed is:
Distribution of the different types of patients, and
Demand for the drug by patient type
Healthcare workers are in charge of ordering, transporting and administrating drugs to the patients. Since different workers have different responsibilities and access to drugs, the different types of healthcare workers need to be designated in the model.
Since it is known that diversion can happen during the transportation of drugs,
information on the amount of diverted drugs at the different points of diversion in the system is needed.
2.3 The Process Values
The final step before creating the simulation process in ARENA is to collect the values on the attributes of the entities.
2.3.1 The Drug Process Values
The study on the diversion of prescription healthcare workers in Cincinnati, Ohio, shows that opioids have the highest rate of being diverted, with the opioid drugs hydrocodone and oxycodone having the highest rates respectively. [13] In this study, we focused on one type of drug – the oxycodone opioid. Oxycodone is available in different forms, and in this study we chose OxyNorm, a form of oxycodone capsules with a starting dose of 5 mg capsules every 4 to 6 hours. [41] Based on the dosage guidelines, it is assumed that, with every patient
receiving 24 hours worth of drug dosage, then every patient that enters the hospital will have a demand for 4 to 6 pills that is, each patient’s request for medication is uniformly distributed
Table 2.1 Drug attributes and values
Unit Patient flow
(%)
Estimated total
drug demand per
unit Beginning drug inventory Order/Transport Policy
Pharmacy 400 total patients/day on average
400 patients/day *DUNIF(4,6) = DUNIF(1600,2400)
3500 pills If drug inventory level at the end of the day goes below 3500 pills, order up to 3500 pills
ER 48% of total
patients/day
48%*400 patients/day *DUNIF(4,6) = DUNIF(768,1152)
1400 pills If drug inventory level at the end of the day goes below 1400 pills, order up to 1400 pills
ICU 13.25% of
total patients/day 13.25%*400 patients/day *DUNIF(4,6) = DUNIF(212,318)
500 pills If drug inventory level at the end of the day goes below 500 pills, order up to 500 pills
OR 13.25% of
total patients/day 13.25%*400 patients/day *DUNIF(4,6) = DUNIF(212,318)
500 pills If drug inventory level at the end of the day goes below 500 pills, order up to 500 pills
Ward 25.5% of
total patients/day 25.5%*400 patients/day *DUNIF(4,6) = DUNIF(408,612)
amounts of drugs in the storage units at the beginning of the next day to fulfill patient demand. Patient flows into the hospital are modeled with a constant arrival rate of 400 patients per day or = 16.667 patients/hour, so patient interarrival times are randomly
sampled from an exponential distribution with a mean of = 0.06 hour. Therefore, with only
one order/transport per day and to ensure that demand is always met, we set the order-up-to and transport amount to be much higher than the expected daily total drug demand at each unit. In addition, the order/transport policies are set to trigger an order during the end-of-the-day inventory check routine, whenever the drug inventory levels go below the order-up-to amount to ensure that the drug inventory levels at the beginning of the next day is always sufficient to fulfill all patient demand. The attribute values for patient flow into the hospital are explained in Section 2.3.2.
2.3.2 The Patient Process Values
As mentioned in Section 2.1.2, approximately 245 of the 406 patients that arrive to an Israeli 1000-bed hospital each day will enter the Emergency. [36] This means that about 60% of patients are assumed to be ER patients and the rest of the patients will go to the ICU, OR and Ward, respectively. It was noted in Section 2.1.2 that of the remaining 40% of patients, 10%, 10% and 20% of patients will go into ICU, OR and ward. In our model, the patient arrivals have been rounded to 400 patient arrivals per day. Table 2.2 shows the values chosen for each patient type.
Table 2.2 Patient attributes and values
Unit ER ICU OR Ward
Distribution of patient type
48% of total patients
13.25% of total patients
13.25% of total patients
25.5% of total patients Demand for
The data in Table 2.2 are derived as follows: as noted above, 60% of patients enter via the ER however, 20% of these (12% of the total) are quickly transferred to other units leaving a total of 48% in the ER. [36] It is assumed that 80% of ER patients received treatment at the ER and leave the system while the 20% transfer from the ER do not receive treatment in the ER but at the next unit. The 20% (12% of total) of patients transferred from the ER will then be admitted into either the ICU, OR or Ward; however no distribution information between these units is available. A distribution has therefore been proposed which assumes that more patients go to the Ward than either the ICU or OR, and that an equal number of patients go to the latter two units. So, of the 12% of total transferred, it is assumed that 5.5% go to the Ward and that 3.25% go to each of the ICU and the OR.
There is no specific published data on the prescribing rate of oxycodone in hospitals, but “the Centers for Disease Control and Prevention analyzed a commercial database of drug prescriptions looking for patterns” and found that opioid prescriptions vary from 82.5 to 143
painkillers prescribed for every 100 people in America. [42]
In the context of this study, we presumed that all 400 patients entering the system have illnesses that require treatment with the medication Oxycodone. Oxycodone capsules are administered to each patient with a starting dose of 5 mg capsules every 4 to 6 hours. [41] Therefore, as mentioned in Section 2.3.1, the demand variable has a demand function of DUNIF(4,6) pills per patient.
2.3.3 The Healthcare Worker Process Values
Table 2.3 Healthcare worker attributes and values
Unit
From Pharmacy to ER, ICU, OR and Ward
ER ICU OR Ward
Type of
worker Technician ER nurse ICU nurse OR nurse Ward nurse Distribution
of worker by Type
5 workers 30
workers 15 workers 15
workers 30 workers
The number of resources in Table 2.3 are chosen with the assumption that all resources are available to do work and to attend to the patients, with the highest number being Ward and ER nurses followed by ICU nurses, OR nurses and Technicians.
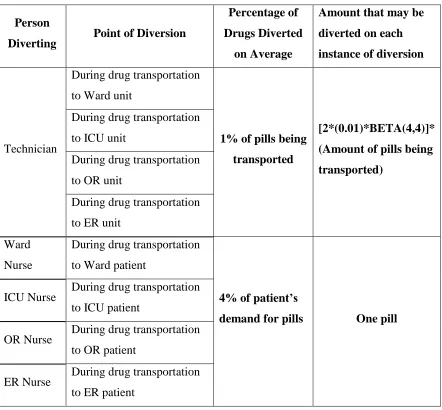
2.3.4 Diversion Values
Table 2.4 Diversion attributes and values for oxycodone
Person
Diverting Point of Diversion
Percentage of
Drugs Diverted
on Average
Amount that may be
diverted on each
instance of diversion
Technician
During drug transportation to Ward unit
1% of pills being
transported
[2*(0.01)*BETA(4,4)]*
(Amount of pills being
transported)
During drug transportation to ICU unit
During drug transportation to OR unit
During drug transportation to ER unit
Ward Nurse
During drug transportation to Ward patient
4% of patient’s
demand for pills One pill
ICU Nurse During drug transportation to ICU patient
OR Nurse During drug transportation to OR patient
ER Nurse During drug transportation to ER patient
points where diversion may occur. Later on, sensitivity analysis on the diversion amount percentage will be conducted to study its effect on detecting diversion activity.
In Table 2.4, it is shown that a technician has an opportunity to divert drugs during the transportation of drugs from pharmacy storage to the storage units at the Ward, ICU, OR and ER. A technician may divert a different number of drugs with every instance of diversion, but it is assumed that on the average, 1% of the amount of drugs being transported is diverted. Since 1% denotes the long-run fraction of drugs diverted on the average during transportation to the storage units, the percentage of drugs diverted at each instance of drug transportation by the technician is assigned as 2*(1%)*BETA(4,4). The assigned percentage has the following probability density function:
Figure 2.5 Probability density function of 2*(1%)*BETA (4, 4)
This setup ensures that E [Percent Diverted] = 1%, StdDev[Percent Diverted] = 2%/6 = 0.333%, and the percent diverted has a bell-shaped density. In other words, every instance when the technician diverts, the amount diverted varies from 0% to 2% of the amount of drugs transported, but the long-run fraction of drugs diverted will average to 1%.
1% 2*1% = 2% probability
0%
The study on the diversion of prescription drugs by healthcare workers in Cincinnati showed that the highest numbers of diverters are nurses. [13] This information is reflected in the model by assuming that the nurses will divert larger amounts of drugs compared with the technicians. Recall from the integrated process flow model in Figure 2.4 that when a patient enters into one of the hospital units, a nurse will go and get the demanded amount of pills from the assigned storage unit to give to the patient. If a nurse diverts, then he or she will take out more pills than necessary from the storage, give the appropriate amount to the patient, and then pocket the excess pills.
In Table 2.4, it is assumed that the percentage of drugs diverted by nurses is 4% of the drugs demanded by the patients. However, since a patient demands only DUNIF (4,6) pills each time, it is unreasonable for the nurse to divert 4% on each instance because that will amount to less than a quarter of a pill. On the other hand, it is also unreasonable for a nurse to divert more than one pill on each instance because higher amounts will cause suspicion. Therefore, a nurse will only divert one pill on each instance. Keep in mind that there are many instances where a nurse can divert since, every patient that enters the hospital creates an opportunity for diversion. Since the average percentage of drugs diverted by a nurse is assumed to be 4% of patient demand and one pill is diverted when a nurse diverts, then a nurse will not divert at every opportunity but in the long run, (total number of drugs diverted)/ (total number of drugs demanded by patients) = 4%. Just like in the case for the diversion by the technician, a sensitivity analysis on the average percentage diverted by nurses will be conducted to study the effects of different diversion amount percentages on the ability of control charts to detect diversion.
2.4 The ARENA® Model
The submodel in Figure 2.6 was created to generate the daily drug inventory levels of the Pharmacy, ward, ICU, OR and ER, at the end of each day. Day-end drug inventory levels on days without diversion are measured and used to construct the statistical process control charts. If diversion happens, the drug inventory levels will be lower than the average drug inventory levels with no diversion because more than the necessary amount of drugs will be taken out from inventory to fulfill patient demands. The drug inventory levels on days with diversion activities are plotted onto control charts and then the control charts will be
evaluated on their ability to detect this shift on drug inventory levels. Section 2.5 and Section 3 will explain the methodology behind the construction of control charts with the day-end inventory levels. Since this submodel is only created to record inventory, it is independent from the other submodels and does not affect the drug, patient and healthcare worker process flows in the system.
The second sub model is shown in Figure 2.7. This next sub model creates the arrival of drugs into the hospital system.
The first module in Figure 2.7 is the arrival of drugs into the Pharmacy storage. As written in Table 2.1, the drug inventory level in the Pharmacy at the beginning of the first day is 3500 pills. Every day, drugs are taken out from the Pharmacy to distribute to the Ward, ICU, OR and ER. Therefore, at the end of the day, a Pharmacy inventory check is done to ensure that there are enough drugs in the inventory to fulfill the next day’s hospital unit demands. If
the day-end inventory level drops below 3500 pills, then a new order of drugs will arrive into the system to fill the pharmacy up to 3500 pills. However, if the day-end inventory level is not below 3500 pills, there will be no new arrival of drugs into the hospital. The amount that determines the need to place an order is the same as the order-up-to amount because we want to ensure that on every day, demand is always met and that inventory will never go below zero. After the decision regarding the order of drugs is made, the Pharmacy inventory will be updated with either the arrival or non-arrival of drugs.
The next submodel involves the transportation of drugs from Pharmacy to the storage units at the Ward, ICU, OR and ER.
Figure 2.9 Ward daily inventory update submodel
Similar to Figure 2.7, Figure 2.8 shows the arrivals of drugs into the Ward, ICU, OR and ER unit. Since the flow of drugs from the Pharmacy to the different storage units are similar, only the transition of drugs into one of the units will be demonstrated. In Figure 2.9, the flow of drugs from Pharmacy storage to the Ward storage unit is shown. The drug inventory level in the Ward at the beginning of the first day is 800 pills. Every time a patient enters into the ward, DUNIF(4,6) pills are taken out of the ward inventory to supply to the patient. A Ward inventory check at the end of the day is necessary to ensure that the amount of pills in the Ward inventory will be sufficient to fulfill the next day’s patient demands. Similar to the order policy at the pharmacy storage, if the day-end Ward inventory level drops below 800 pills, then a technician will transport the sufficient amount pills from the Pharmacy to the Ward to bring the Ward inventory up to 800 pills. However, if the day-end Ward inventory level is not below 800 pills, no drugs will be transported to the Ward.
of drugs being transported). If diversion has occurred, the Ward inventory will have fewer drugs than the intended amount. This situation is represented by subtracting the diverted amount from the Ward inventory.
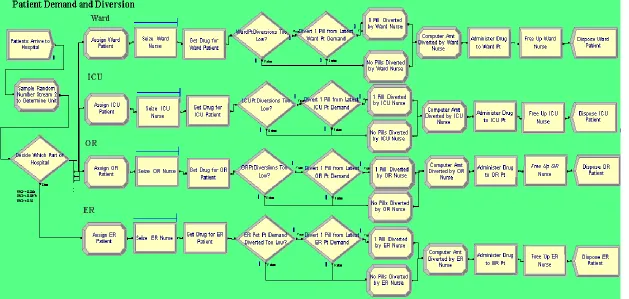
Figure 2.11 Ward patient process flow and demand submodel
In Figure 2.10, the patients arrive into the system with interarrival times sampled from the exponential distribution with mean of 0.06 hour so that the expected number of arrivals is 400 patients / day. From Table 2.2, it was assumed that 48% of patients that arrive will go to the ER, 25.5% to the Ward, 13.25% to the ICU and 13.25% to the OR. The drugs that were transported to the Ward, ICU, OR and ER units stay in storage until a patient demand for the drug is realized and the order is dispensed. Patient demand is created by the flow of patients into the system. The next processes that follow are similar for each unit.
In the example of the patient flow in the Ward unit in Figure 2.11, every patient that enters will generate a demand of about 4 to 6 pills. The ARENA expression
minutes. The amount taken out should be subtracted from the ward inventory. Next, the Ward nurse will administer the drug to the ward patient and this usually only takes about 5 minutes. After the drug is administered to the patient, the patient leaves the system and the nurse is released to attend to another patient.
Diversion by a nurse may happen during the transportation of drugs from the Ward storage unit to the patient’s bedside. Every instance when diversion occurs, the nurse will
take out one additional pill on top of the required demand amount and pockets the extra pill. In Section 2.3.4, it is assumed that in the long run, the nurse divert up to 4% of the pills demanded by patients. The following describes the diversion of pills by a nurse:
(1) When a nurse goes to get pills for the patient, he or she will go through a decide module that calculates the ratio of the current accumulated number of pills diverted over the current accumulated number of pills demanded. This decision variable will help the model decide whether the current percent of drugs diverted are above or below the assumed 4% value.
(2) If the current percent of diverted drugs is above 4%, then no drugs will be diverted since the target percent is met.
(3) However, if the current percent if below 4%, then another decide module will appear where a probability for diversion will be calculated to make the final decision to divert or not. The probability for diversion is 0.055-(number of pills diverted/number of pills demanded)/0.055. The 0.055 value was chosen based on trial and error to result in drug diversion totaling approximately 4% of demanded pills in the long run. (4) Based on the probabilities to divert, the nurse will either divert one pill or not divert
anything. If a nurse diverts, one pill will be subtracted from the ward inventory. Although this diversion scheme is admittedly ad hoc, it provides some chance for diversion of a pill on each instance in which the nurse must remove pills from Ward storage and
Since inventory carries over to the following day, the simulation model will only create one replication with a run length of several months.
2.5 Control Charts
Since control charts are useful in detecting process variability, we will plot the simulated statistical results onto control charts to analyze the effectiveness of the statistical methods in detecting drug diversion activities. The statistics that are generated from the simulation in ARENA® are the daily values of the inventory levels at the Ward, ICU, OR and ER storage. The inventory levels are the metrics of measurement in the control charts and represent the average number of units in inventory. Initially, we simulate the ARENA model under the assumption that no diversion has occurred. The simulated results without diversion are important to create a baseline model to generate lower and upper control limits as well as average inventory levels of the daily drug inventory levels. After creating the baseline model parameters, we will simulate the ARENA® model with diversion and plot the statistic results onto the baseline model control charts. Variability in the drug inventory level plots,
especially inventory values that go below the lower limits of the baseline model inventory levels, may represent potential drug diversion activity.
As mentioned in the Chapter 1, there are many types of statistical process control charts; and we will introduce the methods involved in the construction of the baseline model for the following control charts: (i) the Shewhart control chart for individual units, (ii) the moving-range control chart, and (iii) the tabular cusum control chart. The and R chart and the and s chart are unsuitable since our daily samples consists of individual day-end drug inventory levels. The performance of the EWMA control chart is reported to be approximately equivalent to that of the cusum control chart, and in this study it was decided to utilize the cusum method. [30]
days. The baseline model was developed on a Shewhart control chart for the individual ward drug inventory levels using the methods described below:
“In many applications of the individuals control chart, we use the moving range two
successiveobservations as the basis of estimating the process variability.” [30] The process average, which is the center line and the limit parameters on the chart are calculated by Equation (2.1) [31]:
(2.1)
In Equation (2.1), n represents the sample size, is the average of all x values, is the moving range between observations i and i-1 where i = 1,2,…,n, and is the average of all moving ranges. The value of L in Equation (2.1) is the distance from the process average to the control limits and is measured in standard deviation units. Since the moving range is calculated for two successive observations, the constant is 1.128.
Table 2.5 Simulation results of ward inventory for 180 days without diversion
Day
Month
1 2 3 4 5 6
1 323 259 264 231 341 218
2 230 321 325 260 281 285
3 217 205 285 238 305 170
4 260 257 252 268 364 239
5 298 281 287 171 219 322
6 356 313 289 266 279 225
7 236 262 309 297 378 262
8 310 355 269 313 330 390
9 267 282 267 304 338 294
10 335 165 318 217 342 301
11 278 350 265 208 335 267
12 244 381 236 339 280 325
13 305 341 312 260 287 284
14 323 351 330 355 363 254
15 341 266 334 280 230 239
16 319 345 281 266 374 320
17 322 286 141 259 276 291
18 235 285 255 252 305 290
19 416 301 275 276 350 337
20 144 278 249 292 241 320
21 287 341 308 233 259 260
22 300 378 373 250 315 248
23 415 285 394 281 272 310
24 315 272 256 293 264 281
25 297 209 286 258 242 239
26 321 274 219 333 291 281
27 388 302 204 282 230 319
28 353 214 344 254 248 274
The baseline model for the expected drug inventory levels of Ward drugs will be created using six months’ worth of simulated data. Referencing Table 2.5 and the formulas in Equation (2.1), the parameters of the baseline model on the Shewhart chart are:
= 13 and so on.
Since diversion activities correspond to drug inventory levels that go below the lower limit, we do not need to plot the upper control limit. The value for L is chosen based on the assumed value, the average run length before a false alarm occurs when the process is in control. Assuming that the hospital administration performs a scheduled check for an out-of-control condition every 90 days, we set the value to 90 days. We will demonstrate how L is chosen in Section 2.5.4.
Table 2.6 Simulation results of the ward inventory for the seventh and eighth month with diversion
Day
Month
7 8
1 254 176
2 267 285
3 121 292
4 246 254
5 329 259
6 343 282
7 308 234
8 162 279
9 236 237
10 300 269
11 233 306
12 261 173
13 197 294
14 245 283
15 270 325
16 256 301
17 243 267
18 218 179
19 314 388
20 293 227
21 236 259
22 189 254
23 221 382
24 363 285
25 300 205
26 237 270
27 278 220
Table 2.6 is generated by taking the last 60 values (seventh and eighth months) from the simulation process model for 240 days. This data has been plotted on the Shewhart chart that was generated with the baseline model limits and means that had been calculated previously, see Figure 2.12. We will study the results of the Shewhart control chart in Section 3.1.
Figure 2.12 Shewhart control chart for individual measurements of ward inventory
2.5.2 The Moving-Range Control Chart
The individuals control chart was applied by using the moving range two successive observations as the basis of estimating the process variability. Therefore, the moving-range control chart is to be used together with the Shewhart control chart for individual
measurements. If either the Shewhart or the moving-range control chart has a point out-of-control, then diversion is suspected at that point. The lower and upper limits of moving range control chart parameters are shown in Equation (2.2) [30]:
0 50 100 150 200 250 300 350 400 450
1 3 5 7 9 11 13 15 17 19 21 23 25 27 29 31 33 35 37 39 41 43 45 47 49 51 53 55 57 59
Number of pills in inventory
Days
Shewhart Control Chart for Individual Measurements for ward drug with diversion in month 7 and 8
(2.2)
For a moving range of n = 2 observations, is 3.267 and is 0. The and values chosen are the tabular values based on 3 standard deviations. Since the moving-range control chart is to be used together with the Shewhart chart, the parameters on the moving-range chart has not been altered to reflect a specific value.
Recall from the previous section that is 55.16. The limit parameters of the moving range control chart based on the data in Table 2.5 are then calculated using Equation (2.2):
Now, just like for the Shewhart control chart, the simulated seventh and eighth month’s data for Ward inventory with diversion (Table 2.6) is plotted on the moving-range control chart that was generated with the baseline model limits and moving range mean that had been calculated previously, see Figure 2.13. The control chart in Figure 2.13 will be explained in Section 3.1.
0 50 100 150 200 250
1 3 5 7 9 11 13 15 17 19 21 23 25 27 29 31 33 35 37 39 41 43 45 47 49 51 53 55 57 59 Moving
Range
Day
2.5.3 The Cumulative (Cusum) Control Chart
Cusum charts are appropriate to model the results from this study especially to detect diversion because they are sensitive to small changes in the inventory levels. Below, it is demonstrated how to develop the cusum charts for the inventory level of ward drugs presented in Table 2.6.
Unlike in the Shewhart control charts where the data from Table 2.5 and 2.6 are directly plotted onto the control charts, the plots on the cusum charts are the cumulative sum,
values. The one-sided upper and lower cusums of the tabular cusum chart are computed with 2.3 [30]:
(2.3)
Note that potential diversion activity is identified when the inventory values go below the lower limits of the average inventory levels. Therefore, we are only considering the
computation of the lower cusums, . In Equation (2.3) the K value “is usually called the reference value (or allowance, or the slack value).” [33]
“If either or exceed the decision interval H, the process is considered to be out of control.”[33]
A fair value for the interval H “is five times the process standard deviation,” [33]
but we will discuss more about the selection process of the H value in Section 2.5.4. It is known that , the target mean is . Moreover, is the mean of the out-of-control process we are detecting, and
are seeing if the cusum control chart can detect diversion when diversion is present in the Ward, so we apply the cusum calculation to the ward drug inventory levels in months 7 and 8 from Table 2.6.We computed the lower cusums with Equation (2.3) as follows:
,
and so on.
The tabular cusum bar chart of ward drugs in Figure 2.14 plots the values for the values from Table 2.6 with an H value of 317.51. We will study the results of the tabular cusum control chart in Figure 2.14 in Section 3.1.
0 200 400 600 800 1000 1200 1400 1600
1 3 5 7 9 11 13 15 17 19 21 23 25 27 29 31 33 35 37 39 41 43 45 47 49 51 53 55 57 59 Ci
-Days
Tabular Cusum Bar Chart for Ward drugs with diversion in month 7 and 8
2.5.4 The Average Run Length (ARL)
As supplements to the control charts, we want to calculate the average run length (ARL) values, where represents the expected number of samples taken before a false alarm is detected and represents the expected number of samples taken before a shift is
detected. [30] We will later on compare the ARL values of each chart type as well as compare the ARL values to the actual performance of the control charts in detecting diversion.
Shewhart charts with “the conventional three-sigma limits on the charts,” [30] will have an approximate value of 370. The = 370 value implies that the in-control process will expect a false positive every 370 days. However, an value of 370 days is too long and may not exactly apply to our study. Therefore, it is assumed that the hospital
administration performs a scheduled check for out-of-control condition every 90 days so we set the value to 90 days. We are only interested in drug inventory values that go below the lower limit so the one sided values for Shewhart charts are calculated as follows:
In the case for the Shewhart chart, the value will be calculated as follows:
Since days, we set
and solve for L. In the case for the Shewhart
Recall from Section 2.5.3 that we had chosen to be 3% away from the mean.
The approximation for the ARL value for the tabular cusum chart is defined by Equation 2.4.
for the upper one-sided cusum , (2.4)
for the lower one-sided cusum
To calculate , we set and then calculate with Equation (2.4). Recall in Section 2.5.3 that a reasonable value for H is 5 .[31] However, for the Ward drug inventory data in Table 2.6 with the baseline data of Table 2.5, setting the h value to 5 will yield:
For
and
, a value of:
The value of 55.94 is not consistent with the = 90 value for Shewhart charts so we are unable to compare the performance of the control charts. We need to adjust the H value of the tabular cusum chart to reflect a value of 90. We found that setting the H value to will reflect an approximate value of 90 days. Now, we calculate the value using h = 6.31.
CHAPTER 3 – RESULTS
Now that the use of the control charts has been established, the control chart results for the inventory levels at each storage unit will be shown. Since the inventory level at each storage unit is different, it was decided to create charts for each unit. Based on these results comparisons can be done to determine which chart is most appropriate to model the behavior of the inventory levels.
For the case in which diversion occurs with some probability at all the points of risk, 180 days were simulated, where the first 180 days represent 6 months of inventory value without diversion and the last 60 days represents diversion happening in the 7th and 8th month. Therefore, the first 180 days will be the baseline model in studying the diversion in the 7th and 8th month. We plot the values in the 7th and 8th month onto the control charts and will then compare to figure out which chart most appropriately detects diversion behavior.
3.1 Ward Drug Inventory Levels
Figures 2.12, 2.13 and 2.14 showed the Shewhart control chart for individual
measurements, moving-range and tabular cusum control chart of Ward drugs inventory with diversion happening in the 7th and 8th month. For an value of 90 days, the Shewhart chart in Figure 2.12 showed that almost all of the drug levels are within the control limits. Diversion was only suspected on three day-end inventory points. The moving-range control chart in Figure 2.13 showed a large spike on Day 49 that was not indicated in the Shewhart control chart. However, we compare this spike to its relative value on the Shewhart chart and found that the spike is actually an increase in drug ward inventory level from the previous day, indicating that diversion may have happened on the previous day, Day 48. Combining the results from the Shewhart and the moving-range chart, it was seen that four day-end Ward drug inventory points showed potential drug diversion activity. In the moving –range control chart, we see that there is a lot of variability between the day-end Ward drug
Shewhart chart does not perform well in detecting out-of-control values when the shift size is small and when the plotted values have large variability.
In contrast to the Shewhart control chart, the tabular cusum control chart suspected diversion activity on almost all of the day-end ward drug inventory levels. For a value of 90, the H value for the cusum chart is computed to be 317.51. After comparing the
computed values against H = 317.51 we found that 58 days out of the 60 days that were plotted onto the control chart were showing positives for diversion.
We had demonstrated in Section 2.5.4, the methods to calculate the for the Shewhart chart and the cusum chart. refers to the expected number of inventory samples taken before a diversion is detected for a process that has diversion. The size of shift we want to detect is 3% of the mean of the drug inventory levels. The calculated the value for the Shewhart chart and the tabular cusum chart are placed it into Table 3.1.
Table 3.1 Performance of the Shewhart and tabular cusum control charts on ward drug inventory with diversion in month 7and 8
Control Chart for Ward Drug
Inventory with diversion in
month 7 and 8
ARL1 Total Number of Detected
Diversion Activity
Shewhart and Moving-Range 58.03 days 4 day-end inventories
Tabular Cusum 38.01 days 58 day-end inventories
3.2 ICU Drug Inventory Levels
Figures 3.1, 3.2 and 3.3 show the Shewhart control chart for individual measurements, the moving-range and the tabular cusum control chart of ICU drugs inventory with diversion happening in the 7th and 8th month.
Figure 3.1 Shewhart control chart for individual measurements of ICU inventory
0 50 100 150 200 250 300 350
1 3 5 7 9 11 13 15 17 19 21 23 25 27 29 31 33 35 37 39 41 43 45 47 49 51 53 55 57 59
Number of pills in inventory
Day
Shewhart Control Chart for Individual Measurements ICU drugs with diversion in month 7 and 8
Figure 3.2 Moving-range control chart of ICU inventory
Figure 3.3 Tabular cusum control chart of ICU inventory 0
50 100 150
1 3 5 7 9 11 13 15 17 19 21 23 25 27 29 31 33 35 37 39 41 43 45 47 49 51 53 55 57 59 Moving
Range
Day
Moving-Range Control Chart for ICU drugs with
diversion in month 7 and 8
Moving Range Moving Range Average UCL
0 100 200 300 400 500 600 700
1 3 5 7 9 11 13 15 17 19 21 23 25 27 29 31 33 35 37 39 41 43 45 47 49 51 53 55 57 59 Ci-
Day
Tabular Cusum Bar Chart for ICU drugs with diversion in month 7 and 8