Evolution of Multilocus Genetic Structure in an Experimental
Barley Population
R.
W. Allard,* Qifa Zhang? M. A. Saghai Maroof* and 0. M. Muonas
*Department of Genetics, University of Calfornia, Davis, Calqornia 9561 6, +Biotechnology Center, Huazhong Agricultural University, Wuhan 430070, People’s Republic
of
China, $Department of Crop and Soil Environmental Sciences, Virginia PolytechnicInstitute and State University, Blacksburg, Virginia 24061, and #Department
of
Genetics, Universityof
Oulu, SF-90570, Finland Manuscript received September 16, 199 1Accepted for publication May 2, 1992
ABSTRACT
Data from 31 1 selfed families isolated from four generations (Fa, Fls, Fz5, F45) of an experimental barley population were analyzed to determine patterns of change in character expression for seven quantitative traits, and in single-locus allelic frequencies, and multilocus genetic structure, for 16 Mendelian loci that code for discretely recognizable variants. The analyses showed that large changes
in single-locus allelic frequencies and major reorganizations in multilocus genetic structure occurred
in each of the generation-to-generation transitions examined. Although associations among a few traits persisted over generations, dynamic disassociations and reassociations occurred among several traits in each generation-transition period. Overall, the restructuring that occurred was characterized by gradual decreases in the number of clusters of associated traits and increases in the number of traits within each cluster. T h e observed changes in single-locus frequencies and in multilocus genetic structure were attributed to interplay among various evolutionary factors among which natural selection acting in a temporally heterogeneous environment was the guiding force.
G
ENETIC changes associated with the evolution of adaptedness have been studied in detail in experimental populations of several species of culti- vated plants and also in natural populations of the wild ancestors of these domesticated species (reviews in ALLARD 1965, 1975, 1977, 1988, 1990; ALLARD,JAIN and WORKMAN 1968; and references cited in these reviews). Composite cross I1 (CCII), an experi- mental population of cultivated barley (Hordeum uul- gure ssp. uulgure), has been studied most intensively. CCII was synthesized in 1928 by pooling equal num- bers of F2 seeds obtained by selfing F1 hybrid plants
derived from the 378 possible pairwise intercrosses among 28 barley cultivars chosen to represent all of the major barley growing areas of the world (HARLAN and MARTINI 1929). This population has subsequently been grown annually at Davis, California, under stand- ard agricultural conditions. Each generation was al- lowed to reproduce by its natural mating system (-99% of selfing and one percent of outcrossing, WAGNER and ALLARD 1991), harvested in bulk at maturity without conscious selection, and the next generation sown from a random sample of seeds from the previous harvest. Two other broadly based exper- imental populations of barley, CCV and CCXXI, which differ from each other and from CCII in par- entage and in method of synthesis, have also been studied in detail with respect to allelic frequency changes which occurred over generations at a number of Mendelian loci that code for discretely recognizable
Genetics 131: 957-969 (August, 1992)
variants, as well as for numerous continuously distrib- uted quantitative traits often supposed to be compo- nents of adaptedness. Observed genetic changes in each trait followed closely similar patterns in all three populations. Population size exceeded 15,000 repro- ducing adults in each generation; consequently statis- tically significant genetic changes that occurred in the populations are attributable to natural selection and not to genetic drift.
958 R. W. Allard et al.
tions were parallel to increases in grain yield, deter- mined by measuring grain yields in replicated plot trials, repeated several years, and comparing the grain yields of early, intermediate and late generations of the experimental populations with the grain yields of several widely grown commercial cultivars entered as standards in the same nurseries. Measurements made on other quantitative traits indicated that changes in the direction of shorter and more compact spikes were also steadily unidirectional but that changes in all other quantitative traits, e.g., height, flowering time, awn length and culm thickness, were erratic in direc- tion and not significantly correlated with fecundity as measured by number of seeds/spike and spike weight.
CCII, CCV and CCXXI have also been studied intensively with respect to single-locus allelic and gen- otypic frequency changes at more than 20 loci that code for discretely recognizable variants, including morphological variants, resistance us. susceptibility to specific pathotypes of diseases, allozyme variants and DNA restriction fragment variants (e.g., JAIN and AL- L A R D 1960; ALLARD and KAHLER 1971, 1972; AL-
LARD, KAHLER and WEIR 1972; KAHLER 1973; SAG-
and ALLARD 1986; ALLARD 1988). These studies showed that alleles present in very high frequencies in the parents of these experimental populations con- sistently remained in high frequency into advanced generations of the populations; this suggests that these prominent alleles are “generalist” alleles favored in virtually all environments worldwide. Patterns of pop- ulation behavior were different, however, for loci that were moderately to highly polymorphic in the parents of the experimental populations: frequency changes of the more frequent alleles of such loci exceeded two standard error units in approximately one-half of sin- gle-generation transitions and very large single-gen- eration frequency changes (>5 SE units) were common for the more frequent alleles of such loci in the Davis environment. Also single-generation allelic frequency changes for alleles of the highly polymorphic loci were often in opposite directions and correlated with an- nual environmental fluctuations, especially with shifts from conditions of drought to conditions of ample rainfall, and vice versa. Reversals persisting for two o r sometimes several generations were also observed; such patterns were also often associated with periods in which two or more years of drought alternated with several years of more or less ample rainfall. These results suggested that specific alleles of the polymor- phic loci have pleiotropic effects on one or more physiological processes that affect survivability and/ o r reproductive success under specific environmental circumstances and that alternative alleles have favor- able pleiotropic effects under differing environmental circumstances. This hypothesis was tested by extensive HA1 MAROOF et al. 1984; WEBSTER, SAGHAI MAROOF
progeny testing of selfed families, and also of iosgenic lines, each descended from single plants extracted from early, intermediate or late generations of CCII or CCV. Comparisons between alternative homozy- gous variants of single Mendelian loci revealed that specific alleles of morphological, allozyme and disease resistance ‘us. susceptibility loci had statistically signif- icant effects on the expression of several quantitative traits, including ability to survive to reproductive ma- turity and the number of seeds produced/spike by the surviving plants. Thus each Mendelian locus tested was, in addition to the descriptive effects for which it was named, also a locus for several quantitative traits. These pleiotropic effects often varied significantly in magnitude, and sometimes in direction in different years, so that testing of alternative alleles in more than one year was required to obtain reliable estimates of the pleiotropic effects of a given locus. Such testing revealed that superior ability to survive to reproduc-
tive maturity, that larger numbers of seeds/spike, and that greater weight of spike were nearly always posi- tively associated with alleles that increased in fre- quency under population conditions in the same year.
No other quantitative traits were consistently associ- ated with increases in allelic frequencies.
It is also well documented that barleys from differ- ent ecogeographical regions nearly always differ sig- nificantly from one another in multilocus genetic structure (e.g., WARD 1962; BROWN, FELDMAN and NEVO 1980; KAHLER and ALLARD 198 1 ; ZHANG, SAG-
HAI MAROOF and ALLARD 1990; ALLARD et al. 1990, SAGHAI MAROOF, ALLARD and ZHANG 1990). Studies of the population dynamics of experimental popula- tions of cultivated barleys have brought to light a number of additional features of multilocus genetic structure, among which the following are particularly germane to the present study: (1) statistically signifi- cant nonrandom associations among alleles of differ- ent loci developed within a few generations in each of the populations studied (e.g., WEIR, ALLARD and KAH-
LER; 1972, 1974, CLEGG, ALLARD and KAHLER 1972; ALLARD 1975, 1977, 1988); (2) the internal structure of two-locus, three-locus, four-locus and five-locus associations frequently changed over generations,
and Canada, or to locations in California that are
more xeric or m o r e mesic than Davis, developed
multilocus structures different from that of Davis within a few generations, e.g., the four-locus gametic type for esterase loci 1 , 2, 3 a n d 4 shifted in the direction of the gametic type that is most common of
the North Plains region, whereas the four-locus ga-
metic types that are favored in years of drought vs.
ample rainfall in Davis increased in frequency in sub- populations transferred to xeric and mesic sites, re-
spectively, in California (ALLARD 1988; JANA, ZHANG
and SAGHAI MAROOF 1989). Similarly quantitative traits shifted in degree of character expression, e.g.,
toward earlier maturity, shorter stature and smaller kernel size in xeric California habitats and toward later maturity, taller stature and larger kernel size in mesic Californian habitats.
O u r goal in the present experiment was to obtain a comprehensive profile of the evolution of multilocus structure in CCII through simultaneous analyses of genetic change for numerous diverse traits over 45
generations. We selected 22 traits, each of which had been investigated in detail in previous studies, for inclusion in the present study. Our results show: ( 1 )
character expression for most of the seven quantita- tive traits studied changed significantly over genera- tions indicating that these traits were affected by
natural selection;
(2)
that at least 14 of 15 discretely inherited traits were under strong directional selec- tion; (3) that nonrandom associations among traits h a d developed by generation Fs; (4) that major reor-ganizations of associations among traits occurred in generation transitions Fs t o Fl3, Fl3 t o F23 a n d F23 t o
Fd5. Overall these reorganizations led to increases in the number of traits in each cluster of associated traits accompanied by decreases in the number of clusters. We concluded that the changes in quantitative trait expressions, in allelic frequencies of Mendelian loci governing discretely recognizable variants, as well as changes in multilocus population structure, resulted from complex interplay among several evolutionary factors, among which natural selection acting in t h e temporally heterogeneous environment of Davis was the guiding force in organizing the allelic resources o f CCII into increasingly larger multilocus complexes that enhance overall population fitness.
MATERIALS AND METHODS
The genetic materials of this study were 31 1 families derived from random samples of stored kernels of genera- tions F g , F13, F23 and Fq5 of CCII. Kernels of these genera-
tions were planted at wide spacing (30 X 30 cm) in a field nursery to minimize opportunity for intercrossing between plants and to optimize the number of kernels produced by each plant. Each plant was allowed to reproduce by its natural mating system of self pollination and, at maturity, all kernels were harvested from individual plants and kept separate to establish 80 self-fertilized families derived from
each generation Fs, Fls, FZ3 and F45. Each of these families was subsequently progeny tested to characterize it for the
22 characters described in the following sections. Ultimately the number of families with complete records for all 22
characters were 80, 77, 78 and 74 for generations F8, Fls,
Fzs, and F45, respectively.
Quantitative character: Quantitative character expres- sion was calculated from measurements made on single plants grown in replicated field plantings (2 blocks/family), repeated in two successive years. Each block (replicate) contained 17 plants of each family, spaced at intervals of 30
cm in rows 30 cm apart in the first year, and 10 plants of each family planted at the same spacing in the second year. The quantitative characters measured were: ( 1 ) heading date (date of emergence of the first spike of each plant, measured as number of days after March 23); (2) the number of reproductive tillers produced by each plant; (3) plant height (height in cm of the tallest tiller); (4) spike length (cm); (5) number of spikelets/row; (6) grain yield (weight of kernels/plant, g); and (7) kernel size index (g/100 kernels). The data were subjected to a standard analysis of variance in which the effects of replications, test years, generations and families, and interactions among these main effects on the expression of each of the seven quantitative traits were computed and tested for statistical significance. Correlation analyses were based on family means obtained by summing the values of the 54 plants within each family and dividing by the number of plants. Measurements made under exper- imentally convenient wide spacings, such as those of the present experiment, often differ from measurements made on plants grown in dense stands in which plant-to-plant competition is intense. Thus the changes in quantitative character expression observed in the present experiment, as well as the correlations between pairs of quantitative char- acters with each other and with discretely inherited traits, may not reflect accurately patterns of change as expressed in the dense plantings in which CCII evolved.
Morphological variants: All adult plants in our field plantings were also scored for phenotype for the following morphological variants (the first named variant is dominant and the second recessive in each case): blue ( B l ) vs. non-blue
(61) aleurone color (located on chromosome 4 ) ; rough ( R )
us. smooth ( r ) awn (chromosome 7); long ( S ) vs. short-haired
(s) rachilla (chromosome 7); two-row ( V ) vs. six-row ( v ) spike (chromosome 2 ) . As expected, nearly all families were uni- form (homozygous) for one of the alternative variants for each locus but about 2% of families segregated in ratios of approximately 3: 1 for dominant us. recessive variants. These three types of family were classified, respectively, as homo- zygous dominant, homozygous recessive, or heterozygous for each of the four loci.
Reaction to scald disease: Two-week-old seedlings of each family were inoculated in a mist chamber with one or another of four pathotypes (races 40, 61, 72, 74) of Rhyn- chosporium secalis (the fungus that causes scald disease), following the methods of JACKSON and WEBSTER (1976). Individual seedlings were scored to determine the family reaction (homozygous resistant, homozygous susceptible or segregating) to each of the four races. Resistance vs. suscep- tibility to races 40, 61 and 74 is governed by a single Mendelian locus (resistance dominant to susceptibility for races 40 and 74 but recessive for race 6 1 ) whereas resistance us. susceptibility to race 72 is governed by a pair of loci: individuals with at least one dominant allele at each locus
(RI-R2-) are resistant, whereas individuals with genotypes
R I - ~ z ~ z , rIrIR2- and rIrIrzrz are susceptible (GURUSINGHE
960 R. W. Allard et al.
as homozygous resistant, homozygous susceptible or segre- gating in ratios of approximately 3R: 1 s for races 40 and 74 and 3s: 1 R for race 6 1. Individuals resistant to race 72 were infrequent in all four generations of CCII studied and all families within which resistant plants were observed segre- gated in a ratio of approximately 9R:7S, indicating that each of these families was heterozygous for both of the two resistance alleles. The loci governing resistance vs. suscep- tibility to races 40, 61 and 74 are loosely linked on chro- mosome 3. The two loci governing resistance to race 72 segregate independently of each other and the three other resistance loci; the chromosome locations of this pair of complementary loci are not known.
Allozyme variants: Seedlings of each family were assayed electrophoretically for four esterase loci ( E s t l , EstZ, Est3, Est4) (KAHLER and ALLARD 1970) and for acid phosphatase locus Acpl (KAHLER, HEATH-PAGLUISO and ALLARD 1981). Sample sizes permitted families to be classified unambigu- ously (probability 0.01) as homozygous or heterozygous for specific variants of these codominant loci. E s t l , Est2 and
Est3 are very tightly linked on chromosome 3 (Est24-0,003+ Est1+0~004X-+Est3), whereas Est4 is on chromosome 1 and
Acpl is on chromosome 6 .
Ribosomal DNA (rDNA) variants: Seedlings of each family were assayed for phenotype for two Mendelian loci,
R r n l and R m 2 which code for 12 and 8 alleles, respectively (SAGHAI MAROOF et al. 1984; ALLARD et al. 1990). Sample sizes were adequate to allow each family to be classified unambiguously (probability 0.01) as homozygous or heter- ozygous for specific codominant alleles of these two loci.
R r n l and R m 2 are located on chromosomes 6 and 7, re- spectively.
In summary the 22 traits studied were: (trait 1) heading date; (2) tillers/plant; (3) plant height; (4) spike length; ( 5 )
spikelets/row; (6) yield; (7) kernel size; (8) E s t l ; (9) EstP; ( 10) Est3; (1 1) Est4; (1 2) Acp 1 ; (1 3) reaction to race 74; (1 4) reaction to race 72; (15) reaction to race 61; (16) reaction to race 40; (1 7) aleurone color (Bl bl); 18) awn texture ( R r ) ;
(1 9) rachilla hairiness (Ss); (20) two-row vs. six-row (Vv); (2 1)
R r n l ; (22) R m 2 . The 16 Mendelian loci that code for traits 8-22 are distributed as follows on the seven chromosomes of barley: one locus is on each of chromosomes 1 , 2 and 4,
two loci are on chromosome 6 , three loci are on chromo- some 7, six loci are on chromosome 3, the location of two loci is unknown and no loci are on chromosome 5. Each of these 16 Mendelian loci is known from previous studies to have statistically significant effects on at least one and usually on several among quantitative traits 1-7; presumably many other loci also affect each of these seven quantitative traits but neither the numbers nor the chromosome locations of these presumed additional loci are known. We note that linkage among loci, and also the mating system of predom- inant self fertilization, both have major implications con- cerning the coalescence of loci into associated adaptive complexes as well as the disassociation of complexes of loci (WRIGHT 1933; JAIN and ALLARD 1966; COCKERHAM and
WEIR 1973; WEIR and COCKERHAM 1973; ALLARD 1975). Linkage restricts recombination between loci that are phys- ically close on the same chromosome but it does not affect recombination between loci on different chromosomes. In- breeding, in contrast, affects recombination among all loci whether they are on the same or different chromosomes. In theory the -99% of selfing that occurs in barley causes all loci, whether situated far apart on the same chromosomes, o r located on different chromosomes, to behave as if they are linked with crossover values of c < 0.01. Thus, theory indicates that inbreeding in barley is a highly effective mechanism for organizing the entire gene pool into an
integrated system and also for reducing recombination to the point where little selection is required to protect favor- able combinations of alleles from disassociation once they have formed (ALLARD 1975).
Product-moment correlations and cluster analysis: Cor- relation studies with quantitative characters 1-7 were based on family means obtained by summing the measurement values of all plants in each family from the field plantings described above and dividing by the number (54) of plants scored. Correlation studies with the four sets of discretely recognizable characters were based on the following scoring system: families that were homozygous for the most frequent variant (allele) of each Mendelian locus were assigned the value 1 .O, families that were homozygous for an alternative allele were assigned the value 0.0, and families that were segregating were assigned value 0.5. When there were more than two alleles at any locus the most frequent allele was designated allele 1 and the remaining alleles were combined into a "synthetic" allele designated allele 2; this procedure can result in some loss of information (WEIR and COCKER- HAM 1978). Product-moment correlations were computed for all character pairs of generations F8, Fls, FZ5 and F45.
The number of character pairs is large in each generation; consequently cluster analyses of correlations between char- acter pairs were performed within each generation, using the correlation matrix as input, to serve as a guide for identifying groups of associated characters. Clusters were formed following an average linkage procedure (JOHNSON
and WICHERN 1982) in which the two clusters with the largest average similarity, as measured by the average cor- relation between all members of the clusters, were merged to form a new cluster. The critical values of the correlation coefficients, at probability level 0.05, varied from 0.21 to 0.22 from generation to generation, due to unequal sample sizes in different generations. For simplicity we adopted r =
0.21 as the criterion for termination of these agglomerative processes within each of the four generations.
RESULTS
Quantitative characters: Only the main conclusions reached from analyses of data for the seven quantita- tive traits will be given due to the large number of
data points and the complexities of interrelationships among various components of variance. The main conclusions a r e t h e following. (1) Differences in char- acter expression within the 2 test years were either nonsignificant or marginally significant; this indicates that the environment was essentially the same in the two replications grown in the first test year and in the second test year.
(2)
Character expression in test year1 differed significantly from character expression in test year 2 for nearly all characters; this indicates that the environment was generally not the same for most characters in the two test years. (3) Character expres- sion changed significantly from generation to gener- ation for most of t h e seven characters; changes in character expression were usually small a n d some- times in opposite directions in different generation- to-generation intervals. These results indicate that
significant genetic changes occurred for most traits in the intervals from Fs to F13, F13 t o F23, and from F23
TABLE 1
Frequencies of the ultimately most frequent variant (allele) in the parents and in four generations of CCII
Generation
Trait Parental’ Fe FI, Fzs F ~ s
8 Est I 0.29 0.50 0.59 0.45 0.92
9 Est2 0.89 0.88 0.90 0.93 0.98
10 Est3 0.46 0.55 0.50 0.42 0.91
1 1 Est4 0.14 0.24 0.19 0.16 0.73
12 A c p l 0.39 0.60 0.70 0.68 0.69
13 Race 74 0.11 0.05 0.05 0.14 0.68 14 Race 72 0.04 0.02 0.02 0.03 0.03 15 Race 6 1 0.18 0.04 0.06 0.16 0.44 16 Race 40 0.21 0.07 0.10 0.16 0.74 17 blue 0.40 0.51 0.33 0.71 0.76 18 rough 0.93 0.88 0.89 0.93 1.00 19 short 0.61 0.69 0.76 0.85 0.91 20 six-row 0.75 0.96 0.98 1.00 1.00
21 R r n l 0.86 0.96 0.99 0.98 1.00
22 R m 2 0.26 0.51 0.52 0.53 0.69
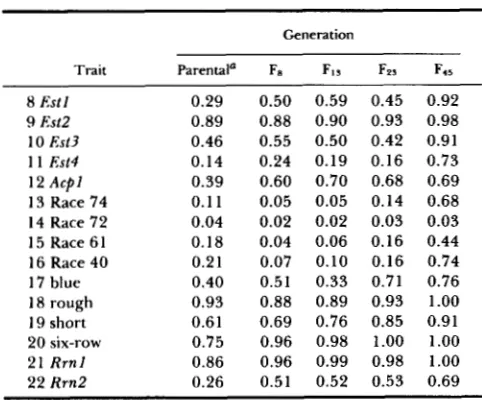
Parental allelic frequencies given in this table are from earlier studies of the parents of CCII [traits 8, 9, 10, 11) (R. W. ALLARD and A . L. KAHLER, unpublished); traits 13, 14, 15, 16 (WEBSTER et al. 1986); traits 17, 18, 19, 20 (R. W. ALLARD and A. L. KAHLER
unpublished); traits 21, 22 (SAGHAI MAROOF et al. 1984)].
earlier changes. (4) Character expression often dif- fered significantly among families within each gener- ation within the 2 test years; this indicates that some families within each generation differed from each other genetically and hence that CCII remained ge- netically variable for metric characters into the late generations. (5) Family X test year components of variance were often statistically significant in genera- tions Fe, Fls, FZ3 and F45; this indicates that higher- order genotype X environment interactions play a role in the evolution of population structure in CCII in most generations and years.
Changes in single-locus allelic frequencies: Allelic frequencies for the 15 discretely recognizable Men- delian traits in the 28 parents, and in four generations of CCII, are given in Table 1. T h e frequencies in this table are those of the alleles that were ultimately most frequent in the later generations of CCII. In a popu- lation with known parents and known mating system expected allelic and genotypic frequencies can be cal- culated for any selectively neutral locus in any gener- ation, n , from WRIGHT’S (1921) well known equilib- rium equation,
( p 2
+
F’”)pq)[RR]+
2 pq
(1-
F’”)) [ R r ]+
( q 2+
F(”))[rr] = I ,as illustrated by the following computations for resist- ance vs. susceptibility to race 40 (trait 16). Six (2 1.43%) of the 28 parents of CCII are homozygous for resistance (genotype R R ) and 22 are homozygous for susceptibility (genotype r r ) to race 40. Thus fre- quencies,
p
and q, of alleles for resistance us. suscep-tibility in the parental generation were
p
= 0.2143 and q = 0.7857 respectively. It can be deduced that15 of the 378 pairwise F1 hybrids from which CCII was synthesized resulted from crosses between RR parents, 132 from RR X rr crosses and 231 from rr X
rr crosses, that the frequencies of RR, Rr and rr individuals in the F1 generation of CCII were 0.04, 0.35 and 0.61, respectively, and that the expected frequencies of resistant and susceptible plants were 0.39 and 0.61, respectively. Changes in F over gen- erations in CCII, in which the amount of selfing, s =
0.994, and the amount of outcrossing t = 1
-
s =0.006 (KAHLER, CLEGG and ALLARD 1975), can be calculated from
F’”) = [(l
-
t)/(l+
t ) ] [ 1-
(s/2)‘”’]+
(s/2)‘”)F’0’,in which F’”) is the theoretical inbreeding coefficient
in any generation n. By generation F7 the theoretical inbreeding coefficient is expected to approach its equi- librium value F, = (1
-
t ) / ( 1+
t )-
1 .OO. Expected frequencies of RR, Rr and rr genotypes can be calcu- lated in successive generations by substitutingp ,
q,and I””) into WRIGHT’S equilibrium equation. The
frequency v) of plants resistant to race 40 is expected to be highest cf= 0.39) in the F1 generation when the frequency of plants with Rr genotypes is maximal; thereafter the frequency of resistant plants is expected to decrease as selfing reduces the number of hetero- zygotes and it is expected to stabilize at
f
= 0.2 1 (E the parental value) as F approaches its equilibrium value. T h e above theory thus provides a null hypoth- esis for comparisons of expected with observed allelic and genotypic frequencies and for the development of estimators of selective values, and their standard errors, based on genotypic recurrence formulae (e.g., ALLARD and WORKMAN 1962; ALLARD, HARDING and WEHRHAHN 1966; WEIR, ALLARD and KAHLER 1972, 1974). T h e theory has subsequently been expended to include parameters for describing two-locus behav- ior (COCKERHAM and WEIR 1973, WEIR and COCK-ERHAM 1973) and for developing two-locus estimators
of selective values (WEIR, ALLARD and KAHLER 1972, 1974). CLEGG, ALLARD and KAHLER (1 972, 1978) have shown that interactions affecting selective values occur not only at the two-locus but also at the three- and four-locus levels. SAGHAI MAROOF et al. (1992) have shown that interactions also occur between the nuclear and cytoplasmic genomes of barley.
We now focus on two main patterns of allelic fre- quency change that have been observed in previous studies of experimental plant populations, patterns that are also readily apparent in the present study (Table 1). Four of the loci of Table 1 (Est2, awn texture, two-row vs. six-row spike, R m l ) follow the
962 R. W. AIlard et al.
was present in very high frequency
cf>
0.75) in the parents of CCII and these predominant alleles in- creased in frequency over generations. T h e high fre- quencies of these alleles in the parents of CCII, which represent all of the major barley growing areas of the world, suggest that these predominant alleles have a selective advantage over all other alleles of these four loci in a great majority of the environments through- out the world in which cultivated barleys are grown. T h e consistent increases in frequency of these alleles that have also been observed over generations in previous studies of CCII, CCV and CCXXI indicate that these alleles have been favored by selection over all other alleles in all or nearly all of the many years that these populations have been grown in Davis. Evidently the cumulative effect of such directional selection was to reduce genetic variability and ulti- mately cause three of the four loci to go to fixation for the favored alleles (six-row, rough awn, allele 112 of R m l ) and to cause the favored allele of Est2 to closely approach fixation (Table 1).T h e second main pattern of population behavior is brought out by allelic frequency changes (Table 1) at 10 Mendelian loci that were moderately to highly polymorphic in the parents of CCII (traits 8, 10, 1 1 , 12, 13, 15, 16, 17, 19, 22). This pattern of allelic frequency change differs from the first pattern in four ways: ( 1 ) one or more reversals in direction of allelic frequency change occurred for most of the loci;
(2)
despite these reversals cumulative changes were large for all 10 loci; (3) in 9 of 10 cases (all except trait 19) the ultimately most frequent allele was not originally the most frequent; (4) all 10 loci remained moderately to highly polymorphic (usually for only two alleles, including the originally most frequent or the origi- nally second most frequent allele) into generation F45. T h e most facile explanation for the above patterns of allelic frequency change is that various features of the Davis environment are temporally heterogeneous with the result that selective advantage shifts from one allele to a different allele with shifts in the envi- ronment. Evidence favoring this explanation is most clear-cut for traits 13, 15, and 16 (resistance us. sus- ceptibility to races 74, 61 and 40 of scald disease). Scald disease causes little damage to barley in dry years but often reduces grain yields dramatically in wet years (SCHALLER 195 1).
Among the 28 parents of CCII six (21%), five (18%), three (1 1 %), and one (4%) are resistant to races 40, 61, 74 and 72, respectively. Expected fre- quencies of resistant plants in the F1 and later gener- ations of CCIJ are given by the sum of the frequencies
of RR and Rr genotypes for races 40 and 74 and by the frequency of the rr genotype for race 61. Thus expectations under neutral theory are that the fre- quencies of plants resistant to races 40 and 74 will
gradually decrease from F1 levels of 0.39 and 0.21 to equilibrium levels of 0.2 1 and 0.1 1, respectively, dur- ing generations F1 to F7 as inbreeding reduces the proportion of heterozygotes in the population to their equilibrium frequencies. In contrast, the frequency of plants resistant to race 6 1 is expected to increase from the F I level
(f=
0.03) to the equilibrium level(f=
0.18) as inbreeding gradually reduces the frequency of susceptible Rr heterozygotes during generations F2 to F7. It can be seen from Table 1 that the changes expected under neutral theory did not occur; ob- served frequencies of plants resistant to races 40, 61 and 74 (0.07, 0.04 and 0.05) were much lower in generation Fa than the frequencies expected under neutral theory cf= 0.2 1 , O . 18, and 0.1 l), respectively. However, the frequencies of resistant plants then be- gan to increase and by generation F45 frequencies had reached levels (0.74,0.44,0.68) far higher than those predicted by neutral theory (0.39, 0.18, 0.1 1 , respec- tively); these results are closely similar to those of earlier studies based on larger samples than those of the present study (JACKSON et al. 1978; MUONA, AL-
LARD and WEBSTER 1982; SACHAI MAROOF, WEBSTER
and ALLARD 1983; WEBSTER, SACHAI MAROOF and
Multilocus Evolution in Barley 963
ies show that: (1) under conditions favorable for scald (wet years) infection by races 40 or 61 leads to in- creases in juvenile mortality and reduces seed yields of susceptible materials, including susceptible mem- bers of resistant-susceptible pairs of isogenic lines, relative to resistant materials;
(2)
under dry conditions unfavorable for scald, susceptible members produce more seeds/plant than resistant members of isogenic pairs. This latter result suggests that host alleles for resistance have innate properties that reduce the re- productive capacity of the host. T h e relationship be- tween environment and selective advantage is less clear-cut for race 72. It can be seen from Table 1 that plants susceptible to race 72 were frequent in the parents and in all generations of CCII. Race 72 is known to differ from races 40 and 61 in two ways that may have a bearing on its differing population behavior. First, race 72 is highly erratic in its abilityto infect susceptible materials (including susceptible members of isogenic pairs) under conditions that are normally highly favorable for infection. Second, this race often causes very little damage even when it succeeds in infecting and producing typical lesions. These two attributes suggest that race 72 causes so little damage to susceptible plants that resistance may be of little benefit to the host. Studies of isogenic lines have shown that the member of isogenic pairs resistant
to race 72 is usually inferior to the susceptible member in juvenile survival and further that resistant plants that survive to reproductive maturity are also inferior
to the susceptible member in seed producing capacity. These attributes of host alleles for resistance are ex- pected, under population conditions, to reduce the frequency of resistant plants below the already low equilibrium frequency
ue
= 0.00 13) predicted by neu- tral theory. Yet resistant plants appeared in all gen- erations (Table 1) at frequencies 15 to 30 times greater than expected under the assumption that all resistance alleles came into CCII from the single re- sistant parent. In this connection we note that some of the 27 susceptible parents of CCII may have been genotypically R l R l r l r , or r2r2RzR2 and hence that the true equilibrium value of susceptible plants in CCII may have been much higher than 0.0013. We also note that substantially higher frequencies of plants resistant to race 72 have been observed in occasional generations in earlier studies of CCII, e.g., WEBSTER, SACHAI MAROOF and ALLARD (1986) reported fre- quencies of resistant plants of 0.09 and 0.14 (69 and108 times larger than the equilibrium value) in gen- erations F17 and FIB. It is possible that such sporadic
increases in frequency result from environmental cir- cumstances under which race 72 is very damaging and that this race occasionally exerts exceptionally strong selective pressures favoring resistant plants (Mc-
DERMOTT et al. 1989).
We now turn to the seven remaining loci of Table 1 (Estl, Est3, Est#, Acpl, aleurone color, rachilla hair- iness, R r n 2 ) . All of these loci were moderately to highly polymorphic in the parents and in all genera- tions of CCII. Yet the ultimately most frequent allele of each of these loci followed patterns of allelic fre- quency change which differ from those of the four nearly monomorphic loci (Est2, awn texture, row number, R r n l ) , as well as from the patterns for the alleles for resistance to races 40,61, 74 and
72
(Tablel), as follows: (1) In the interval from parents to F8 (drought years) the ultimately predominant allele of each of these seven loci increased sharply in fre- quency; (2) In the interval F8-F13 the ultimately pre- dominant alleles of loci E s t l , A c p l and rachilla hairi- ness increased further in frequency whereas the ulti- mately most frequent alleles of Est3, Est#, aleurone color, and R r n l decreased or remained essentially unchanged in frequency; (3) In the interval Fls to Fp3 the ultimately most frequent allele of two loci (aleu- rone color and rachilla hairiness) increased in fre- quency whereas the ultimately most frequent allele of five loci remained unchanged or decreased in fre- quency; (4) In the interval F23 to F45 increases oc- curred in the frequency of the predominant allele of all loci except A c p l . T h e above results suggest that several environmental factors in addition to total rain- fall affect selective values of the different loci. At- tempts to identify these environmental factors have been successful only to the extent of suggesting: (1) that the distribution of rainfall during different parts of the life cycle, (2) that the occurrence of high or low temperatures (especially during flowering and/or mat- uration), (3) that competition associated with high stand densities, and possibly still other stresses occa- sionally exert selective pressures favoring alleles other than the predominant allele.
m
3
0
I
R. W. Allard et al.
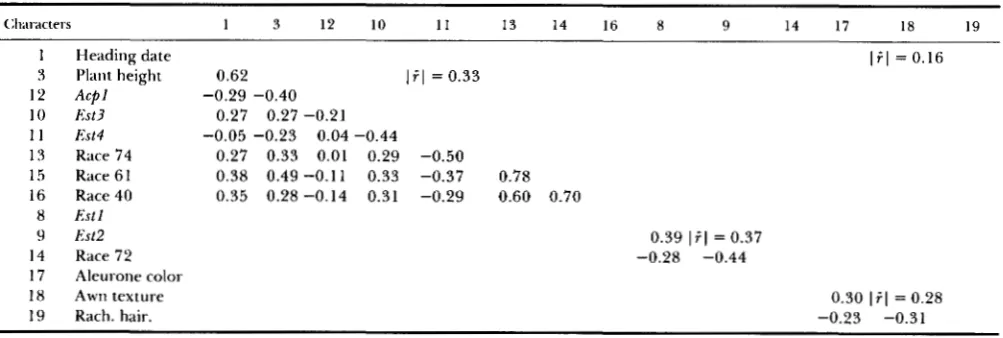
formed at an average similarity of 0.29, was made up of the four esterase loci. T h e correlation matrix (Table 2) suggests that associations of E s t l , E s t 2 and Est3 with each other were stronger than the associa- tions of these three loci with Est4 and that allele 1 of each E s t l , E s t 2 and Est3 was associated with allele 2 of Est4. KAHLER (1973) reported that r values (WRIGHT 1933) were statistically significant in gener- ation F7 (the earliest generation for which seeds of CCII are available) for all six pairwise comparisons among the four loci; he also reported that values of r were nonsignificant in generation F2 (values of r for this generation were inferred from the properties of the 28 parents). Similar rapid buildup of pairwise associations have been reported in other experimental populations of barley (CLEGG, ALLARD and KAHLER 1972,1978; WEIR, ALLARDand KAHLER 1972; 1974). These earlier studies, which were based on much larger samples than the present study, differ primarily in indicating that associations between Est2 and Est3 are weaker than those among the other loci, e.g., KAHLER (1973) reported that r was 0.07 for the Est2- Est3 association in generation F7 whereas values of r for the five other pairwise associations varied from 0.27 to 0.49.
T h e third largest cluster of generation F g , which
formed at average similarity 0.25, included numbers of tillers/plant, yield, and reaction to race 40 of R. secalis. T h e correlation matrix indicates that families resistant to race 40 had fewer tillers and were lower yielding than families that were susceptible to race 40. T h e fourth cluster, which formed with average similarity 0.63, also included three characters, resist- ance to races 6 1 and 74 and two-row vs. six-row spike. T h e correlation matrix indicates that two-rowed fam- ilies were more resistant to these two races than six- rowed families.
Generation Fls correlation analysis: Cluster analy- sis identified four clusters with five, five, four and three characters in this generation. These clusters formed with average similarities of 0.21, 0.27, 0.50 and 0.33. The first cluster included heading date, plant height, rachilla hairiness, kernel weight, and A c p l . This cluster differs from the largest cluster of generation Fs in that awn texture is no longer signif- icantly associated with any other character. T h e cor- relation matrix (Table 3) indicates that families with short-haired rachillas that also carry allele 2 of Acpl were more likely to be later in heading, taller and to have heavier seeds than families with long-haired rach- illas and allele 1 of A c p l .
Multilocus Evolution in Barley
I
eration Fa. In cluster 2 of Fa, yield and number of tillers/plant were associated with each other and with resistance to race 40. Thus the buildup of this second cluster of generation F13 was brought about mainly by the joining together of characters that had not been significantly associated with any other character in Fa. T h e correlation matrix indicates that the asso- ciations which developed in the five generation inter- val from Fa to F13 featured the development of higher yielding families that had shorter spikes with fewer spikelets/row, more tillers and carried allele 2 of Rm2. T h e third largest cluster of generation F13 was comprised of the four esterase loci associated with each other in essentially the same way as in generation Fa (Tables 2 and 3). Thus, the second largest cluster of generation Fa was transmitted over the five gener- ation interval from Fs to F13 in basically intact form.T h e smallest cluster of generation Fl3 included resistance to race 72, two-row us. six-row spike and R m 1. Comparisons of the correlation matrices of gen- erations Fa and F13 show: (1) that two-row vs. six-row spike was significantly associated with resistance to races 61 and 74 in generation Fa but that resistance to race 72 and to Rrnl was not significantly correlated with other characters in that generation; (2) that the signs of the correlations changed, indicating that the internal organization of the cluster changed over gen- erations. T h e formation of this cluster thus involved both the break down of an old relationship and the buildup of new relationships. T h e correlation matrix (Table 3) shows that families with allele 1 of Rrnl were likely to be six-rowed and that families with six- rowed spikes were likely to be susceptible to race 72. Generation F p g correlation analysis: T h e largest
966 R. W. Allard et al.
TABLE 4
Correlations between characters within clusters of Fos (see footnotes Table 2)
Clxll.;tcters 1 3 12 10 1 1 13 14 16 8 9 14 17 18 19
1 Heading date
?J Plant height 0.62
1 i . l = 0.16 12 A c p l
10 Est3 0.27 0.27 -0.21
1 1 Est4 -0.05 -0.23 0.04 -0.44
13 Race 74 0.27 0.33 0.01 0.29 -0.50
1.5 Race 61 0.38 0.49 -0.11 0.33 -0.37 0.78 16 Race 40 0.35 0.28 -0.14 0.31 -0.29 0.60 0.70
1 i . l = 0.33 -0.29 -0.40
8 Est1
9 Est2 0.39 1 i . l = 0.37
14 Race 72 -0.28 -0.44 17 Aleurone color
18 Awn texture 0.30 1 i . l = 0.28
19 Rach. hair. -0.23 -0.31
carrying allele
2,
whereas Est4 was less closely associ- ated with resistances to these three races; also families with allele 1 of A c p l were likely to be earlier in heading and shorter than families with allele2.
The second cluster of generation F23 was comprised of Estl, Est2 and resistance to race
72.
Comparisons of Tables 3 and 4 show that formation of this cluster also resulted from a break down and buildup of rela- tionships among characters that were in different clusters in generation F13. Also Estl and Est2 were no longer associated with Est3 and Est4 in generation F23; this is consistent with the results of KAHLER (1973) who found that the correlations between these two pairs of loci were either nonsignificant or marginally significant in generations F17-F23.The third cluster of generation F23 included aleu- rone color, awn texture and rachilla hairiness. Rachilla hairiness was associated with heading date, plant height and awn texture in Fs and with heading date and plant height in generation F13, whereas aluerone color and awn texture were not significantly corre- lated with each other or with other characters in either generation Fs or F13. Thus, break downs of earlier associations and the joining of breakdown products with previously unassociated characters were involved in the assembly of this third cluster of associated characters of generation 23. T h e associations were such that families with blue aleurone were likely to have rough awns and short-haired rachillas.
Generation
F45
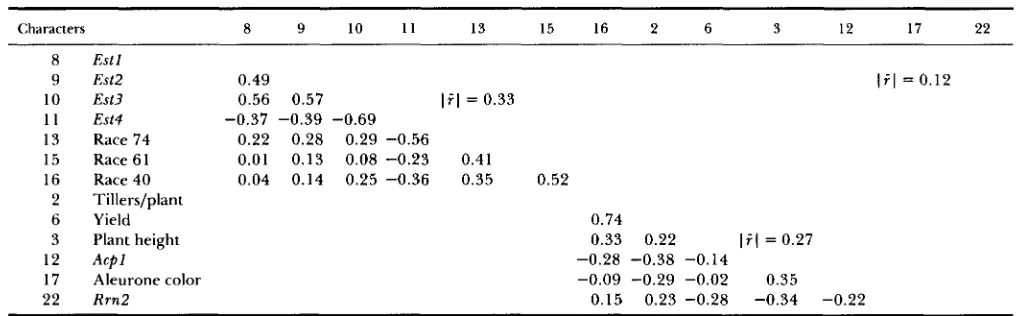
correlation analysis: Cluster analy- sis identified two large clusters, both at average simi- larity 0.21, in this generation. Two additional loci, awn texture and R r n l , were monomorphic (rough awn and allele 1) in F45; thus along with six-row spikes, these loci were not recovered in either of the two clusters.The larger cluster of F45 included the four esterase loci and reaction to races 40, 61 and 74. Five of these
seven characters ( E s t l , E s t 3 , resistance to races 40, 61 and 74) were present in the major cluster of F23. Thus the changes that occurred in the
22
generation inter- val from F23 to F45 featured the disassociation of two quantitative characters, plant height and heading date, from the eight component cluster of FZ3 and the reassociation of Estl and Est2 with the five holdover members of the F23 cluster. T h e data of Table 5 indicate that the four esterase loci were closely asso- ciated in generation F45; however, the results of KAH-LER (1973) indicate that Est2 and Est3 were only
weakly associated in generations Fs9 to F42 of CCII. T h e generation matrix (Table 5 ) indicates that fami- lies carrying allele 1 of Estl, Est2, Est3 and allele 2 of Est4 were more resistant to races 40, 61 and 74 than families carrying alternative alleles of the esterase loci. T h e second cluster of generation F45 included six characters, number of tillers/plant, yield, plant height, A c p l , aleurone color and R m 2 . Comparisons of Tables 2-5 show that the evolution of this cluster over generations featured a series of breakdowns of asso- ciations and assembly of new associations from break- down products with previously unassociated charac- ters. In generation F45 the interrelationships of these six characters were such that families with allele 2 of A c p l , allele 1 of R r n 2 and white aleurone were higher yielding than families carrying alternative alleles of these loci.
DISCUSSION
967 Multilocus Evolution in Barley
TABLE 5
Correlations between characters within clusters of F ~ S (see footnotes Table 2)
Characters 8 9 10 11 13 15 16 2 6 3 12 17 22
8 E s t l
9 Est2 0.49 ( i l = 0.12
10 Est3 0.56 0.57 lil = 0.33
1 1 Est4 -0.37 -0.39 -0.69 13 Race 74 0.22 0.28 0.29 -0.56
15 Race 61 0.01 0.13 0.08 -0.23 0.41
16 Race 40 0.04 0.14 0.25 -0.36 0.35 0.52
2 Tillers/plant
6 Yield 0.74
3 Plant height 0.33 0.22 lil = 0.27
12 Acpl -0.28 -0.38 -0.14
17 Aleurone color -0.09 -0.29 -0.02 0.35
22 Rrn2 0.15 0.23 -0.28 -0.34 -0.22
allele of each of these loci was nearly monomorphic worldwide and this predominant allele remained in high frequency into the latest generation of CCII. These four alleles appear to be “generalist” alleles that are highly favored over all other alleles in all or nearly all environments worldwide in which cultivated bar- leys are grown, including the environments encoun- tered by CCII in each of the 45 years covered by the present experiment. Ten loci, all of which are mod- erately to highly polymorphic on a worldwide basis, followed the second main pattern of allelic frequency changes. This second pattern differs from the first pattern in several ways, e.g., one or more reversals in direction of allelic frequency change occurred for most of the loci, cumulative frequency changes were large over the 45 generation period monitored, all of the loci remained moderately to highly polymorphic into the latest generation, and the originally most frequent allele was often replaced by a different allele as most frequent allele in later generations. These patterns suggest that the Davis environment varies over time in ways that cause selective advantage to shift back and forth, usually between only two differ- ent alleles of a locus. Associations between environ- mental conditions favoring development of epiphytot- ics of scald disease, and increase in the frequency of alleles for resistance to races 40,61 and 74, were high. Attempts to associate allelic frequency changes at other loci with natural environmental perturbations were successful only in the sense of suggesting that two or more environmental factors often appeared to interact complexly in exerting selective pressures on different alleles of various loci.
Analyses of quantitative trait data showed that de- gree of character expression changed significantly for all of the seven traits monitored in at least one and usually in several of the generation intervals moni- tored. Degree of character expression also differed significantly among families within each generation
within the two test years, indicating that CCII re- mained genetically variable for quantitative characters into the latest generation. Family X test year compo- nents of variance were often statistically significant; this indicates that metric character expression differs from test year to test year and hence that testing is required in more than one test-year environment to characterize each genotype. Reproductive success, measured as numbers of seeds/plant, increased in each of the three generation intervals monitored (Fs to F l s ,
Fls to F23, F 2 3 to F45). However, changes in character
expression were erratic for each of the six other quantitative traits monitored (heading date, numbers of reproductive tillers/plant, plant height, spike length, number of spikelets/row, kernel weight) and character expression of none of these traits was asso- ciated with numbers of seeds/plant. This suggests that any effects these six characters have on reproductive capacity may be indirect rather than direct.
Analyses of product-moment correlations among the 22 traits showed that a number of traits were associated in generation Fs but that few of these associations persisted into later generations. Instead extensive restructuring occurred featuring partial di- sassociations of clusters of associated traits and the assembly of new clusters from the disassociation prod- ucts, and from previously unassociated traits, to form progressively larger clusters.
968 R. W. Allard et al.
and/or reproductive success associated with environ- mental fluctuations often appeared to affect change through first-order effects on individual traits; how- ever, survivorship and reproductive success sometimes appeared to act through pairwise or higher-order interactions among traits in ways that led to complex and shifting patterns of associations among traits. Each year selection appeared to move the population in the direction of a multilocus genetic structure ap- propriate to the set of environmental factors acting in that year. However, no environmental regime and hence no single pattern of selection continued for long and the direction of selection constantly changed, moving the population genotype first toward one ge- netic structure and then toward other genetic struc- tures. CCII remained highly variable genetically and its multilocus organization appeared to fluctuate about a rarely if ever realized “adaptive peak” corre- sponding more or less to the genetic structure appro- priate to a weighted mean of the environmental con- ditions that prevailed during preceding generations. Thus, the genetic structure of CCII continued to undergo dramatic reorganizations throughout the 45 generation period monitored, sometimes shifting in directions that improved its ability to cope with the syndrome of challenges imposed by moisture stress but more often shifting in ways that allowed the population to take advantage of ample supplies of moisture. It is implicit in the above model of evolu- tionary dynamics that, had the amplitude of environ- mental fluctuations been sufficiently small at Davis, there would have been only one leptokurtic “adaptive peak” and CCII would have moved toward the summit of such an “adaptive peak.” In this connection we note that, in an earlier study of a subpopulation of CCII which had been transferred to a site in California where rainfall is rarely limiting, alleles and multilocus associations of alleles that are favored in wet years in Davis increased steadily in frequency. Conversely, in subpopulations of CCII which had been transferred to sites in California that are characterized by mod- erate to severe moisture stress nearly every year, alleles and multilocus associations of alleles that are favored in years of severe drought in Davis increased steadily in frequency. These results suggest that en- vironmental perturbations played a smaller role in the more consistently mesic or more consistently arid sites to which the subpopulations had been transferred
than in the Davis environment. Nevertheless all of the transported subpopulations remained substantially polymorphic during 10 or more generations in their new and presumably environmentally more stable sites. T h e above results lead us to two final conclu- sions, first, that natural environmental perturbations play a central role in the evolutionary dynamics of populations of annual plants, and second, that studies
based on only one or a few generations, traits or test environments are unlikely to provide adequate char- acterizations of the nature and consequences of ge- netic change in such populations.
LITERATURE CITED
ALLARD, R. W., 1965 Genetic systems associated with colonizing ability in predominantly self-pollinated species, pp 49-76 in The Genetics of Colonizing Species, edited by H. G. BAKER and G. L. STEBBINS, Academic press, New York.
ALLARD, R. W., 1975 The mating system and microevolution. Genetics 79: 115-126.
ALLARD, R. W., 1977 Coadaptation in plant populations, pp. 223- 231 in Genetic Diversity in Plants, edited by A. MUHAMMAD, R. AKSEL and R. C. VON BORSTEL. Plenum, New York.
ALLARD, R. W., 1988 Genetic changes associated with the evolu- tion of adaptedness in cultivated plants and their wild progen- itors. J. Hered. 79: 225-238.
ALLARD, R. W., 1990 The genetics of host-pathogen coevolution: Implications in genetic resource conservation. J. Hered. 81: 1- 6.
ALLARD, R. W., J. HARDINC and C. WEHRHAHN, 1966 The esti- mation and use of selective values in predicting population change. Heredity 21: 547-563.
ALLARD, R. W., S. K. JAIN and P. L. WORKMAN, 1968 The
genetics of inbreeding populations. Adv. Genet. 14: 55-131. ALLARD, R. W., and A. L. KAHLER, 1971 Allozyme polymor-
phisms in plant populations. Stadler Symp. 3: 9-24.
ALLARD, R. W., and A. L. KAHLER, 1972 Patterns of molecular variation in plant populations. Proc. Sixth Berkeley Symp. Math. Stat. Probab. 5: 237-254.
ALLARD, R. W., A. L. KAHLER and B. S. WEIR, 1972 The effect of selection on esterase allozymes in barley. Genetics 72: 489- 503.
ALLARD, R. W., and P. L. WORKMAN, 1962 Population studies in predominantly self-pollinated plants. IV. Seasonal fluctuations in estimated values of genetic parameters in lima bean popu- lations. Evolution 17: 470-480.
ALLARD, R. W., M. A. SACHAI MAROOF, Q. ZHANC and R. A. JORCENSEN, 1990 Genetic and molecular organization of ri- bosomal DNA (rDNA) variants in wild and cultivated barley. Genetics 126: 743-751.
BROWN, A. H. D., M. FELDMAN and E. NEVO, 1980 Multilocus structure of natural populations of Hordeum spontuneum. Ge- netics 96: 523-536.
CLECC, M. T., R. W. ALLARD and A. L. KAHLER, 1972 Is the gene the unit of selection? Evidence from two experimental populations of barley. Proc. Natl. Acad. Sci. USA 69: 2474- 2478.
CLECC, M. T., R. W. ALLARDand A. L. KAHLER, 1978 Estimation of life-cycle components of selection in an experimental barley population. Genetics 89: 765-792.
COCKERHAM, C. C., and B. S. WEIR, 1973 Descent measures for two loci with some applications. Theor. Popul. Biol. 4: 300- 330.
GURUSINCHE, P., 1984 The inheritance of scald (Rhynchosporium seculis) resistance in experimental populations of barley (Hor- deum uulgare L.). Ph.D. dissertation, University of California, Davis.
HARLAN, H. V., and M. L. MARTINI, 1929 A composite hybrid mixture. J. Am. SOC. Agron. 21: 407-409.
JACKSON, L. F., and R. K. WEFJSTER, 1976 Race differentiation, distribution, and frequency of Rhynchosporium secalis in Cali- fornia. Phytopathology 66: 726-728.
Multilocus Evolution in Barley
cross populations. Phytopathology 6 8 645-650.
JAIN, S. K., and R. W. ALLARD, 1960 Population studies in pre- dominantly self-pollinated species, I. Evidence for heterozygote advantage in a closed population of barley. Proc. Natl. Acad. Sci. USA 46: 1371-1377.
J A I N , S. K., and R. W. ALLARD, 1966 The effects of linkage, epistasis and inbreeding on population changes under selection. Genetics 53: 633-659.
J A N A , S.. Q. ZHANG and M. A. SAGHAI MAROOF, 1989 Influence of environments on the development of multivariate structures in a barley composite cross at three locations. Genome 32: 40- 45.
JOHNSON, R. A , , and D. W. WICHERN, 1982 Applied Multivariate Statistical Analysis. Prentice-Hall, Englewood Cliffs, N.J.
KAHLER, A. L., 1973 Distribution and maintenance of allozyme variation in wild and cultivated barley (Hordeum vulgare L.). Ph.D. dissertation, University of California, Davis.
KAHLER, A. L., and R. W. ALLARD, 1970 Genetics of isozyme variants in barley. I. Esterases. Crop Sci. 1 0 444-448.
KAHLER, A. L., and R. W. ALLARD, 1981 Worldwide patterns of genetic variation among four esterase loci in barley (Hordeum vulgare L.). Theor. Appl. Genet. 5 9 101-1 1 1 .
KAHLER, A. L., M. T. CLEGG and R. W. ALLARD, 1975 Evolutionary changes in the mating system of an exper- imental population of barley (Hordeum vulgare L.). Proc. Natl. Acad. Sci. USA 72: 943-946.
KAHLER, A. L., S. HEATH-PAGLUISO and R. W. ALLARD, 1981 Genetics of isozyme variants in barley. 11. 6-Phospho- gluconate dehydrogenase, glutamate oxalate transaminase, and acid phosphatase. Crop Sci. 21: 536-540.
MCDERMOTT, J. M., B. A. MCDONALD, R. W. ALLARD and R. K.
WEBSTER, 1989 Coevolution of host and pathogen populations in the Hordeum vulgare-Rhynchosporium secalis pathosystem. Proc. Natl. Acad. Sci. USA 86: 3924-3927.
MUONA, D., R. W. ALLARD and R. K. WEBSTER, 1982 Evolution of resistance to Rhynchosporium secalis (Oud.) Davis in barley composite cross 11. Theor. Appl. Genet. 61: 209-214.
SAGHAI MAROOF, M. A., R. W. ALLARD and Q. ZHANG, 1990 Genetic diversity and ecological differentiation among ribosomal DNA alleles in wild and cultivated barley. Proc. Natl. Acad. Sci. USA 87: 8426-8490.
SAGHAI MAROOF, M. A., R. K. WEESTER and R. W. ALLARD,
1983 Evolution of resistance to scald, powdery mildew, and net blotch in barley composite cross 11. Theor. Appl. Genet.
66: 279-283.
SAGHAI MAROOF, M. A., K. M. SOLIMAN, R. A. JORGENSEN and R. W. ALLARD, 1984 Ribosomal DNA spacer-length polymor- phisms in barley: Mendelian inheritance, chromosomal loca- tion, and population dynamics. Proc. Natl. Acad. Sci. USA 81:
8014-8018.
SAGHAI MAROOF, M. A,, Q. ZHANG, D. B. NEALEand R. W. ALLARD, 1992 Associations between nuclear loci and chloroplast DNA genotypes in wild barley. Genetics 131: 225-231.
SCHALLER, C. W., 1951 The effect of mildew and scald infection on yield and quality of barley. Agron. J. 43: 183-188. WAGNER, D. G., and R. W. ALLARD, 1991 Pollen migration in
predominantly self-pollinated plants: barley. J. Hered. 82: 302- 304.
WARD, D. J., 1962 Some evolutionary aspects of certain morpho- logical characters in a world collection of barley. U. S. Dept. Agric. Tech. Bull. 1276: 1-1 12.
WEBSTER, R. K., M. A. SAGHAI MAROOF and R. W. ALLARD, 1986 Evolutionary response of barley composite cross I1 to Rhynchospoirum secalis analyzed by pathogenic complexity and gene-by-race relationships. Phytopathology 76: 661-668. WEIR, B. S., R. W. ALLARD and A. L. KAHLER, 1972 Analysis of
complex allozyme polymorphisms in a barley population. Ge- netics 72: 505-523.
WEIR, B. S., R. W. ALLARD and A. L. KAHLER, 1974 Further analysis of complex allozyme polymorphisms in a barley popu- lation. Genetics 7 8 91 1-919.
WEIR, B. S., and C. C. COCKERHAM, 1973 Mixed selfing and random mating at two loci. Genet. Res. 21: 247-262. WEIR, B. S., and C . C. COCKERHAM, 1978 Testing hypotheses
about linkage disequilibrium with multiple alleles. Genetics 8 8
633-641.
WRIGHT, S., 1921 Systems of mating. Genetics 6 1 1 1 - 1 75.
WRIGHT, S., 1933 Inbreeding and recombination. Proc. Natl. Acad. Sci. USA 19: 420-433.
ZHANG, Q., M. A. SAGHAI MAROOF and R. W. ALLARD, 1990 Worldwide pattern of multilocus structure in barley determined by discrete log-linear multivariate analyses. Theor. Appl. Genet. 8 0 121-128.