Roderick BronsonS and Edmond
J.
Yunis*'*
*Dana-Farber Cancer Institute, THaruard School of Public Health, XTujls University School of Veterinary Medicine and §Haward Medical School, Boston Massachusetts 021 15
Manuscript received May 20, 1991 Accepted for publication April 6, 1992
ABSTRACT
Analysis of genetic interactions in the F2 of an intercross of (C57BL/6 X DBA/2) FJ revealed
influences of genetic factors on life span. Females lived longer than males. Dilute brown females died sooner than females of other colors. H-Zb/H-Zb males died sooner than H-P/H-2d or H-Zd/H-2d males, except that among dilute brown males those of typeH-Zb/H-2d died sooner. Cluster analysis suggested that male and female genotypes each fall into two groups, with female dilute brown mice having
shorter lives than other females, and male H-26/H-Zb mice except dilute brown and dilute brown H- Zb/H-Zd mice having shorter lives than other males. The association of heterozygosity with life span was clearer in females than in males, yet the longest-lived female genotype was homozygous H-2d/H-
2 d , of dominant Black phenotype at the Brown locus of chromosome 4 , and homozygous dd at the Dilute locus of chromosome 9. The shortest-lived females were dilute brown H-Zb/H-Zb. The longest- lived and shortest-lived male genotypes were dilute brown H-Zd/H-Zd and dilute brown H-Zb/H-2d, respectively. Although histological findings at postmortem differed between the sexes, there was no association of particular disorders with other genetic markers. The importance of H-2 in males was confirmed, but the allelic effects were perturbed, possibly by the absence of Sendai infection in this experiment. Overall our studies suggest that genetic influences on life span involve interactions
between loci, and allelic interactions may change with viral infections or other environmental factors.
N
UMEROUS studies have demonstrated that ge- netic and environmental factors play a pivotal role in determining life span in mice and other species. T h e role of genetics in life span is well documented in inbred strains of mice, since different strains differ in life span. In the last years the use of congenic strains of mice which differ only in a given chromosomal region has helped to elucidate the genes controlling life span in mice. For example, differences in H-2haplotype were associated with differences in immune responses (SMITH and WALFORD 1977; POPP 1978; WILLIAMS et al. 198 1). Also it has been shown that the major histocompatability complex influences life span (GREENBERG and YUNIS 1975; SMITH and WAL-
FORD 1977; MEYER, ARMSTRONG and WARNER 1989).
Our previous work on [(C57BL/6 X DBA/2) FJ X DBA/2J] backcross mice showed that the interaction between genes in the Brown ( b ) locus of chromosome 4 , genes in the segment of chromosome I 7 which contains the H-2 haplotype, and genes in a segment of the sex chromosome, influenced longevity, and that increased heterozygosity at these loci was associated with longer life span (YUNIS et al. 1984). The current experimental protocol was different, in that the mice studied were Fz hybrids, which included mice either homozygous H-Z6/H-Z6 and H-Zd/H-Zd or heterozy- gous. In the backcross experiment, the animals were
Genetics 132: 229-239 (September, 1992)
exposed to Sendai infection at an early age, but in the current experiment there was no exposure to Sendai infection.
Although the backcross method is more powerful than the intercross we chose the intercross in order to analyze H-26/H-2d which would have required two different backcrosses for the comparison of H-Zb/H-
2', H-Zb/H-Zd and H-Zd/H-Zd. However, the intercross
method used could not distinguish BB from Bb of
chromosome 4 nor
DD
fromDd
of chromosome 9, sowe could only compare the bb genotype vs. the phe- notype [B.] (BB plus Bb) and the dd genotype us. the phenotype
[D.]
(DD
plusDd).
T h e resulting FZ pro- duced more genetic combinations to test the hypoth- esis of heterozygote advantage.230
MATERIALS AND METHODS
K. B. G. Dear et al.
TABLE 1
Segregation of coat color markers in Fz mice intercross (C75BL/6JXDBA2/J)FI
Brawn
Sex Unknown [ B . ] [ B . ] bb bb
Unknown [ D . ] dd [ D . ] dd ALL
Dilute
Inbred strains of [(C57BL/6 X DBA/2) FIJI hybrid mice were obtained a 5-8 weeks of age from The Jackson Labo- ratory, Bar Harbor, Maine. T h e experimental [(C57BL/6
X DBA/2) FJ X (C57BL/6 X DBA/2) F J ] FP mice were bred and housed in the Michael Redstone animal facility of the Dana-Farber Cancer Institute (DFCI). T h e F2 mice were born between June 12 and July 20, 1984. T h e control mice were inbred C57BL/6J, DBA/2J and (C57BL/6 X DBA/2) FJ strains obtained in July and August 1984 from T h e Jackson Laboratory to be age-matched with the F P mice
bred at DFCI.
All mice were housed in two rooms of the animal facility. T h e female littermates were separated at weaning and hou- sed together in polycarbonate cages, ten mice per large cage (19 X 10.5 X 6 inches). Male mice were housed with their littermates in the same size cages, because fighting between males is reduced when they are housed with littermates. Litters were combined in cages so that a total of 9-1 1 males from two or more litters were housed together in each large cage. Males and females were distributed in both rooms. All animals were maintained on standard Purina Chow and water ad libitum. Room temperature was kept at 7°F f 2 ” with alternate 12-hr light and dark periods. Initially, cages were cleaned once per week and bedding was changed once per week. After 14 months, the frequency of cage cleaning was increased to four times per week. Maintaining the same cagemates, mice were moved to smaller cages, 4-6 mice per medium cage (12.5 X 9.25 X 6 inches) and 1-3 mice per small cage (1 1.5 X 7.5 X 5 inches) as the number of mice per cage decreased, to provide easier access to food and water. After 24 months of age, most mice were in small cages.
All mice were ear-tagged. T h e cages were labeled by color coding the cage cards and the shelves to be easily visible to all project and facility staff. T h e mice were checked
1-3 times per day, 7 days a week, to ensure accurate determinations of dates of death and to preserve bodies for later necropsy. T h e mice were inventoried weekly to main- tain the cage counts.
Nine surveillance animals (DBA/2J females) were kept in each room at all times. Three or four of these animals were taken once per month to test for infection by known path- ogens. Both rooms had persistent Pasturella pneumotropica infections during the study period. There was occasional serological evidence of exposure of the surveillance animals to mouse hepatitis virus and one instance each where one or two of the surveillance animals exhibited exposure to Klebsiella and Polyoma. There was no evidence of exposure to Sendai virus during the study and after April 1986 there was no evidence of exposure to pathogens. T h e study ani- mals, which were inspected weekly, showed no sign of infec- tion. However, the possibility could not be ruled out that these pathogens may affect longevity without gross clinical evidence of infection. In routine screening for pinworm, infection was observed in one room on only one occasion.
Both male and female mice were phenotyped for H-2 alloantigens beginning at 5 weeks of age and continuing until all mice had been typed. T h e H-2 typing was performed on peripheral blood lymphocytes, obtained from the tail vein, using the anti-H-2* and anti-H-2d cytotoxic antibodies (a gift from L. FLAHERTY, New York Department of Health, Albany New York). T h e microcytotoxicity technique used 72-well Terasaki plates and guinea pig complement (WAT- SON et al. 1984).
Because previous results showed a dependence of life span on month of birth, we used mice with birth dates
Females 1 659 227 224 76 1187 Males 3 686 221 214 64 1188
Total 4 1345 448 438 140 2375
~~
At the Brown locus [B.] denotes the dominant black phenotype. The homozygote BB cannot be distinguished in the F2 from the
heterozygote Bb. Similarly at the Dilute locus, [D.] denotes either DD or Dd (the nondilute phenotype).
TABLE 2
Segregation of H-2
Sex Missing H-2”H-P H-PfH-2d H-2dlH-2d Total
Females 92 282 542 271 1187 Males 124 267 528 269 1188
Total 216 549 1070 540 2375
The totals include the mice for which the H-2 type was not
obtained.
TABLE 3
Life span percentiles (months)
No. of
Life span percentile
Sex mice 10% 25% 50% 75% 90%
B6 Females 32 23.2 25.6 28.1 31.4 31.9 B6 Males 38 18.8 23.1 28.2 30.8 33.6
D2 Females 28 20.0 20.6 23.7 27.4 29.4 D2 Males 17 13.8 22.2 23.3 25.6 27.1
F1 Females 30 23.0 25.0 27.9 31.5 37.0 F, Males 30 22.1 26.3 28.9 32.2 37.7
F2 Females 1187 17.9 22.4 26.9 31.1 34.7
F2 Males 1188 14.7 20.9 25.6 29.7 33.0
The 10th percentile is the age in months by which 10% of mice had died. The 50th percentile is the median life span.
spanning only a short range. T h e mice were kept in cages on 5-tier racks. Previous experiments have shown an effect of tier on life span, but no such effect was apparent in this study and it was not a source of variation in our results.
Statistical methods: Random segregation was tested using
contingency-table chi-squared tests. Survival curves were drawn using the method of KAPLAN and MEIER (1958) and compared using log rank tests (PETO and PETO 1972). Con- fidence intervals around median life spans (see Table 4)
were calculated using the method of LEHMANN (1975, p. 184). Proportional hazards regression models (COX 1972)
were used to test the association of combinations of factors with life span and to model the effect of increasing hetero- zygosity on life span.
C-nror Fail T o t r l
0 32 32
0
1 1 8 Z iiS7
30 28
5 s3
genotypes in a single cluster, log rank tests were performed
to test the significance of the difference of each genotype from the rest. T h e most significantly different genotype was removed from the cluster if its significance level was below
0.1. This was repeated until no further differences were
found among the remaining genotypes. Next, the genotypes which had been removed one by one were formed into a new cluster, and the process repeated (in fact, no differences were found within these secondary clusters). In this way the genotypes were grouped into homogenous clusters. T h e purpose of this exercise was descriptive, and resulted in the clusters as depicted in Figure 10.
RESULTS
Segregation: T h e FP mice segregated for four mark- ers: sex, brown color, dilute color and H-2. Of 2375 total mice, sex was known for all, coat color (the brown and dilute markers) was missing for 4 and H-2 was missing for 216. There were 1187 male and 1188 female mice.
T h e segregation of the two color genes is shown in Table 1. T h e segregation is similar in the two sexes
( P = 0.60), and in both sexes is similar to the expected 9:3:3:1 ratio (females P = 0.97; males P = 0.72).
T h e segregation of H-2 by sex is shown in Table 2. T h e overall frequencies of H - 2 types is not signifi- cantly different from the expected 1:2:1 ratio ( P =
0.87), and is similar in the two sexes ( P = 0.93). H-2
segregated independently of color ( P = 0.83).
Parental types: For comparison, mice of the paren- t a l inbred and the F1 types were also kept. Data were available on about 30 mice of each sex. Table 3 shows the times by which 10% and 90% had died, and the median. In each sex, life spans are substantially longer in parental C57BL/6J (B6) than parental DBA/2J (D2) mice. In females, the F, life spans were similar to the B6 parental type, except possibly beyond 32 months (Figure l), while in males, the F1 mice lived longer then either parental type (Figure 2). T h e meaning of
FIGURE 1.-Parental, F, and F2 life spans: females. Censored mice were those few lost by drowning, for which a natural life span could not be determined. "Fail" denotes the remainder. Tabulated median life spans for the parents (B6, D2), F1 (B6D2) and F2 (F2) are in months.
40 S O
this difference is unknown. T h e Fe mice show a larger variance in life span, with the early 10th percentile being attained at approximately the same time as in the short-lived parent, while the later 90th percentile is delayed to approximately the same time as in the longer-lived parent. Although the numbers of F2 mice were greater than the parent strains and the F1, their overall survival was less than either the F1 or B6.
Effects of sex, coat color and 23-2 genotype on life span: Females tended to live longer than males. Table 3 shows percentiles of the life span distribution in months, and the sex difference. From the 25th per- centile on, the distributions differ by about 1.5 months (Figure 3).
T h e effects of differing genotypes on life span were distinctly different in the two sexes. In females, the situation was quite simple. Dilute brown mice, homo- zygous recessive at the Brown and Dilute loci, had significantly shorter lives than mice with the other three coat colors. Their median life span was 25.2 months compared with 26.8, and the 90th life span percentile lay at 32.0 months rather than 35.0. As
Figure 4 shows, the difference did not appear until the mice were two years old, when about a third of the females had already died. Cox regression showed a marginal effect ( P = 0.065) of H - 2 : H-2'/H-2' fe- males died sooner, with a median life span of 34.2 months compared with 35.0 for both H-2b/H-2d and
H-2d/H-2d. There was no interaction between color
and H-2.
Among males, H-2 was strongly associated with life span ( P = 0.0032, Figure 5). H-2'/H-2' males had distinctly shorter lives than H-2'/H-2d or H-2d/H-2d
232 K. B. G . Dear et al.
1 .o
0.- -
0.8 -
0.7
-
0.3 -
0.2 - Log Renk Tert: p-co.001
0.1
0 . 0
0 1 0 20 30 40 so
Months
C-nror FmII T O t L . 1 M ~ d i e n
1 7 17
0 0
0 88 88 29.6
28.3
1 6 1 172 118s sg:g
1 .o*
0 . - -
0 . 8 -
0.7 -
x
2 0 . 6 -
-
a
1
0.4;0.3 -
0 . 2 -
0.1 -
0 . 0 ,
.-
0 1 0 2 0 30 40 S O
MONTHS
""
Censor
"""""_"
FIGURE 2.-Parental, F, and F2 life spans: males.
FIGURE 3.--Fz longevity by sex.
died earlier than any other group. T h e different effect of H-2 in male and female dilute brown mice is shown in Figures 6 and
7.
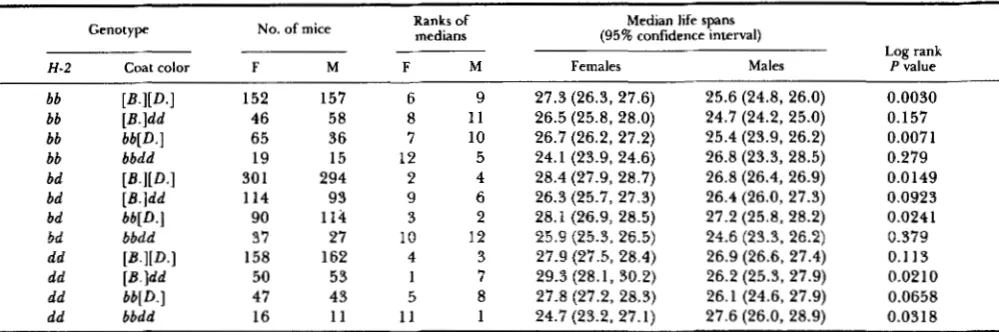
Sex differences within genotypes: Table 4 com- pares the two sexes within each of the 12 genotypes defined by H-2 and coat color. T h e table shows the mean and median life span; the rankings of the gen- otypes within the sexes, based on the median; the numbers of mice in each group; and the significance level of a log rank test comparing the sexes. T h e strongest difference is found in H-2'/H-2' mice of
black or brown coat color.
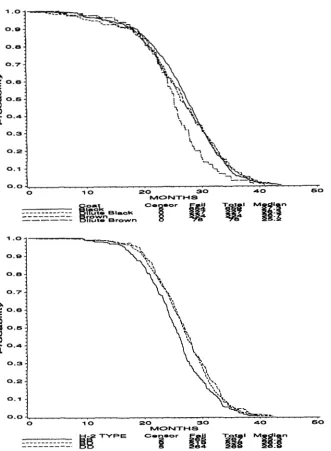
Cluster analysis: Multiple log rank tests were per- formed within each sex, comparing the 12 genotypes defined by combinations of H-2 and the two coat- color genes. Among females, the most significantly different genotype, with shorter life span than the rest, is H-2'/H-2' bbdd, at P = 0.0051. After this, H -
2d/H-2d bbdd is different from the remaining geno- types at P = 0.019, and then H-2b/H-2d bbdd is differ- ent at P = 0.086. T h e remaining genotypes are not distinguishable at a critical value of P = 0.1. T h e three extracted genotypes, comprising all dilute brown fe- males, are not significantly different ( P = 0.37). The females thus fall into two groups, as shown in Table
5. T h e survival experience of these groups is shown in Figure 8.
Among males, the most significantly different gen- otype, with short life span, is H-2'/H-2' bb[D.], at P =
FIGURE 4.-Longevity by coat color mark- ers in females. Combining the three H - 2 gen- otypes, this graph shows the rapid death rate of dilute brown females after 20 months.
FIGURE 5.-Longevity by H-2 in males. Combining all four coat colors, this graph illustrates that H-2'/H-26 males tend to have shorter life spans that H-PJH-P or H-2'lH-
2d males.
from the others, are not significantly different ( P =
0.33), so the males also fall into two groups as shown (Figure 9). The median life spans for all the genotype are displayed in Figure 10 with the groups identified; note that the groups are defined by differences among the entire survival curves, not just the medians.
Heterozygosity index: To examine the overall as- sociation of degree of heterozygosity with life span, a heterozygosity index was formed as follows. One point was scored for females, one for mice of type H-2*/H-
2d, two for black coat color and one for brown or
dilute black coat color. Black mice scored twice for coat color, being potentially heterozygous at both the
Brown and Dilute loci. The index thus ranged from 0 to 3 for males, 1 to
4
for females.Considering mice of both sexes together, the het- erozygosity index was highly significant ( P
<
0.000 I ) ,with greater heterozygosity being associated with
longer life spans in a COX (1972) regression model. After adjusting for sex, the significance was consid- erably lessened, to P = 0.0 1 1. It thus appears that sex
is a major component of the apparent effect of het- erozygosity.
The median life spans for the four heterozygosity groups in each sex are shown in Table 6 , and the survival curves in Figures 1 1 and 12. These groups are significantly different in each sex: P = 0.0076 for females, P = 0.037 for males. With the exception of the dilute brown males (heterozygosity index 0), which had the greatest median life span among males, the group median life spans increased in order of increas- ing heterozygosity index.
234 K. B. G. Dear et al.
1 .o
0.e -
0.8
-
0 . 7 -
1.
0 . 6 1
I I
t Horcrozypour
-
i " I
8
pm
0 . 5 :0
i
0 . 4 10.3
-
0.2 -
0.1 - Log Rank Teet: p-0. 'I e
I
I
0 . 0 ~
""_
I
0 1 0 2 0 30 40
MONTHS 6 0
1 .o
0 . -
0 . 8 0.7
p
0.6-
p'
0 . 5
0
i
0.40.3
0.2
0.1
0 . 0
FIGURE B.-Dilute brown mice: H-2 ef-
fects: females. Considering only dilute brown mice, the two H - 2 homozygotes had similar
life spans. With Figure 7, this illustrates the interaction of sex with H-2: in females H-2*/ H-2d mice did better than the homozygotes,
while in males H-26/H-2d mice did worse.
FIGURE 7.-Dilute brown mice: H-2 ef-
fects: males.
0 1 0 20 30
MONTHS
for females, are excluded from the analysis, the re- maining effect is different for the two sexes. In fe- males, there is no residual association of heterozygos- ity with life span: P = 1 .O from a log rank test between the three groups, and P = 0.83 from a Cox regression testing for a linear effect of increasing heterozygosity. In males, however, the remaining groups are signifi- cantly different: P = 0.095 from the log rank test, and
P = 0.015 from the Cox regression. According to this proportional hazards model, the hazard of death is reduced at any time by a multiplicative factor of 0.89 (95% confidence interval 0.81-0.98) for each unit increase in heterozygosity. T h e instantaneous risk of death for mice of heterozygosity index 3 is therefore estimated to be only about 0.70 (0.89') times the risk for mice of heterozygosity index 0.
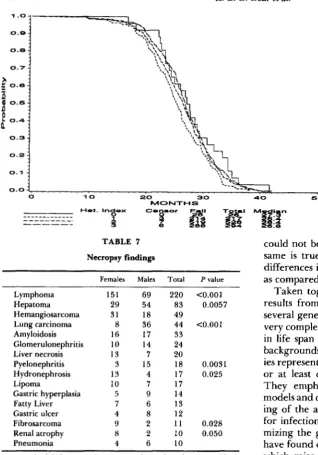
Histopathology findings: Table
7
shows the occur- rence of various postmortem pathologies. Lymphoma4 0 60
was the commonest finding, and was twice as common in females as in males. This agrees with our earlier findings in the backcross model. Hepatoma (paren- chyma) was the next most common, appearing more often in males. T h e ratio of lymphoma to hepatoma was approximately 5:l in females and 5:4 in males. Few hepatomas were found in the backcross. Among less common pathologies, lung carcinoma and pyelo- nephritis were more common in males, hydrone- phrosis in females. Except for hydronephrosis, these comparisons were not significant in the backcross. Due mainly to rapid lysis, postmortems were successful on only
25%
of mice. T h e brain and pituitary were not studied.There was no significant association in either sex of disease frequency with any of the genetic markers H-
2 , Brown and Dilute. Omitting genotypes with fewer
H-2 Coat color F M F M Females Males P value
bb P I i D . 1 152 157 6 9 27.3 (26.3, 27.6) 25.6 (24.8, 26.0) bb
0.0030 [B.]dd 46 58 8 1 1 26.5 (25.8, 28.0) 24.7 (24.2, 25.0) 0.157
bb bb[D.] 65 36 7 10 26.7 (26.2, 27.2) 25.4 (23.9, 26.2) bb
0.0071 bbdd 19 15 12 5 24.1 (23.9, 24.6) 26.8 (23.3, 28.5) 0.279
bd [B.l[D.l 30 1 294 2 4 28.4 (27.9, 28.7) 26.8 (26.4, 26.9) 0.0149
bd [B.]dd 114 93 9 6 26.3 (25.7, 27.3) 26.4 (26.0, 27.3) bd
0.0923 bb[D.] 90 114 3 2
bd
28.1 (26.9, 28.5) 27.2 (25.8, 28.2)
bbdd 37 27 10 12 25.9 (25.3, 26.5) 24.6 (23.3, 26.2) 0.379 0.0241
dd [B.I[D.l 158 162 4 3 27.9 (27.5, 28.4) 26.9 (26.6, 27.4) 0.1 13
dd [B.]dd 50 53 1 7 29.3 (28.1, 30.2) 26.2 (25.3, 27.9) 0.0210
dd bb[ D . ] 47 43 5
dd bbdd 16 1 1 1 1 1 24.7 (23.2, 27.1) 27.6 (26.0, 28.9)
8 27.8 (27.2, 28.3) 26.1 (24.6, 27.9) 0.0658 0.031 8
Coat colors: [B.I[D.l = black; [B.]dd = dilute black; bb[D.] = brown; bbdd = dilute brown. The median life spans are ranked separately for
each sex. Confidence intervals are wider for smaller groups of mice. The log rank tests compare entire survival curves, not just the medians. The medians are shown in Figure 10. Brackets indicate phenotypes.
TABLE 5
Genotype clusters by sex
Genotype Females Males
H-P/H-26
[ B . ] [ D . ] (black) [B.]dd (dilute black) bb[D.] (brown) bbdd (dilute brown)
[ B . ] [ D . ] (black) [B.]dd (dilute black) bb[D.] (brown) bbdd (dilute brown)
[ B . ] [ D . ] (black) [B.]dd (dilute black) bb[D.] (brown) bbdd (dilute brown)
H-P/H-P
H - P ~ H - P
Long Long Long Short
Long Long Long Short
Long Long Long Short
Short Short Short Long
Long
Long
Long Short
Long Long
Long
Long
Genotypes (phenotypes in parentheses) were clustered separately for each sex into ”Long” and “Short” life span groups using multiple log rank tests (see Statistical Methods). Figures 8, 9 show the corre- sponding survival curves. The groups are identified on Figure 10.
pathology are nonsignificant at P = 0.36 (females) and
P = 0.88 (males). These tests were performed using a Monte Carlo algorithm (PATEFIELD 198 1).
DISCUSSION
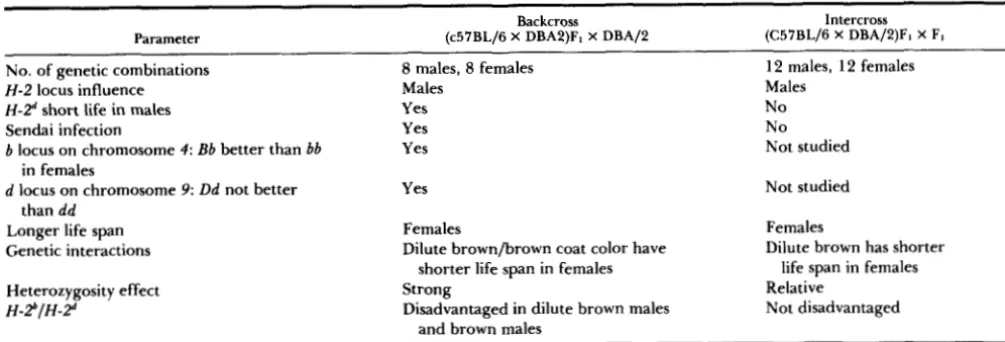
In the present experiment, as has been pointed out before in the experimental models of (C57BL/6 X DBA/2) (YUNIS et al. 1984; RUSSELL 1975), females lived longer than males (Figure 3). Similarly, the
F1
hybrid live longer than the parental types, at least in males (Figure 2). In this experiment, in females, the F1 and B6 parental type were together longer-lived than the D2 parental type. T h e F2 exceeded only the D2 parent in life span, in both sexes, being shorter- lived than either the B6 parent or the F1.In the previous report (YUNIS et al. 1984) it was found that backcross mice [(C57BL/6 X DBA/2) FJ X DBA/2J] produce different genetic life span profiles in relation to coat color markers and H-2 genotype. These backcross mice showed primarily two genetic effects, of the major histocompatibility complex in males and of the coat color markers in females. In the present report, the mice studied were the F2 hybrid of the (C57BL/6 X DBA/2) FJ, and the genetic markers studied were again H-2 (chromosome 4 ) ,
Brown (chromosome 4 ) and Dilute (chromosome 9 ) .
However, it was possible to compare more homozy-
gous and heterozgous combinations of genes than previously, due to the presence among the FP off- spring of both homozygotes at each locus.
It is important to point out that influence of the H-
2 genes on life span can vary depending on the exper- imental model used, and also on the environmental conditions during the experiment. In two separate congenic experiments (SMITH and WALFORD 1977;
GELMAN et al. 1990) it was observed that the H-2’
haplotype was associated with longer life span than the H-2d haplotype; however, there was evidence of exposure to Sendai infection in both experiments.
In our present experiment we found that in the F2 experimental model, mice typed as H-2d/H-Zd or H -
2b/H-2d lived longer than those typed H-2b/H-2b. Since
the only important difference between the previously reported experiments was that the mice in the exper- iments reported before had been exposed to and possibly infected with Sendai virus, we suggest that exposure to infection can change the profile of life span. Since the susceptibility to this virus has been shown to vary between strains (STEWART and TUCKER
1978), with the highest susceptibility in
H-2dlH-Zd
236 K. B. G . Dear et al.
FIGURE 8.-Groupings by H-2 and coat
color markers: females. Genotypes groups are defined by nonsignificant log rank tests (see text). The group memberships are shown in Figure 10.
1 .o
-
0 . - -
0 . 8 -
0 . 7 -
h
2 0 . 6 -
-
0
FIGURE 9.-Groupings by H-2 and coatcolor: males.
0 . 5
-
0.4
0.3
- -
0.2 -
\
'\
0.1
-
0
\
0 . 0
'.
'.
--.-
*."-
40
l o 20 30
"""
MONTHS
60
""""""_
1978), we believe that H-2d haplotype can confer susceptibility to that virus, but that in the absence of infection, the H-2d haplotype can confer longer life span than the H-2' haplotype. However, we corrobo- rated the earlier finding that H-2 significantly influ- ences life span primarily in males (YUNIS et al. 1984).
While the same loci remain important, it appears that environmental changes such as exposure to Sendai virus, and the segregation of other genetic systems in different experimental models, affect the details of genetic interactions. In this regard, in the backcross experiments reported before (YUNIS et al. 1984), the
H-2'/H-2d animals lived longer than the H-2d/H-2d,
suggesting the influence of heterozygosity on life span, but in the F2 experimental model reported here H-2d
haplotype conferred long life span. Table 8 summa- rizes these findings.
In the previous paper it was reported that the
heterozygosity index was associated significantly with life span. Life span was analyzed by ranking hetero- zygosity at each locus identified. T h e longest-lived mice in the backcross experiment were females (in which one or the other of the two X chromosomes was activated), heterozygous at the H-2 and Brown ( 6 )
loci. T h e influence of H-2'1H-2' was not assessed in the backcross experimental model. In the present experiment, however, we found that heterozygosity
p e r se does not universally increase life span in mice.
Furthermore, although the association of life span with heterozygosity was significant in females, the longest-lived mice were females predominantly het- erozygous for the Brown locus of chromosome 4 , but homozygous for H-2d/H-2d and for the Dilute locus of chromosome 9.
FIGURE 10.-Median life spans by geno-
type. The x-axis gives the H-2 genotype.
Codes plotted in the graph show the coat
color marker phenotypes. Height up the
graph shows median life span in months.
Dashed lines group together genotypes/phe-
notypes for each sex with similar survival
curves.
M a l e s Females
bb bd dd bb bd dd
H - 2 Oonotypo
FIGURE 1 1 .-Heterozygosity index: fe-
males. The heterozygosity index was formed as the number of heterozygous loci, counting females and mice phenotypically dominant at the Brown and Dilute loci as heterozygous.
TABLE 6
Median life spans by heterozygosity index
Heterozygosity Index
Sex 0 1 2 3 4
Males 27.3 25.4 26.4 26.8
Females 24.1 27.2 27.4 28.4
Heterozygosity index: one point was given for each heterozygous
locus, including the activated female X chromosome. For simplicity, the dominant types of the coat color markers were counted as heterozygous, even though approximately one-third of these mice
would be homozygous for the dominant allele.
WHITEHEAD 1990; JOHNSON 1990; JOHNSON et al.
1990; GOULD and CLARK 1983) but it has not been possible to determine a single gene that can predict long life in outbred populations. Different life spans in various inbred strains of mice suggest genetic influ- ences which have been associated with specific dis-
eases; e.g., leukemia in AKR mice and mammary tu- mors in C3H female mice. In inbred strains of mice it is possible to identify better life span with different H -
2 haplotypes using H-2 congenic mice, and more recently to suggest that the D end of the H-2 haplotype is a better predictor of life span than the K end (GELMAN et al. 1990). However, in experimental models where other genes are studied, such as in recombinant strains of mice, the genetics of life span demonstrated complex patterns. In recombinant strains of mice produced between C57BL/6J (B6) and DBA/2J (D2), with genes homozygous to either B or
D
and 141 identified polymorphic genes, two strains had a shorter life span and several chromosomal re- gions were found that best correlated with life span (GELMAN et aE. 1988). One was in chromosome 7 (one238 K. B. G . Dear et al.
FIGURE 12.-Heterozygosity index: males.
40 60
TABLE 7
Necropsy findings
Females Males Total P value
Lymphoma Hepatoma Hemangiosarcoma Lung carcinoma Amyloidosis Glomerulonephritis Liver necrosis Pyelonephritis Hydronephrosis Lipoma
Gastric hyperplasia Fatty Liver Gastric ulcer Fibrosarcoma Renal atrophy Pneumonia
151
29
31 8 16
10
13 3
13 10
5
7
4 9
8
4
69 220 <0.001 54 83 0.0057 18 49
36 44 <0.001
17 33 14 24
7 20
15 18 0.0031 4 17 0.025 7 17
9 14 6 13
8 12
2 11 0.028 2 10 0.050
6 10
A total of 237 necropsies were performed on females, 222 on males. Frequencies of disorders in the two sexes were compared using Fisher's exact test. Significance levels not shown are greater than 0.05.
longer life span), two in chromosome 1 (one D allele marked by Lamb-2 associated and one B allele marked by Ltw-4 associated with longer life span) and one in chromosome 12 (one D allele marked by Igh genes and Npid or DlPNyul associated with longer life span). Although DBA/2 has a shorter life span than C57BL/6 or the F1 hybrid between the two, not all
8 3 genes are beneficial for life span, since the two
shortest lived recombinant strains of mice had more
B genes then D genes analyzable among the 14 1 typed markers.
Gross pathology at death and mean life spans of many inbred mouse strains have been documented as differing by strain in some mice (BRONSON 1990). In other strains and hybrids the differences in life span
could not be accounted for by specific diseases. T h e same is true in our present report, with significant differences in the profile of pathology only in female as compared with male mice.
Taken together our studies suggest that life span results from environmental factors interacting with several genes. Obviously the genetics of life span are very complex, and we anticipate that genes important in life span will need to be studied in many genetic backgrounds and environmental conditions. Our stud- ies represent an attempt to identify some of the genes, or at least chromosome regions, that are involved. They emphasize the need to use several genetic models and different experimental conditions of hous- ing of the animals, especially monitoring of animals for infections. It is remarkable that even after mini- mizing the genetic and environmental variations we have found complex patterns of disease and life span, which raise doubts as to the feasibility of studying genetic effects of life span in outbred populations. At the least, it would be necessary to identify genes that under all environmental conditions influence life span-, a task difficult to undertake in the near future. In summary the intercross genetic model (C57BL/ 6 X DBA2) F1 was studies using sex, H-2, coat color genes in chromosomes 4 and 9 producing a total of 24 different genotypes. Primarily this model could study the H-2b/H-2b homozygote, in addition to the
H-2d/H-2d homozygote and H-26/H-2d heterozygote
No. of genetic combinations
-
8 males, 8 females 12 males, 12 femalesH-2 locus influence Males
H-2d short life in males Yes
Sendai infection Yes
b locus on chromosome 4: Bb better than bb Yes
Males
No
No Not studied in females
than d d
d locus on chromosome 9: Dd not better
Longer life span Genetic interactions
Heterozygosity effect
H-.P/H-P
Yes Not studied
Females Females
Dilute brownbrown coat color have Dilute brown has shorter
shorter life span in females life span in females
Strong Relative
Disadvantaged in dilute brown males Not disadvantaged
and brown males
This work was supported by National Institutes of Health grants ROl-A602329-1J and CA-06516. The authors wish to thank the reviewers for suggestions which significantly improved the paper, and MARTHA MANN for the excellent care provided to the animals in this study.
LITERATURE CITED
BRONSON R. T., 1990 Rate of occurrence of lesions in 20 inbred
and hybrid genotypes of mice sacrificed at 6 month intervals
during the first years of life, pp. 279-358 in Genetic Efects on
Aging 11, edited by D. E. HARRISON. Telford Press, West Caldwell, N.J.
Cox, D. R., 1972 Regression models and life tables. J. R. Stat.
Soc. (Ser. B) 34: 187-202.
GELMAN, R., A. WATSON, R. BRONSON and E. J. YUNIS,
1988 Murine chromosomal regions correlated with longevity.
Genetics 1 8 693-704.
GELMAN, R., A. WATSON, E. YUNIS and R. M. WILLIAMS,
1990 Genetics of survival in mice: subregions of the major
histocompatibility complex. Genetics 1 2 5 167-174.
GOULD, A. B., and A. M. CLARK, 1983 Behavior of life-shortening
genes in genetic mosaics of Drosophila melanogaster. Mech.
Ageing Dev. 23: 1-10.
GREENBERG, L. J., and E. J. YUNIS, 1975 Immunopathology of
aging. Hum. Pathol. 5: 122-124.
GRIGLIATTI T., M. RICHTER and I. WHITEHEAD, 1990 Mutations
in Drosophila that act in the larval stage and influence larval
of adult longevity, pp. 154-176 in Genetic Efects on Aging II,
edited by D. E. HARRISON. Telford Press, West Caldwell, N.J.
JOHNSON T. E., 1990 Increased life-span of age-I mutants in
Caenorhabditis elegans and lower Gompertz rate of aging. Sci-
ence 2 4 9 908-9 12.
JOHNSON T. E., D. B. FRIEDMAN, N. FOLTZ, P. A. FITZPATRICK and
J. E. SHOEMAKER, 1990 Genetic variants and mutations of
Caenorhabditis elegans provide tools for dissecting the aging
process, pp. 10 1 - 127 in Genetic Eflects on Aging 11, edited by
D. E. HARRISON. Telford Press, West Caldwell, N.J.
KAPLAN, E. L., and P. MEIER, 1958 Nonparametric estimation
from incomplete observations. J. Am. Stat. Assoc. 53: 457-
481.
LEHMANN, E. L., 1975 Nonparametric Statistical Methods Based on
Ranks. Holden-Day, Oakland, Calif.
MEYER T. E., M. J. ARMSTRONG and C. M. WARNER, 1989 Effects
of H-2 haplotype and gender on the lifespan of A and C57BL/
6 mice and their F,, FP and backcross offspring. Growth Dev.
Aging 53: 175-183.
PARKER, J. C., M. D. WHITEMAN and C. B. RICHTER,
1978 Susceptibility of inbred and outbred mouse strains to Sendai virus and prevalance of infection in laboratory rodents.
Infect. Immun. 1 9 123-130.
PATEFIELD, W. M., 1981 An efficient method of generating ran-
dom R X C tables with given row and column totals (algorithm
AS 159). Appl. Stat. 30: 91-97.
PETO, R., and J. PETO, 1972 Asymptotically efficient rank invar-
iant test procedures. J. R. Stat. SOC. (Ser. A) 135: 185-198.
POPP, D. M., 1978 Use of congenic mice to study the genetic basis
of degenerative disease, pp. 26 1-279 in Genetic Efects ofAging,
Vol. XIV, edited by D. GERCSMA and D. HARRISON. Alan R. Liss, New York.
RUSSELL, E. S., 1975 Lifespan and aging patterns, pp. 51 1-519
in Biology of the Laboratory Mouse, Ed. 2. Dover Publications, New York.
SMITH, G. W., and R. L. WALFORD, 1977 Influence of the main
histocompatibility comlex on aging in mice. Nature 2 7 0 727-
729.
STEWART, R. B., and M. J. TUCKER, 1978 Infection of inbred
strains of mice with Sendai virus. Can. J. Microbiol. 42: 9-13.
WATSON, A. L. M., R. J. MAHONEY, S. A. DAMICO, L. J. COVIELLO,
L. FLAHERTY and E. J. YUNIS, 1977 Utilization of murine
peripheral blood lymphocytes for H-2 typing. Tissue Antigens
WILLIAMS, R. M., L. J. KRAUS, P. T . LAVIN, L. L. STEELE and E. J.
YUNIS, 1981 Genetics of survival in mice: localization of dom-
inant effects to subregions of the major histocompatibility
complex, p. 247 in Immunological Aspects of Aging, edited by D.
SEGRE and L. SMITH. Marcel Dekker, New York.
YUNIS, E. J., A. L. M. WATSON, R. S. GELMAN, S. J. SYLVIA, R.
BRONSON and M. E. DORF, 1984 Traits that influence longev-
ity in mice. Genetics 108: 999-101 1.
24: 150-154.