Braden).
by
Hailey Elizabeth Krouse
A dissertation submitted to the Graduate Faculty of North Carolina State University
in partial fulfillment of the requirements for the degree of
Doctor of Philosophy
Psychology
Raleigh, North Carolina 2012
APPROVED BY:
_______________________________ ______________________________ Jeffery P. Braden, Ph.D. Christopher B. Mayhorn, Ph.D. Committee Chair
DEDICATION
BIOGRAPHY
ACKNOWLEDGMENTS
First and foremost, I would like to thank my advisor, Jeff Braden, whose patience and support made this accomplishment possible. His time and knowledge have been invaluable during this learning process. He has challenged me to think critically and has helped me grow as both a researcher and practitioner. I know the skills and lessons he has taught me will continue to provide guidance in my professional and personal life for many years to come. I would also like to extend my gratitude to Adam Meade for all of his statistical assistance. He went over and above the “call of duty” and I appreciate the extra time and effort he spent helping me complete this project. I would also like to thank John Neitfeld Chris Mayhorn, for their time, insightful feedback and collaboration on this project.
I am indebted to the psychologists from across the country who have so generously dedicated their time and energy collecting and entering data for this project. Truly, without their help this study would not have been possible. I want to say a special “thank you” to Fantasy Lozada for helping me better understand the world of factor analysis. There is
strength in numbers and AMOS was a much friendlier place with you by my side. I also want to thank all my grad school girls (you know who you are) for their friendship and support over the past eight years. I am grateful to have you all in my life and I am looking forward to many more fun times in the future!
TABLE OF CONTENTS
List of Tables………. List of Figures……… Chapter 1………... Introduction………. Defining Intelligence………..……….. Theories of Intelligence………... Spearman’s g-Factor Theory……….. Multiple Factor Theories...………. Dichotomous Theories…...……… Cattell-Horn Gf-Gc Theory……… Carroll’s Three Strata Theory……… Cattell-Horn Gf-Gc Theory vs. Carroll’s Three Strata Theory…. CHC Theory ……….. Intelligence Testing and Theory……….……. Wechsler Scales of Intelligence and Theory ………. CHC Theory and Cognitive Assessment………... Overview of Factor Analysis………..……… CHC Theory and the WISC-IV……….. Unique Aspects of the D/HOH Population………. Cognitive Abilities of D/HOH Individuals……….. Cognitive Differences Between D/HOH and Hearing Individuals.
Research Investigating the Intelligence of D/HOH Individuals….….… Research Investigating the Structure of Intelligence of D/HOH Indi….. Summary……….... Measurement Equivalence/Invariance………. ME/I Model Fit……….. ME/I and the WISC-IV………..……… Purpose of the Present Study………... Hypotheses………... Hypothesis One: Configural Invariance……….………... Hypothesis Two: Metric Invariance………..……… Hypothesis Three: Differences in Mean Scores….………... Hypothesis Four: Subtest Intercorrelations……..………. Chapter 2……… Method………. Study Changes………... The WM Subtests of the WISC-IV and D/HOH Examinees…… Participants and Examinees………... Recruitment……… Procedure………. Demographic Data….……… WISC-IV Data………….……….. Predictions and Analyses……….
Sample Size………. Merging Samples……… Converting Data……….. Factor Model………... Factor Details……….. Chapter 3……… Analyses and Results………... Participants and Examinees………... Descriptive Analyses………. Preliminary Analysis: Restriction of Range……….. Hypotheses…...……….. Chapter 4……… Discussion……… Hypothesis One: Configural Invariance……….………… Hypothesis Two: Metric Invariance………...……… Additional Analyses………..…. Hypothesis Three: Differences in Mean Scores….……… Hypothesis Four: Subtest Intercorrelations..………. Summary………..……….. Implications for Practice……...………...………… Limitations………... Directions for Future Research………
Conclusions………..… References………... Footnotes……… Appendices……… Appendix A……….. Appendix B………..……… Appendix C……….………. Appendix D……….. Appendix E……….. Appendix F………...………
LIST OF TABLES
Table 1 Description of the CHC Broad Abilities………... 12
Table 2 The Subtests the Comprise the WISC-IV Indexes……… 22
Table 3 The WISC-IV Subtests and Their Loadings onto Indexes and CHC Broad Abilities……… 23
Table 4 Exploratory Factor Loadings of the WISC-IV Subtests………….. 25
Table 5 General Background and Hearing Loss Data Gathered for Each D/HOH Child……….. 53
Table 6 Setting and Test Administration Data Gathered for Each D/HOH Child………... 54
Table 7 WISC-IV Data Gathered for Each D/HOH Child………. 55
Table 8 ANOVA Source Table……….. 57
Table 9 AFI Model Fit Cutoff Criteria………..………. 62
Table 10 Demographic Information………. 64
Table 11 Demographic Information Describing Examinees’ Hearing Impairment………. 69
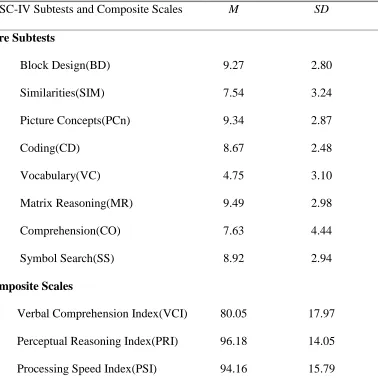
Table 12 The Mean and Standard Deviation of the WISC-IV Subtests and Composite Scales……….. 70
Table 13 Scalar Invariance Intercept Values………... 78
Table 14 Results from Multiple Tests of Invariance ………... 79
LIST OF FIGURES Figure 1
Figure 2 Figure 3 Figure 4 Figure 5
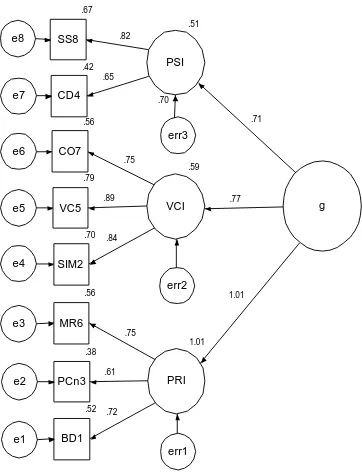
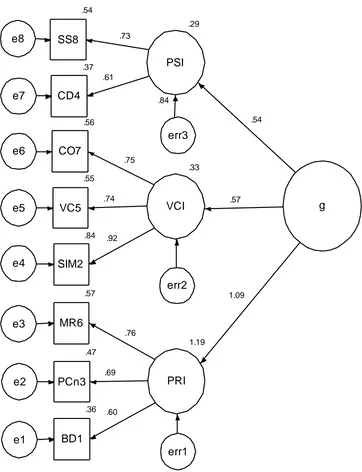
The CHC Theory of Intelligence………... Path Diagram of Study Hypotheses……….. Factor Model of the WISC-IV……….. Standardized estimates for the norm group……….. Standardized estimates for the D/HOH sample……….
CHAPTER 1 Introduction
Psychologists have been studying intelligence for more than 150 years. For most of this time, the areas of the science dedicated to generating intelligence theory and conducting intelligence testing have remained mutually exclusive. A large gap has existed between intelligence research and practice. Before the 21st century, few intelligence tests were guided by theoretical principles. However, since the birth of the Cattell-Horn-Carroll (CHC) theory of intelligence in 2000, the gap between theory and practice has narrowed. Many recently published intelligence tests, including the Wechsler Intelligence Scales for Children—Fourth edition (WISC-IV), are based on the CHC theory of intelligence. Although evidence exists supporting this model of intelligence for children and adults, there is no research that collects evidence using current tests built on the CHC theory with deaf and hard-of-hearing (D/HOH) populations1. Therefore, the purpose of this study is to examine the structure of intelligence
of D/HOH children using the WISC-IV and to answer the question: Is the CHC theory, as measured with the WISC-IV, a parsimonious model of intelligence for this unique group?
followed by a discussion of measurement invariance methods. Finally, the purpose of the current study is described followed by the hypotheses, methods for data collection, and proposed analyses.
Defining Intelligence
The word intelligence comes from the Latin word intelligere, which means to understand. Although the English word “intelligence” has a definite meaning, the definition of the construct has been an issue of debate for over 100 years (Wasserman & Tulsky, 2005). During the first half of the 20th century, psychologists created numerous definitions of
intelligence and there was little unity in defining this construct. Charles E. Spearman (1927) stated, “In truth, ‘intelligence’ has become a mere vocal sound, a word with so many
meanings that it finally has none” (p. 14).
The first text to use the term intelligence was Herbert Spencer’s The Principles of Psychology originally published in 1855 and revised in 1885. Spencer defined intelligence as the biological ability for an organism to adapt to its environment. Decades later, Binet and Simon (1911; 1916) and Stern (1912; 1914; cited in Mackintosh, 1998) continued to
unsuccessful. Over half a century later, Sternberg and Detterman (1986) published a follow-up to the 1921 conference. Twenty-five contemporary psychologists were involved; yet again, a common definition was not endorsed (Wasserman & Tulsky, 2005).
Although psychologists do not agree on a single definition of intelligence, one of the most enduring and popular definitions of intelligence was proposed by Wechsler (1939).
Intelligence is the aggregate or global capacity of the individual to act
purposefully, to think rationally and to deal effectively with his environment. It is global because it characterizes the individual’s behavior as a whole; it is aggregate because it is composed of elements or ability, which, though not entirely independent, are qualitatively differentiable (p. 3).
Theories of Intelligence
Psychologists not only struggled with defining intelligence, but also labored over the development of intelligence theories. Interested in using quantitative methods of
investigation, psychologists began proposing various models of the structure of intelligence. As the goal of all theory, these psychologists hoped that their theoretical models would create inclusive definitions and valid measures of this construct of interest (i.e., intelligence).
Spearman’s g-Factor Theory
assessed with a variety of intelligence tests, those that scored highly on one test tend to make high marks on the other tests as well. This observation also held for individuals who made intermediate and low scores (Wechsler, 1974a). Spearman showed that g is a mathematically derived factor of shared variance (Wasserman & Tulsky). Many psychologists describe Spearman’s theory as a single factor theory; however, this is incorrect (Flanagan, McGrew & Ortiz, 2000). Spearman’s theory, originally called the two-factor theory, dichotomized variance into shared variance, common across measures (g) and unique variance, specific to individual tests (s). Although most psychologists do not agree with Spearman’s theory, many feel that his discovery is one of the most important contributions to psychology (Wasserman & Tulsky). Wechsler (1939; Wechsler, 1974a) stated “Professor Spearman’s generalized proof of the two-factor theory of human abilities constitutes one of the great discoveries of psychology” (p. 35). “Even the most ardent critics of Spearman’s work seem unable to totally dismiss the existence of a general factor” (Wasserman & Tulsky, p. 16).
Multiple Factor Theories
The dissection of Spearman’s g-factor model began in the early 20th
are sometimes treated as synonyms, they are conceptually distinct and should not be confused.
The then-new statistical process of factor analysis held the promise of uncovering the abilities underlying intelligence, thus revealing its true structure. In 1934, Thurstone
conducted a centroid factor analysis of a battery of cognitive tests that revealed 13 factors, 7 of which he believed to be primary mental abilities: spatial visualization, perceptual speed, numerical facility, verbal comprehension, associative memory, word fluency, and reasoning. Initially, Thurstone did not find evidence of Spearman’s general intelligence, or g, factor. However, later, Thurstone developed higher-order factor-analytic techniques where he acknowledged Spearman’s g-factor as a higher-order factor (Wasserman & Tulsky, 1998).
Thurstone’s use of multiple-factor analytic approaches to understanding intelligence allowed psychologists to develop empirically based theories of intelligence, relying on data rather than educated hypotheses. Most subsequent theories of intelligence used the statistical method of factor analysis in understanding the construct of intelligence.
Dichotomous Theories
reasoning skills (e.g., inductive and deductive) in adapting to novel situations. Cattell believed this to be the most essential feature (or characteristic) of intelligence. Crystallized intelligence refers to the ability to draw on preexisting knowledge and acquire new
knowledge using familiar learning strategies. Crystallized intelligence is most often assessed by tapping culturally specific and educationally relevant knowledge such as factual
information, word knowledge, quantitative skills, and language comprehension (Wasserman & Tulsky, 2005). Thus, the original Gf-Gc theory was a dichotomization of cognitive ability (Flanagan et al., 2000) that posited two related but distinct cognitive abilities.
Cattell-Horn Gf-Gc Theory
Cattell and his student, Horn, continued to modify and improve the Gf-Gc theory. In the mid-1960s, Horn (1965) expanded the Gf-Gc model to include four additional abilities: visual processing (Gv), short-term memory (Gsm), long-term retrieval (Glr) and processing speed (Gs). A few years later, Horn (1968) added another factor, auditory processing (Ga) and redefined Gv, Gs and Glr. In the 1990s, Horn (1991) added a sixth factor, correct decision speed (CDS). A few years later, the final two factors, quantitative ability (Gq) and broad reading/writing ability (Grw), were added based on the work of Horn (1991) and Woodcock (1994), respectively. This multiple factor model became known as the Cattell-Horn Gf-Gc theory (Alfonso, Flanagan, & Radwan, 2005). Although this new theory
included the addition of eight new factors (for a total of 10), it was still referred to as the Gf-Gc theory. The name causes some confusion because it implies a two-factor structure,
Carroll’s Three Strata Theory
Drawing on a number of preexisting theories (e.g., Spearman, 1927; Thurstone, 1938; Horn & Cattell, 1966; Horn, 1991), Carroll (1993) devised a theory of intelligence that differentiated cognitive factors into a hierarchical three stratum model. Carroll’s three strata, I, II and III, differ in breadth and generality (Carroll, 2005).
Carroll’s stratum I factors explain variance that are shared by a few tasks, meaning they rely on a narrow set cognitive abilities (i.e., the abilities are not common across many cognitive tasks). Carroll identified 65 distinct stratum I factors. The stratum II factors explain variance that are shared by a number of first stratum factors, meaning they rely on a more general set of cognitive abilities. Carroll recognizes the following eight stratum II factors: fluid intelligence (Gf), crystallized intelligence (Gc), general memory and learning (Gy), broad visual perception (Gv), broad auditory perception (Gu), broad retrieval ability (Gr), broad cognitive speediness (Gs) and decision/reaction time speed (Gt). At the highest level or stratum III is g, or general intelligence, which encompasses all second stratum factors.
Carroll’s concept of g is consistent with Spearman’s (1927) definition of g (Alfonso et al., 2005; Carroll, 2005).
Cattell-Horn Gf-Gc Theory vs. Carroll’s Three Strata Theory
The Cattell-Horn Gf-Gc Theory and Carroll’s Three Strata Theory are so similar that many have proposed they represent a common, unified theory (called CHC theory after Cattell, Horn, and Carroll), as will be described in the next section. However, there are four important points of difference that should be made between these two theories. The most notable difference is that Carroll’s Three Strata theory includes a general ability factor, g, at the highest level, stratum III. The Cattell-Horn Gf-Gc theory does not include a
CHC Theory
In an attempt to resolve the differences between the Cattell-Horn Gf-Gc theory and Carroll’s Three Strata Theory, McGrew (2000; in Flanagan, et al., 2000) proposed an “integrated Cattell-Horn-Carroll Gf-Gc model” (p. 28). The integrated model “represents both the Cattell-Horn and Carroll models, in their respective splendor” (McGrew, 2005, p. 149). This integrated theory quickly became known as the Cattell-Horn-Carroll (CHC) theory of cognitive abilities as it began seeping into the psychology literature in the early 21st
century (Alfonso, et al., 2005).
academic strengths and weaknesses, which are understood best through the
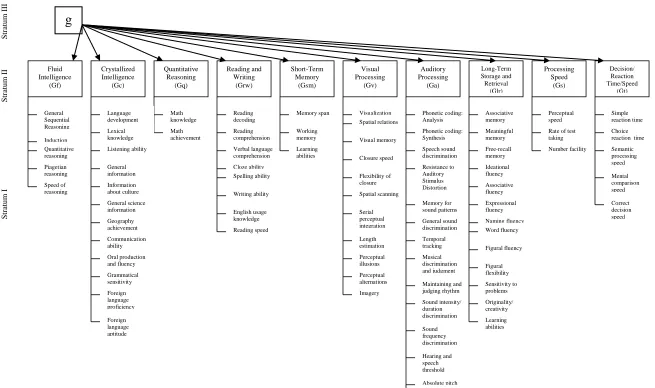
operationalization of broad [stratum II] and narrow [stratum I] abilities (Alfonso, et al., 2005, p. 188). However, this is a controversial point, as many in the field (e.g., Braden & Shaw, 2009; Jensen, 1997) argue strongly that the practical value from most cognitive tests is mostly (if not entirely) due to the ability of the tests to measure g. Although g is not typically depicted in visual models of the CHC theory, it is included in Figure 1. In sum, the CHC theory is the culmination of years of research investigating the structure of human
Fluid Intelligence (Gf) Crystallized Intelligence (Gc)
g
Quantitative Reasoning (Gq) S tr at u m II S tr at u m II Reading and Writing (Grw) Short-Term Memory (Gsm) Visual Processing (Gv) Auditory Processing (Ga) Long-Term Storage and Retrieval (Glr) Processing Speed (Gs) Decision/ Reaction Time/Speed (Gt) General Sequential Reasoning Induction Quantitative reasoning Piagetian reasoning Speed of reasoning Math knowledge Math achievement S tr at u m I Language development Lexical knowledge Listening ability General information Information about culture General science information Geography achievement Communication ability Oral production and fluency Grammatical sensitivity Foreign language proficiency Foreign language aptitude Reading decoding Reading comprehension Verbal language comprehension Cloze ability Spelling ability Writing ability English usage knowledge Reading speedFigure 1. The CHC Theory of Intelligence
Memory span Working memory Learning abilities Visualization Spatial relations Visual memory Closure speed Flexibility of closure Spatial scanning Serial perceptual integration Length estimation Perceptual illusions Perceptual alternations Imagery Phonetic coding: Analysis Phonetic coding: Synthesis Speech sound discrimination Resistance to Auditory Stimulus Distortion Memory for sound patterns General sound discrimination Temporal tracking Musical discrimination and judgment Maintaining and judging rhythm Sound intensity/ duration discrimination Sound frequency discrimination Hearing and speech threshold Absolute pitch Sound localization Associative memory Meaningful memory Free-recall memory Ideational fluency Associative fluency Expressional fluency Naming fluency Word fluency Figural fluency Figural flexibility Sensitivity to problems Originality/ creativity Learning abilities Perceptual speed
Rate of test taking
Number facility
Simple reaction time
Choice reaction time
Table 1
Description of the CHC Broad Abilities Broad Ability Description Fluid Intelligence (Gf)
Mental operations (e.g., inductive and deductive reasoning) an individual uses to perform novel tasks Crystallized Intelligence (Gc) Culturally specific knowledge
Quantitative Knowledge (Gq) Quantitative declarative and procedural knowledge Reading and Writing (Grw) Knowledge of basic reading and writing abilities
Short-term Memory (Gsm) The ability to mentally hold information and retrieve it within a few seconds
Visual Processing (Gv) The ability to perceive, analyze, synthesize, generate, store, retrieve, manipulate, and transform visual stimuli Auditory Processing (Ga) The ability to perceive, analyze, and synthesize
auditory patterns and detect changes in sound patterns Long-term Storage &
Retrieval (Glr)
The ability to store and quickly and accurately retrieve information from long-term memory
Processing Speed (Gs) The ability to perform cognitive tasks fluently and automatically
Decision/Reaction Time/Speed (Gt)
Intelligence Testing and Theory
“The only way we can evaluate intelligence quantitatively is by the measurement of various aspects of these [intellectual] abilities” (Wechsler, 1974a, p. 74). Intelligence tests, from the beginning, have always been viewed as an instrument used to measure the larger construct, intelligence. “…As far as measuring intelligence is concerned, these specific tasks are only a means to an end. Their object is not to test a person’s memory, judgment or
reasoning ability, but to measure something which it is hoped will emerge from the sum total of the subject’s [sic] performance, namely, his [sic] general intelligence” (Wechsler, 1974a, p. 35).
Intelligence tests and theory have a reciprocal relationship. Ideally, intelligence theories guide test development; however, intelligence test data are often used to guide theory development. For the majority of the 20th century, intelligence tests largely ignored theory in favor of empiricism. Consequently, there has been a large gap between intelligence theory and intelligence tests. With the exception of the intelligence tests published within the last few decades, most intelligence tests were not based on a specific theory of intelligence. This is true of the Wechsler Scales of Intelligence.
Wechsler Scales of Intelligence and Theory
Wechsler Scales of Intelligence have made significant contributions to the fields of clinical and school psychology (Zhu & Weiss, 2005).
With the exception of the WISC-IV (Wechsler, 2003), all other Wechsler Intelligence Scales used the same verbal/performance model of intelligence. “Without a doubt, the
Wechsler verbal/nonverbal (performance) model of intelligence is the most widely recognized dichotomous model of cognitive abilities” (Flanagan, et al., 2000, p. 20).
Although Wechsler organized his intelligence tests into two categories, he did not believe in two distinct types of intelligence. Wechsler’s intent was to organize his intelligence tests to reflect the two different methods, or avenues, through which intelligence could be expressed. In other words, Wechsler believed that Spearman’s (1927) concept of general intelligence or g could be assessed though multiple modalities, specifically verbal and nonverbal (Flanagan, McGrew & Ortiz, 2000), and that doing so would reduce errors that might occur if only one approach was used.
intended to measure Gc, also measures Gf due to its reliance on abstract thought) (Kaufman, 1994).
In the past, efforts to link the Wechsler Intelligence Scale for Children (WISC) to theories of intelligence have been driven by the desire to explain or account for the data. Psychologists (e.g., Bannatyne, Kaufman) developed theories of intelligence based on WISC data and then used the WISC data to confirm the theories. This methodological process succumbs to the tautological fallacy (i.e., using data to drive the model to confirm the
model), and fails to provide empirical support for the theory or the test (J.P. Braden, personal communication, December 15, 2008).
As the dichotomous Cattell-Horn Gf-Gc theory of intelligence evolved into a multi-factor model of intelligence, researchers began to evaluate the structure of intelligence tests against this model. “Although there was substantial evidence of at least eight or nine broad cognitive Gf-Gc abilities by the late 1980s, the tests of the time did not reflect this diversity in measurement” (Alfonso, et al., 2005, p. 188).
Driven by theoretical developments independent of the Wechsler Scales, researchers began to investigate the broad cognitive abilities tapped by Wechsler subtests. As a result, researchers began interpreting the WISC-III (Wechsler, 1991) against the multi-factor Cattell-Horn Gf-Gc theory. The analyses revealed that most WISC-III subtests only tapped two broad cognitive abilities, Gc and Gv (consistent with the Verbal-Performance
this evidence it became clear that Wechsler Scales of Intelligence were not reflecting current theoretical views in measuring the array of cognitive abilities thought to comprise general intelligence, or g. “…It is clear that most test authors did not use the theory of fluid and crystallized intelligence and its corresponding research base to guide the development of their intelligence tests. As such a substantial theory-practice gap existed; that is, theories of the structure of cognitive abilities were far in advance of the instruments used to
operationalize them” (Alfonso, et al., 2005, p. 192). CHC Theory and Cognitive Assessment
As CHC theory was accepted as the consensus model for understanding intellectual abilities, test developers began to adopt CHC theory as the foundation on which to base their tests. Overall, the CHC theory has had an impressive impact in the development of
intelligence tests. “Nearly every intelligence test developer acknowledges the importance of CHC theory in defining and interpreting cognitive ability constructs, and most have used this theory to guide directly the development of their intelligence tests” (Alfonso, et al., 2005, p. 188). The theoretical soundness and applicability of the CHC theory has allowed it to narrow the gap between research and practice.
providing evidence for the CHC structure of intelligence, this research also demonstrates that the tests are, in fact, measuring a variety of cognitive abilities consistent with this model (i.e., evidence of test validity based on internal structure).
Overview of Factor Analysis
“Factor analysis is inexorably linked with the development of intelligence theory and intelligence tests. Early intelligence theories and factor-analytic methods were developed in tandem, and the connection continues to this day” (Keith, 2005, p. 581). There are two main types of factor analysis: exploratory factor analysis (EFA), and confirmatory factor analysis (CFA). CFA is typically described as a more theory-driven approach compared to EFA (Keith, 2005). “EFA can be a valuable tool for developing theory, whereas CFA may be better suited for testing existing theory [italics in original]” (Keith, 2005, p. 582).
With EFA, the researcher holds no specific expectations as to the nature and number of factors that will be extracted from the data. If using EFA, the researcher must make a series of decisions regarding the method of factor extraction and rotation to use and the number of factors to retain. In contrast, CFA requires the researcher to specify, in advance, the expected factor structure including (a) the number of factors, (b) which variables will reflect given factors, and (c) whether the factors are correlated (Thompson, 2004).
change on the latent factor (Vandenberg & Lance, 2000). The goal, when assigning factor loadings, is to achieve Thurstone’s simple structure (i.e., as many loadings as possible to be maximally close to either 1.0 or 0.0). In essence, factor rotation allows a researcher to more evenly distribute variability among factors.
There are two main types of factor rotation, orthogonal and oblique. Orthogonal rotation does not assume the latent factors are correlated, while the oblique rotation allows the factors the freedom to correlate (which is expected among the WISC-IV indexes). When factors are uncorrelated (orthogonal rotation), the factor loadings are the correlation
coefficients between the variable and factor, which are equal to the regression weights. However, when the factors are correlated (oblique rotation) the factor loadings are the regression weights (Comrey & Lee, 1992).
Whereas EFA and CFA involve examination of the pattern of factor loadings, CFA is used when a researcher wishes to test the data against a priori specified model of factor patterns and/or loadings (often referred to as restricting the factor solution). The results of the CFA provide “fit statistics” which provide feedback as to how well the data “fit” the
specified model (Keith, 2005). The actual covariance matrix is used to derive parameters (loadings). These estimated parameters are then used to compute a model-implied covariance matrix which is compared to the actual covariance matrix.
null results of the chi-square is the desired outcome. A large chi-square value and a small probability (e.g., p < .05) suggest that the implied variance-covariance matrix and the actual variance-covariance matrix of the data are significantly different; thus, the specified model is a poor fit of the data. When the chi-square is significant, the proposed factor solution is not an accurate representation of the data. However, a small chi-square value and a large
probability (e.g., p > .05) suggests that the implied variance-covariance matrix and the actual variance-covariance matrix of the data are not significantly different; thus, the specified model is an acceptable fit for the data (Keith, 2005).
Although the chi-square is the most common fit statistic used to analyze CFAs, it has two notable limitations. First, the chi-square is directly affected by sample size. Large sample sizes can result in significant chi-square statistics (i.e., suggesting the model is a poor fit for the data) even when the implied and actual variance-covariance matrixes are only slightly incongruent. However, small samples almost always result in non-significant chi-square statistics (i.e., suggesting the model is a good fit for the data) even when the implied and actual variance-covariance matrixes are noticeably different. Second, assuming an
mean square error of approximation [RMSEA], standardized root mean square residual [SRMR]) are often used in addition to the chi-square to test the adequacy of the implied factor structure in a CFA (for more information on additional fit indices see Hu & Bentler, 1998).
Although CFA is a common technique used to test the factor structure of intelligence theory and tests, there are limitations to CFA as a statistical tool. CFA is used to test the accuracy of a single model. Results of the fit statistics yield information either in support or rejection of the model. The simple fact that one model does or does not fit the data provides only limited information about the theory being tested. One model may fit the data well, but other models may fit the data better; or, the model may be a poor fit of the data, but is the best option compared to the alternatives. Furthermore, theories may provide support for multiple factor models and a method is needed for finding the best model for the data. Using different approaches, CFA and various fit statistics can be used to compare competing models. The chi-square difference (2) can be used to test the difference in nested models (used when assessing measurement invariance/equivalence, see Vandenberg & Lance, 2000, pp. 45-47). The Akaike information criterion (AIC) is another method used to compare models with the smaller AIC value suggesting the better model. Similarly, the Bayes
information criterion (BIC) and the Browne-Cudeck criterion (BCC) can also be used to find the best fit model among many (Keith, 2005).
In sum, factor analysis is a common statistical procedure used in the development and validation of many intelligence tests and theories. Whereas EFA does not require the
the “fit” of a specified factor model. Various statistics (e.g., chi-square, TLI, CFI, RMSEA, SRMR) provide information about the “fit” (i.e., good, adequate, poor) of the hypothesized model. Although the fit statistics, as well as CFA, as a statistical tool, have several
limitations, the results can provide valuable information about the validity of a test or theory. CHC Theory and the WISC-IV
The WISC-IV (Wechsler, 2003) included significant modifications to the content and structure of the scale compared to previous editions. The developers of the WISC-IV
abandoned the Verbal-Performance structure of earlier editions and elevated the four-factor structure (originally identified in the WISC-III) as the primary method of score
Table 2
The Subtests that Comprise the WISC-IV Indexes
VCI PRI PSI WMI
Similarities Vocabulary Comprehension Information Word Reasoning*
Block Design Picture Concepts* Matrix Reasoning* Picture Completion
Coding
Symbol Search Cancellation*
Digit Span
Letter Number Seq.* Arithmetic
Note. New subtests are marked with an *; supplemental subtests are italicized.
Table 3
The WISC-IV Subtests and Their Loadings onto Indexes and CHC Broad Abilities WISC-IV Subtests WISC-IV Index CHC Broad Ability Similarities Vocabulary Comprehension Information Word Reasoning Block Design Picture Completion Matrix Reasoning Picture Concepts Arithmetic Digit Span Letter-Number Sequencing Symbol Search Coding Cancellation VCI VCI VCI VCI VCI PRI PRI PRI PRI WMI WMI WMI PSI PSI PSI Gc Gc Gc Gc Gc Gv Gv Gf Gf Gf Gsm Gsm Gs Gs Gs
Table 4
Exploratory Factor Loadings of WISC-IV Subtests
Following the exploratory factor analysis, the developers conducted a CFA using data from the norm group. CFA tests the factor structure specified by the researchers a priori. For the CFA, the developers tested four different models each with a different factor structure. The results revealed that the four-factor model was the best fit (Wechsler, 2003).
Overall, these data were consistent with predictions based on the model driven by the CHC theory. The findings provide evidence for the reciprocal conclusions that (a) the WISC-IV is consistent with the CHC theory, and (b) the CHC theory is supported by the WISC-WISC-IV data. It is important to recognize, however, that most of the research conducted thus far on the CHC theory (with the WISC-IV as well as with other tests of intelligence) has used samples of (normal) hearing children. No research, to date, has employed CFA methods using models based on the CHC theory (e.g., the WISC-IV) to explore the degree to which data from D/HOH samples reflects the CHC factor structure. The question of whether the CHC theory is a parsimonious model of intelligence for D/HOH children is one that is relevant for theoretical and practical reasons, as explained in the following sections.
Unique Aspects of the D/HOH Population
terms and characteristics of this special population as well as prevalence rates, please see Appendix B.
Cognitive Abilities of D/HOH Individuals
More than 75% of the D/HOH children in this country have normally hearing parents and about 70% have normally hearing siblings. In addition, approximately 40% of the
D/HOH children in America are born with their hearing impairment and another 14% acquire their hearing loss before the age of two (Gallaudet Research Institute, 2011). Therefore, the majority of D/HOH children in this country have a prelingual hearing loss and are raised in households in which the primary mode of communication is speech. For the majority of prelingually deaf children, exposure to language does not begin until after the diagnosis of deafness and medical and educational interventions have begun, which can be months or even years after the hearing loss occurs. Even after the diagnosis, the degree of language exposure varies greatly depending on the resources available to the family, the
communication needs of the child, the skills and training needed to learn alternative modes of communication, and the motivation of the family and child. As a result, most D/HOH
children are denied the early and consistent access to language available to normally hearing children. D/HOH children experience fewer, less frequent, and less intense linguistic
For D/HOH children, their hearing loss reduces opportunities to observe and
participate in oral communication (Braden, 1994). Their inconsistent and infrequent exposure to oral expression reduces their opportunities to learn general and culturally specific
knowledge. Their lack of language exposure can adversely affect their intellectual
development, especially for cognitive processes dependent on language and audition (i.e., auditory processing [Ga] and verbal comprehension and reasoning [Gc]; Braden, 2005).
Although some cognitive processes may not be strongly developed for D/HOH individuals, research suggests others (e.g., Gv) may develop in a manner and at a level typical of normally hearing children. Some of the observed differences between deaf and hearing individuals are related to the use of the sign language or dependence on visual experience, whereas other differences are due to the lack of auditory encounters (Marschark, 2006).
Cognitive Differences Between D/HOH and Hearing Individuals
paper-and-pencil tests requiring deaf participants to respond to verbally loaded questions, confounding language abilities with cognitive abilities. Pintner’s flawed methodologies and conclusions led many researchers on a quest to develop nonverbal measures of cognitive abilities appropriate for this special population (Quigley & Paul, 1991).
Pintner’s conclusions about the cognitive inferiority of deaf individuals dominated this area of research until the mid-1900s when Mykelbust (1960) challenged Pintner’s formulations. Through numerous studies, Mykelbust showed that, when controlling for verbally loaded tasks, deaf and hearing individuals are intellectually equal and score similarly on global measures of intelligence (e.g., WISC Full Scale IQ score). However, Mykelbust also noted specific differences between the cognitive abilities of deaf and hearing individuals (e.g., the two groups produced different score profiles on the WISC subtests). These findings led Mykelbust to conclude that there are quantitative similarities but
qualitative differences between the intellectual abilities of deaf and hearing individuals. The observation of these qualitative differences was the basis for Mykelbust’s “organismic shift hypothesis,” stating that the basic experiences of deaf individuals are altered as a result of their hearing impairment, which, as a consequence, alters subsequently developed behaviors, making deaf and hearing individuals inherently different from one another (Quigley & Paul, 1991).
that what differences are observed between the cognitive abilities of deaf and hearing individuals are quite possibly the result of environmental circumstances or design
characteristics rather than inherent differences between the populations (Quigley & Paul, 1991). Quigley and Kretschmer (1982) identified three different types of task influences: “1) the inability of the researcher to properly convey the task demands because of language difference or deficits on the part of the subject, 2) implicit bias within the solution of the task, or 3) general experiential deficits (including verbal language and communication in general) on the part of the subjects” (p. 51).
Yet, despite the possibility that measured cognitive differences between D/HOH and normally hearing individuals may be the consequence of task influences, it is also important to consider environmental influences on deaf individuals. “Beyond the normal heterogeneity seen in the hearing population, differences in the environments and experiences of deaf children and hearing children might lead to different approaches to learning, to knowledge organized in different ways, and to different levels of skill in various domains. Ignoring this possibility not only denies the reality of growing up deaf in a largely hearing world, but jeopardizes academic and future vocational opportunities for deaf children” (Marschark, 2003, p. 464). Most research suggests that deaf and hearing individuals vary in their
approaches to cognitive tasks and that these differences are likely influenced by the mode of communication. However, “different” does not mean “deficient.” Exploring the cognitive differences between deaf and hearing individuals will help psychologists and educators make more informed decisions with the goal of optimizing educational and occupational
In sum, researchers have moved away from the idea that D/HOH and hearing individuals are inherently deficient in their cognitive functioning. Currently, the majority of researchers believe D/HOH and hearing individuals are cognitively similar, and that their test score differences are likely the result of measurement artifacts. Yet, despite these
conclusions, researchers continue to investigate cognitive differences between D/HOH and normally hearing individuals. Numerous studies have been conducted that examine the specific cognitive abilities (e.g., visual-spatial abilities, short-term/working memory) of D/HOH individuals compared to their normally hearing peers.
Research Investigating the Intelligence of D/HOH Individuals
Most of the research investigating the intelligence of D/HOH individuals has focused on differences between language-loaded (i.e., verbal) and language reduced (i.e., nonverbal) tests. Specifically, the majority of the research has explored differences in the means and standard deviations of these two types of intelligence test variations for D/HOH individuals. In considering the CHC theory, verbally loaded tests of intelligence likely tap Gc, and nonverbal tests of intelligence primarily measure a mixture of Gv and Gf abilities. However, past research has not been interpreted in terms of CHC abilities, and current studies have not explored differences among CHC stratum II abilities for D/HOH children.
children also repeatedly score significantly lower (approximately one standard deviation or 15 points) on verbal tests of intelligence compared to those assessing intelligence
nonverbally (Braden, 1994; 2005; Sullivan & Montoya, 1997).
I (Krouse, 2008) conducted a study investigating the psychometric properties of the WISC-IV with D/HOH children. For my sample of D/HOH children (n = 128), I found that the mean PRI (M = 93.21) and VCI (M = 80.86) were significantly lower (p < .001) than the mean of the norm group (M = 100). However, the mean VCI was not significantly lower than one standard deviation from the mean (M = 85). In addition, subtest intercorrelations were assessed among the WISC-IV subtests with Pearson Product Moment correlations. Of the 44 correlations, 29 were significantly greater than zero (i.e., the 95% confidence interval did not contain zero).
Psychologists do not recommend the use of verbal, language loaded, tests (i.e., tests that primarily measure Gc) to measure the general intelligence of D/HOH individuals. Verbal tests confound language skills with intelligence. “There is uniform agreement that systematic deprivation of exposure to verbal, socially specific knowledge impairs performance on verbal scales independent of an individual’s underlying aptitude” (Braden, 1994, p. 76).
Hannah, 1998; Maller, 1996). For D/HOH people, tests of intelligence that measure Gc (but are interpreted as reflecting g) likely tap construct-irrelevant variance (i.e., oral language skills), which will invalidate their meaning as indicators of general intelligence. For this reason, many psychologists and researchers believe that language reduced (or nonverbal) measures of intelligence are more appropriate for estimating general intellectual ability in D/HOH children (Braden, 1994; 2000; Braden & Athanasiou, 2005).
However, the use of nonverbal measures to assess intelligence raises two critical issues. First, it should be noted that very few tests/scales completely eliminate language from directions, content, and responses (McCallum, 2003). Therefore, despite the title of the test or how it “claims” to measure intelligence, only those tests that actually eliminate or drastically reduce the need for language in understanding, processing, and responding to test items are considered truly “nonverbal” (Braden & Athanasiou, 2005).
important in the estimation of g. In other words, many nonverbal tests of intelligence exclude important domains of functioning thought to be fundamental to the construct of interest (i.e., g) (Braden & Athanasiou, 2005; Ortiz & Dynda, 2005). Using only the performance subtests of a test battery to assess the intelligence of D/HOH individuals may lead to construct underrepresentation. Therefore, the concept of construct underrepresentation is cited as support for using verbal intelligence measures with D/HOH children (Braden & Hannah, 1998; Maller, 1996).
Despite this argument however, there has been abundant research showing that g is fairly accurately and easily estimated from even small samples of tests. In other words, g is relatively robust, and does not appear to be highly susceptible to underrepresentation. However, CHC stratum II factors may be more vulnerable to underrepresentation than g, especially if they were systematically omitted from a test battery due to language loading (Jensen, 1998).
Research Investigating the Structure of Intelligence of D/HOH Individuals Few studies have investigated the factor structure of intelligence for D/HOH children. Specifically, four studies investigate the factor structure of intelligence for D/HOH
populations using the Wechsler Scales as the measure of intelligence. Two studies assessed the factor structure of intelligence using the WISC-R, and two studies used the WISC-III.
Scale subtests (i.e., Picture Completion, Picture Arrangement, Block Design, Object Assembly, and Coding) for his deaf sample. Overall, the results supported his hypothesis. Only one factor emerged for the deaf sample and Braden concluded that the WISC-R
Performance Scale measures the same construct (likely comparable to the CHC stratum II Gv ability) in the two groups regardless of differences in language exposure. This study supports suggests that the intelligence has the “same character, or structure, in deaf and hearing children” (p. 406).
Expanding upon Braden’s (1984) study, Sullivan and Schulte (1992) compared the factor structure of the full WISC-R (i.e., both Performance and Verbal Scale subtests) with D/HOH (n = 368) to the standardization sample reported in the WISC-R manual. Sullivan and Schulte administered the WISC-R to D/HOH and hearing children to assess whether the same three-factor structure (i.e., Verbal Comprehension [likely comparable to the CHC Gc ability], Perceptual Organization [likely comparable to the CHC Gv ability] and Freedom from Distractibility [likely comparable to the CHC Gsm ability]) described in the WISC-R Manual (Wechsler, 1974) emerged for both groups. Sullivan and Schulte conducted separate factor analyses for the deaf (n = 291) and hard-of-hearing (n = 71) children; however, the factor structure was identical for the two groups and, therefore, the two groups were combined for further analyses.
WISC-R reported in the manual. For the D/HOH sample, two of the three Freedom from Distractibility subtests (i.e., Arithmetic and Digit Span) loaded onto the Language Comprehension factor and the other subtest (i.e., Coding) loaded onto the Visual-Spatial Organization factor (Sullivan & Schulte, 1992). Overall, the results of this study are inconsistent with Braden’s (1984) conclusions that D/HOH and hearing children have the same intelligence structure. This study found a different factor structure for D/HOH and hearing children for the WISC-R Performance Scale subtests. A likely reason for these findings is the subtests measuring Gc for the norm group are not, in fact, measuring Gc for the D/HOH sample. For D/HOH children, Gc is confounded by language abilities and, as a result, is not a valid measure of intelligence.
Slate and Fawcett (1995) investigated the factor structure of the WISC-III
Performance Scale for D/HOH children (n = 47). Like the previous editions of the WISC, the WISC-III is divided into two scales, the Verbal Scale and the Performance Scale. However, unlike the previous editions, the WISC-III subtests load onto four factors: Verbal
Sullivan and Montoya (1997) investigated the factor structure of the WISC-III with 106 D/HOH children, including both the Verbal Scale and Performance Scale subtests. The results revealed two factors: Visual-Spatial Organization (likely comparable to the CHC Gv ability), and Language Comprehension (likely comparable to the CHC Gc ability). The Freedom from Distractibility (likely comparable to the CHC Gsm ability) and Processing Speed (likely comparable to the CHC Gs ability) factors do not emerge for this special population. Sullivan and Montoya’s findings are not consistent with Slate and Fawcett’s (1995) findings; however, the two-factor structure that emerged for D/HOH children is consistent with Wechsler’s (1939) original belief that two factors underlie intelligence, verbal and nonverbal.
Verbal subtests (i.e., those measuring Gc) are confounded by oral language skills (or lack thereof), and are therefore poor or attenuated measures intelligence for this special group. In other words, the factors extracted from Sullivan and Montoya’s study represent two unique constructs (i.e., language skills and intelligence) rather than two factors (i.e., Gc and Gv) from the same construct (i.e., intelligence). Therefore, the dichotomous factor structure of the WISC-III confounds distinct abilities and language learning opportunities in D/HOH populations.
Summary
structures for D/HOH and hearing children. The different factor structures found for D/HOH and hearing children are likely due to the fact that subtests measuring Gc are not actually assessing intelligence for D/HOH children; rather, these subtests are confounded by the underdeveloped language skills of this unique population. As a result, subtests measuring Gc are not valid for assessing the intelligence of D/HOH children because they are confounded with a distinct underlying construct (i.e., oral language skills).
Overall, however, the previous research investigating the intelligence of D/HOH children have revealed a relatively unitary structure with little differentiation among
cognitive abilities. This finding may be representative of the structure of intelligence for this special population or may be an artifact of the structure of the intelligence test (i.e., the previous editions of the Wechsler Scales of Intelligence have not been consistent with current multi-factor theories of intelligence). Investigating the factor structure of the intelligence of D/HOH children using the new WISC-IV will provide valuable information due to the fact that this latest edition of the Wechsler Scales is grounded in CHC theory.
Measurement Equivalence/Invariance
Investigating the similarity of the factor structure and loadings of a measure (e.g., the WISC-IV) for two or more groups (e.g., hearing vs. D/HOH) is referred to as measurement equivalence/invariance (ME/I). “Measurement equivalence/invariance (ME/I) can be thought of as operations yielding measures of the same attribute under different conditions” (Meade & Lautenshlager, 2004a, p. 61).
several ‘best practices’ for testing ME/I using the CFA methodology. First, the authors suggest conducting a test of equivalent factor structures across groups (i.e., test of configural invariance). Configural invariance involves testing the pattern of free and fixed factor
loadings among groups (Vandenberg & Lance, 2000). If differences between the factor structures are found, then the measures are said to be inequivalent and no further testing is needed. If, however, the results suggest configural invariance across groups then a more stringent test of ME/I can be conducted (i.e, metric invariance).
loadings differ across groups, tests for partial invariance can be conducted (Vandenberg & Lance). “The logic of testing for partial ME/I is that invariance restrictions may hold for some but not all manifest measures across populations, and relaxing invariance constraints where they do not hold controls for partial measurement inequivalence” (Vandenberg & Lance, 2000, p. 18).
If metric invariance (or partial metric invariance) is established, Vandenberg and Lance recommend testing for scalar invariance. Scalar invariance tests the null hypothesis that intercepts of like items’ regressions on the latent variable(s) are invariant across groups (i.e., τg
= τg’). In other words, scalar invariance tests whether the regression intercepts linking the manifest measures to the underlying construct(s) are invariant across groups. Item
intercepts are the values of the observed scores when the latent trait is zero. Scalar invariance implies that the group differences in the means of the observed items are due to differences in the means of the underlying construct. It addresses the question of whether there is
consistency between group differences in observed means and latent means (Steenkamp & Baumgartner, 1998). “Even if an item measures the latent variable with equivalent
regarding group differences, regardless of whether the comparison is as simple as a between-group mean differences test or as complex as testing whether some theoretical structural model is invariant across groups” (Vandenberg & Lance, 2000, p. 9).
ME/I Model Fit
Overall, ME/I model fit refers to evaluating whether the factor model underlying a specific measure or scale is equivalent across different groups. Good model fit provides support that the factor model is invariant across groups whereas poor model fit suggests significantly different factor models across the groups. If results reveal a “good model fit” researchers are justified to continue testing additional areas of ME/I (such as the equivalence of factor loadings and item intercepts); however, a “poor model fit” warrants no further testing (Vandbenberg & Lance, 2000).
ME/I and the WISC-III
Maller and Ferron (1997) investigated the factor structure of the WISC-III for a sample of severely and profoundly deaf children (N = 110) and compared it to the factor structure of the WISC-III identified for the standardization sample (N = 2200). All WISC-III subtest directions were presented in the child’s primary mode of communication. The
correlation matrix from the WISC-III standardization sample was unstandardized, resulting in a covariance matrix used in the analyses. First, the four-factor model identified for the standardization sample of the WISC-III (i.e., Verbal Comprehension, Perceptual
residual [RMSR] = .261, Tucker-Lewis Index [TLI] = .970, comparative fit index [CFI] = .977) and the deaf sample (2 (59) = 52.88, GFI= .935, RMSR = .625, NNFI = 1.013, CFI = 1.00). Next, the factor loadings were constrained to be equal across groups (i.e., test of metric invariance). Overall, metric invariance was not found. However, tests of partial invariance revealed that the unstandardized path coefficients were invariant across the two samples on all subtests except: Block Design, Arithmetic, Digit Span, and Coding. In sum, these four subtests did not indicate the latent construct of intelligence in a similar way across the two samples. Interestingly, the verbal subtests of the WISC-III had equal factor loadings among the hearing and deaf samples.
Purpose of the Present Study
designed in accordance with the CHC theory, it will be used as the tool for assessing the structure of intelligence for this special population.
Documenting ME/I (or lack thereof) for the WISC-IV with D/HOH children and thus gaining insight into the structure of intelligence for this special group has important
theoretical and practical implications. Theoretically, understanding the structure of intelligence for D/HOH children will help guide understanding of the nature and development of cognitive abilities and whether/how they are influenced by hearing impairment, and the development and use of appropriate cognitive tests for D/HOH examinees. Practically, investigating the measurement invariance of the WISC-IV with D/HOH children will provide important data for the validity (or lack thereof) of this scale with this exceptional population.
Hypotheses Hypothesis One: Configural Invariance
I predict that the WISC-IV factor model for the D/HOH sample does not differ significantly from the WISC-IV factor model reported for the norm group. The null hypothesis states that the factor models for the two groups are statistically equal (i.e.,
Hypothesis Two: Metric Invariance
I predict that the WISC-IV variable factor loadings for the D/HOH sample do not differ significantly from the same WISC-IV variable factor loadings for the norm group. A test of metric invariance will be conducted by constraining the matrix of factor loadings to be equal across the two groups. The null hypothesis states that the factor loadings of the two groups are statistically equal (Ho: hearing = D/HOH). If the results fail to reject the null hypothesis (i.e., the factor loadings do not differ across groups) and metric invariance is established, then I plan to proceed to Hypothesis Three. If the null hypothesis is rejected and I find a lack of metric invariance, then I plan to conduct tests of partial metric invariance to determine the source(s) of the variance.
Hypothesis Three: Differences in Mean Scores
I predict that the mean PRI and VCI scores for the D/HOH sample are significantly lower than the mean PRI and VCI scores reported for the norm group in the WISC-IV
Technical and Interpretive Manual (Wechsler, 2003), which are thought to reflect population values (M = 100). These hypotheses will be tested using a one-tailed, one-sample t-test.
I predict that the mean PSI score for the D/HOH sample does not differ significantly from the mean PSI score reported for the norm group in the WISC-IV Technical and
Interpretive Manual (Wechsler, 2003), which is thought to reflect the population value (i.e., M = 100). This hypotheses will be tested using a two-tailed, one-sample t-test.
Hypothesis Four: Subtest Intercorrelations
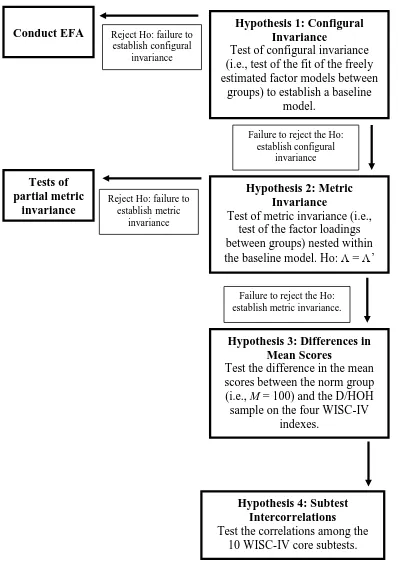
Figure 2. Path Diagram of Study Hypotheses.
Hypothesis 1: Configural Invariance
Test of configural invariance (i.e., test of the fit of the freely estimated factor models between
groups) to establish a baseline model.
Reject Ho: failure to establishconfigural
invariance Conduct EFA
Failure to reject the Ho: establish configural
invariance
Hypothesis 2: Metric Invariance
Test of metric invariance (i.e., test of the factor loadings between groups) nested within the baseline model. Ho: = ’
Failure to reject the Ho: establish metric invariance. Reject Ho: failure to
establishmetric invariance Tests of
partial metric invariance
Hypothesis 3: Differences in Mean Scores
Test the difference in the mean scores between the norm group (i.e., M = 100) and the D/HOH sample on the four WISC-IV
indexes.
Hypothesis 4: Subtest Intercorrelations Test the correlations among the
CHAPTER 2 Method Study Changes
Due to significant obstacles with data collection, the WISC-IV Working Memory (WM) subtests (i.e., Digit Span and Letter-Number Sequencing) scores and subsequently the Working Memory Index (WMI) scores were eliminated from all analyses. Therefore, the current study only examined a three-factor structure of the WISC-IV with deaf and hard-of-hearing (D/HOH) children as opposed to the four-factor structure described in the WISC-IV Technical and Interpretive Manual (Wechsler, 2003) for the norm group. The rationale for eliminating the WM subtests and Index score is provided below.
The WM subtests of the WISC-IV and D/HOH Examinees
It is common practice, outlined in theStandards for Educational and Psychological Testing (AERA, APA, and NCME, 1999) that all individuals are tested in their primary mode of communication. Therefore, a psychologist wishing to give the WISC-IV to a D/HOH child who communicates via sign language must administer the assessment in the primary mode of communication-sign language. Administering the WISC-IV in sign language significantly changes the delivery structure and content of the Working Memory subtests. Because the subtests are administered vocally, and therefore tap the phonological loop (rather than the visual-spatial sketchpad asset of Working Memory), administration of these tests via visual signs or media alter the fundamental construct that is measured. For this reason,
There are two main reasons why psychologists do not administer the WM subtests of the WISC-IV to D/HOH children. The first reason is that when the subtest administration is changed from oral to visual (i.e., sign language), the construct being measured changes from auditory working memory to visual working memory. Research has shown that WM (i.e., Gsm) for deaf children is positively correlated with their oral language skills and negatively correlated with their degree of hearing loss (Marschark, 2006). Hearing individuals have longer memory spans than deaf individuals, and deaf individuals who use spoken language have longer memory spans than deaf individuals who use sign language (Mayberry & Eichen, 1991). The difference among these groups may be due to use of different encoding systems (i.e., phonological vs. visual-spatial), or to differences in working memory
management. A plethora of evidence (e.g., MacSweeney, et al, 1996; Wilson & Emmorey, 1997a, 1997b) suggests that individuals who use spoken language rely on the phonological loop of working memory, whereas individuals who use sign language rely on the visual-spatial sketchpad (Marschark, 2003). Deaf and hearing individuals appear to the have same working memory capacity, but signs take longer to articulate than words, and are less amenable to subvocalization strategies required for using phonological loop capacity, therefore negatively affecting the working memory capacity of deaf individuals (Marschark, 2003; 2006).
backward recall of linguistic stimuli; in contrast, hearing individuals in their study (and in all norm groups) performed substantially worse on backward recall compared to forward recall. This finding suggests that WM for speech and sign differ in how they represent serial order information. Furthermore, deaf individuals were better than hearing individuals on
nonlinguistic spatial memory, suggesting that expertise in visual-spatial language (i.e., sign language) may influence other forms of visual-spatial memory. Considering the differences in how the subtests are administered to D/HOH children and the different neurological processes evoked (compared to hearing children), psychologists question the content validity of the WM subtests with this special population and, therefore, do not administer these tests to D/HOH children.
Despite the empirical implications for administering the WM subtests of the WISC-IV to D/HOH children, there is also the practical reality that psychologists serving the D/HOH population do not administer the WM subtests of the WISC-IV to this special population. Only in very rare cases are the WM subtests administered and scored. Dr.
Natasha Kordus, a psychologist at the California School of the Deaf, said that in the past five years, she has administered these subtests only about 10 times (personal communication, May 21, 2011). Other psychologists with whom the researcher has communicated during the data collection process have reported either eliminating the WM subtests from the WISC-IV core battery or choosing a different cognitive assessment (such as the Wechsler Nonverbal Scale of Intelligence, Wechsler & Naglieri, 2006).
WMI scores have been dropped from the factor structure analyses. When a reference is made to the factor structure of the WISC-IV in the following discussion, the reader is reminded that the WISC-IV WM subtest (i.e., Digit Span and Letter-Number Sequencing) and WM Index scores are excluded along with the Full Scale IQ score.
Participants and Examinees
This study drew a distinction between participants and examinees. The participants were psychologists who volunteered to provide data on the WISC-IV with D/HOH children. The examinees were those D/HOH children on which the WISC-IV data were collected. In other words, the participants (i.e., the psychologists) tested the examinees (i.e., the D/HOH children) with the WISC-IV and supplied these data to me (i.e., the researcher).
Recruitment
The participants were practicing psychologists who were recruited at area conferences, postings on deafness/psychology-related Listservs and websites and by telephone (see Appendixes C and D). Interested psychologists provided their names and e-mail addresses (as e-e-mail served as the primary mode of communication for the duration of the study). These psychologists provided archival data on D/HOH examinees who were tested with the WISC-IV for purposes other than research (e.g., educational placement, clinical or vocational assessment).
prelingual onset of hearing impairment (i.e., defined in this study as a hearing loss that occurs prior to the age of 5), (d) have a hearing impairment as their primary disability (if they have more than one), and (e) have been tested on the WISC-IV as part of a previous psychological evaluation (e.g., educational placement, clinical diagnosis). Participants were requested to exclude examinees not meeting all the selection criteria.
Procedure
The participants were sent a consent form via e-mail, which they printed, signed, and returned by either ground mail or facsimile (see Appendix E). Due to the insecure nature of e-mail, this consent form also had a space designated for the participants to supply a
password. This password was used to encrypt the files and aid in the maintenance of
Demographic Data
Table 5
General Background and Hearing Loss Data Gathered for Each D/HOH Child
Variables Possible Values
Age Grade Gender Ethnicity
Additional disabilities
Primary Mode of Communication Degree of Hearing Loss Pure Tone Average Better ear with aid Better ear without aid Type of Hearing Loss Age of Onset
6 years, 0 months – 16 years, 11 months 1st – 12th grade
Male, Female
White, Black, Hispanic, Asian/Pacific Islander, Other/Unknown
Any DSM-IV Diagnosis or disability identified in IDEIA-04
ASL, Other Sign, Aural/Oral, Cued Speech, ASL and Oral, Other
Mild, Moderate, Severe, Profound, Unknown
All possible PTA ranges All possible PTA ranges
Table 6
Setting and Test Administration Data Gathered for Each D/HOH Child
Variables Possible Values
Setting
Reason for Referral
Residential School for the deaf, Commuter School for the deaf, Program within Public School, Public School with Supplemental Services, Private School, Public School with no services, Other
Initial Evaluation, Triennial Reevaluation, Change of Service/Diagnosis, Initial Evaluation for Admission, Other
WISC-IV Data
Table 7
WISC-IV Data Gathered for Each D/HOH Child
Subtest Scaled Scores Standard Scores
Block Design Similarities
Picture Concepts Coding
Vocabulary Matrix Reasoning Comprehension Symbol Search
Verbal Comprehension Index Perceptual Reasoning Index Processing Speed Index
Predictions and Analyses Sample Size
In addition to collecting WISC-IV data from practicing psychologists, I also used data that were previously collected as part of a research study entitled “The Reliability and