ABSTRACT
PARKS, WESLEY RYAN. Structure of the Eastern U.S. Wheat Powdery Mildew Population. (Under the direction of Christina Cowger.)
Structure of the Eastern U.S. Wheat Powdery Mildew Population
by
Wesley Ryan Parks
A thesis submitted to the Graduate Faculty of North Carolina State University
in partial fulfillment of the requirements for the Degree of
Master of Science
Plant Pathology
Raleigh, North Carolina
2007
Approved by:
___________________ ___________________ Dr. Ignazio Carbone Dr. J. Paul Murphy
ii BIOGRAPHY
iii
TABLE OF CONTENTS
LIST OF FIGURES... iv
LIST OF TABLES ... vi
CHAPTER ONE – Virulence Structure of the Eastern U.S. Wheat Powdery Mildew Population ... 1
Introduction... 1
Materials & Methods... 3
Results ... 6
Discussion... 9
Literature Cited... 15
CHAPTER TWO – Single Nucleotide Polymorphism Analysis of Eastern U.S. Wheat Powdery Mildew Population Structure ... 37
Introduction ... 37
Materials & Methods... 40
Results... 44
Discussion ... 46
iv
LIST OF FIGURES
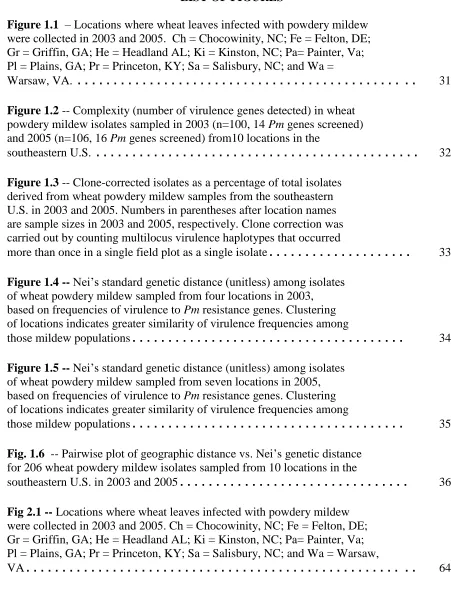
Figure 1.1 – Locations where wheat leaves infected with powdery mildew were collected in 2003 and 2005. Ch = Chocowinity, NC; Fe = Felton, DE; Gr = Griffin, GA; He = Headland AL; Ki = Kinston, NC; Pa= Painter, Va; Pl = Plains, GA; Pr = Princeton, KY; Sa = Salisbury, NC; and Wa =
Warsaw, VA. ... .. 31 Figure 1.2 -- Complexity (number of virulence genes detected) in wheat
powdery mildew isolates sampled in 2003 (n=100, 14 Pm genes screened) and 2005 (n=106, 16 Pm genes screened) from10 locations in the
southeastern U.S. ... 32 Figure 1.3 -- Clone-corrected isolates as a percentage of total isolates
derived from wheat powdery mildew samples from the southeastern U.S. in 2003 and 2005. Numbers in parentheses after location names are sample sizes in 2003 and 2005, respectively. Clone correction was carried out by counting multilocus virulence haplotypes that occurred
more than once in a single field plot as a single isolate... 33 Figure 1.4 -- Nei’s standard genetic distance (unitless) among isolates
of wheat powdery mildew sampled from four locations in 2003, based on frequencies of virulence to Pm resistance genes. Clustering of locations indicates greater similarity of virulence frequencies among
those mildew populations... 34 Figure 1.5 -- Nei’s standard genetic distance (unitless) among isolates
of wheat powdery mildew sampled from seven locations in 2005, based on frequencies of virulence to Pm resistance genes. Clustering of locations indicates greater similarity of virulence frequencies among
those mildew populations... 35 Fig. 1.6 -- Pairwise plot of geographic distance vs. Nei’s genetic distance
for 206 wheat powdery mildew isolates sampled from 10 locations in the
southeastern U.S. in 2003 and 2005... 36 Fig 2.1 -- Locations where wheat leaves infected with powdery mildew
were collected in 2003 and 2005. Ch = Chocowinity, NC; Fe = Felton, DE; Gr = Griffin, GA; He = Headland AL; Ki = Kinston, NC; Pa= Painter, Va; Pl = Plains, GA; Pr = Princeton, KY; Sa = Salisbury, NC; and Wa = Warsaw,
v
Fig. 2.2 -- Plot of rarefaction-derived estimates of the expected number of genotypes E(Gn) found in a population of n individuals from each sampling site based on haplotype diversity found for 141 isolates from 10 sites in the eastern U.S. The slope of the rarefaction curve indicates the rate of genotype accumulation as sampling number increases with steeper slopes indicating
increased population richness... 65 Fig. 2.3 -- Maximum-likelihood DNA sequence phylogram of 141 powdery
mildew isolates obtained in 2003 and 2005 from 10 locations in the eastern
vi
LIST OF TABLES
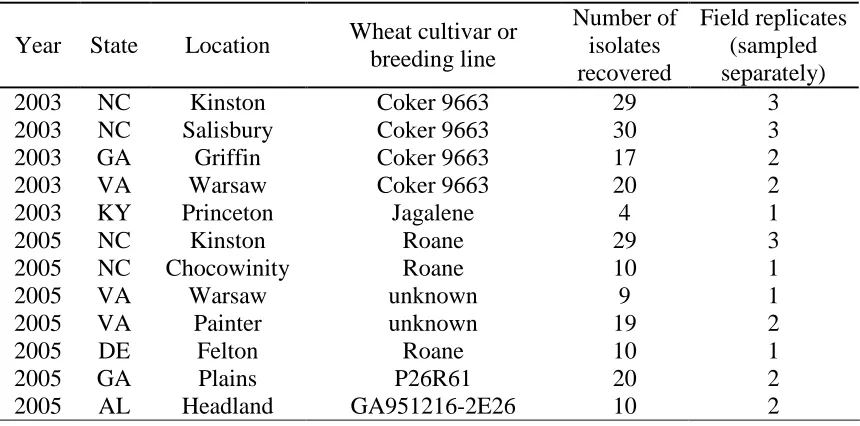
Table 1.1 – Origin of wheat powdery mildew isolates recovered in 2003
and 2005 from leaves collected in the field... 20 Table 1.2 – Pedigree of powdery mildew (Pm) differential wheat lines
used in virulence screening of wheat powder mildew isolates from 2003
and 2005... 21 Table 1.3 – Proportion of isolates virulent to wheat powdery mildew (Pm)
resistance genes collected from three states in 2003... 22 Table 1.4 – Proportion of isolates virulent to wheat powdery mildew (Pm)
resistance genes collected from three states in 2005... 23 Table 1.5 – Most frequent multilocus virulence haplotypes of wheat
powdery mildew isolates collected from four states in 2003... 24 Table 1.6 – Most frequent multilocus virulence haplotypes of wheat
powdery mildew isolates collected from four states in 2005... 25 Table 1.7 -- Most frequent virulence haplotypes of wheat powdery mildew
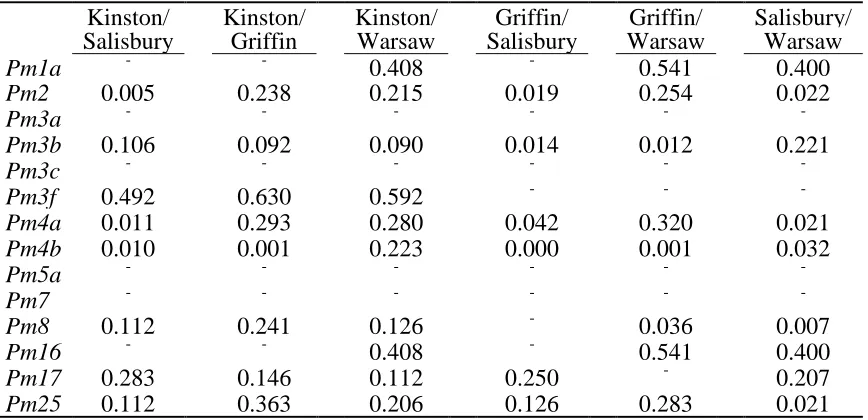
from six states in 2003 and 2005 ... 26 Table 1.8 – P-values from pairwise location comparisons by Fisher’s
exact test of virulence frequencies of wheat powdery mildew isolates
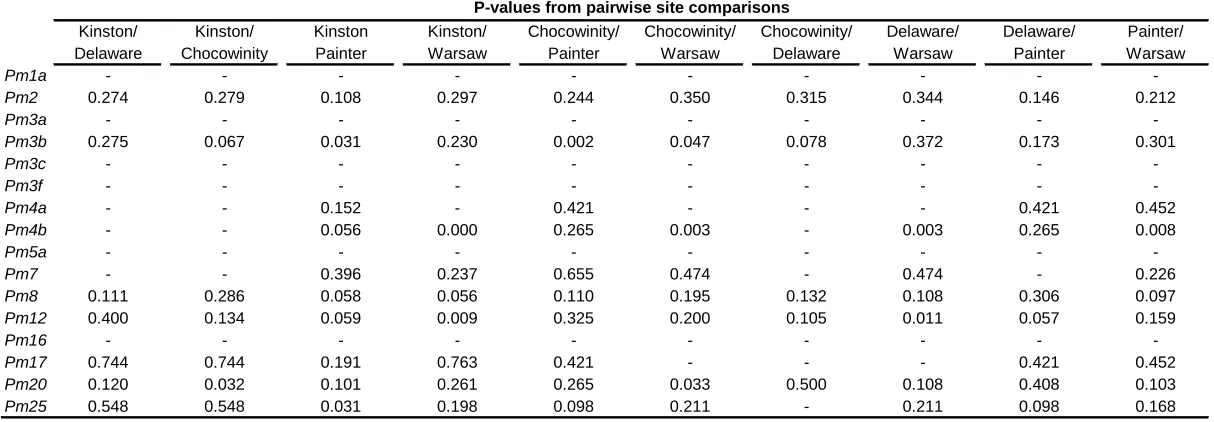
collected in 2003... 27 Table 1.9 -- P-values from pairwise location comparisons by Fisher’s
exact tests of virulence frequencies of wheat powdery mildew isolates
collected in 2005... 28 Table 1.9 continued ... 29 Table 1.10 – Linkage between pairs of wheat powdery mildew
virulence/avirulence loci in clone-corrected sample of 2003 and 2005
isolates from 10 eastern U. S. locations ... 30 Table 2.1 – Primers used as markers for the detection of SNPs in the
vii
Table 2.2 – Diversity indexes, sampling scheme, and distribution of 15
B. g. tritici haplotypes across10 sampling locations in the eastern U. S... 62 Table 2.3 – Total population variance and percent contribution of each
variance component from AMOVA conducted on 141 B. g. Tritici isolates
1
CHAPTER ONE -- VIRULENCE STRUCTURE OF THE EASTERN U.S.
WHEAT POWDERY MILDEW POPULATION
INTRODUCTION
Blumeria graminis (DC.) E. O. Speer f. sp. tritici (Em. Marchal) causes powdery mildew of wheat (Triticum aestivum), a disease that may cause significant damage in many wheat-growing areas of the world, with yield losses up to 34% on susceptible cultivars (27). In fall-sown cereals, primary B. graminis inoculum is thought to originate mainly from cleistothecia (chasmothecia, or sexual fruiting bodies) produced at the end of the previous growing season by compatible mating types (5,15). With annual sexual reproduction, virulence gene combinations may be frequently shuffled (36). When environmental
conditions are favorable, the pathogen undergoes multiple cycles of asexual reproduction (via conidia), selecting for effective virulence combinations in fit backgrounds prior to leaf
senescence and cleistothecial production (35).
Current methods of wheat powdery mildew control are chemical fungicides and resistant cultivars, with the majority of resistance being conferred by single genes (17,18,27). There are currently 49 identified alleles at 33 loci conferring resistance to wheat powdery mildew (23). Intensive agricultural production of wheat cultivars with one or a few resistance genes and wind-aided dispersal of conidia lead to rapid adaptation and spread of the pathogen population (33) and low durability of resistance.
2
performed (9,13,19,21,25,27,28,30). Wheat breeders use virulence frequencies to determine the usefulness of incorporating particular powdery mildew resistance genes (Pm genes)into their breeding materials (9). In the southeastern United States soft red winter wheat
production area, the most recent survey of virulence was from the 1993 and 1994 growing seasons (27). Cultivars used by growers have changed since 1994, and changing selective pressures of Pm genes are likely evident in population virulence shifts. Currently, wheat breeders rely on collaborative observations of field plots with experimental lines and
breeding stocks to determine the effectiveness of Pm genes, but epidemics often do not occur in breeding nurseries with adequate frequency or intensity for germplasm evaluation.
Current information about U.S. powdery mildew population virulence can assist resistance breeding.
Past virulence studies have indicated that the eastern U.S. mildew population is subdivided between the northeastern and southeastern states, such that individual Pm genes may be effective in some areas and not in others (16). It is unknown whether such
differences result mainly from recent appearances of resistance-breaking isolates, restricted gene flow, or disparities in use of Pm genes among wheat-growing regions.
Our objectives were to determine virulence frequencies in locations representative of the eastern U.S. wheat powdery mildew population and analyze geographic virulence
differences. In order to make these assessments, a collection of B. graminis f. sp. tritici
3 MATERIALS AND METHODS
Sample collection and isolation preparation. Samples of cleistothecia on senescent wheat leaves from the eastern U.S. (Fig.1.1) were collected by collaborators in 2003 and 2005 (Table 1.1). Leaves from susceptible cultivars were sampled to avoid selection of the mildew population. The method of Niewoehner and Leath (27) was modified to more rapidly obtain isolates derived from single ascospores. Several leaves bearing abundant cleistothecia were selected from each location. Ascospore release was induced by placing leaves bearing cleistothecia on moist filter paper in the lid of a Petri plate, and placing the plate in a growth chamber at 17oC with 12 hours of light. After four days, detached leaves of the susceptible cultivars Jagalene (PVP 200200160) or Chancellor (CI 12333) were placed on 50 mg/L benzimidazole-amended 0.5% water agar under the maturing cleistothecia. After 24 hours, the detached leaves were removed from beneath the cleistothecia and placed in a 17oC growth chamber with 12 hours of light, and fresh detached leaves were placed under the maturing ascospores for 24 more hours. This process was repeated for at least seven days to ensure that an adequate number of ascospores was allowed to germinate on susceptible tissue.
Seven days after removal from beneath the maturing cleistothecia, detached leaves were examined for mildew colonies. Under a dissecting microscope, individual colonies were subcultured using a dissecting needle to transfer conidia to fresh leaf tissue. When possible, two or three isolates were recovered from each cleistothecia-bearing leaf.
4
enough conidia were not available to inoculate at least six Petri plates, two or three plates were inoculated, and after eight days, increases were repeated.
Inoculation and rating. Once sufficient conidia were present, each isolate was inoculated onto separate Petri plates containing detached leaves of a set of wheat resistance gene differentials, with each differential line bearing one Pm gene, in order to postulate a virulence profile (Table 1.2). Samples from 2003 were inoculated on differential lines containing 14 different alleles, and isolates from 2005 were inoculated on these 14 lines plus two more, for a total of 16 resistance alleles tested. Chancellor was used as a susceptible control in all trials. Experimental units for inoculation were individual Petri plates containing all differential lines and susceptible controls. For replication, each of the
differential plates contained two detached leaves from each differential line, and each isolate was inoculated on two plates of the differentials.
Disease severity on each leaf segment was rated eight and nine days post-inoculation using the following scale: 0 - no symptoms, 1 - faint chlorotic speck, 2 - chlorotic lesion, 3 - necrotic lesion, 4 - first sign of mycelium, 5 - one or two healthy colonies with conidia, 6 - <20% coverage with healthy pustules, 7 - 20-50% coverage with healthy pustules, 8 - >50% coverage with medium to large pustules, 9 - ~100% coverage with large pustules (22). Ratings of 0 to 3 were designated as resistant (R), 4 to 6 as intermediate (I), and 7 to 9 as susceptible (S).
5 previous virulence surveys (27).
Possible associations of alleles at pairs of avirulence loci were investigated by
conducting Fisher‟s exact tests on clone-corrected isolates from both years. Clone correction was performed to prevent biasing the association tests by inadvertent over-sampling of particular genotypes. Clone correction was carried out by counting multiple isolates from the same field plot with the same multilocus virulence haplotype as a single isolate. Both
linkage and independent assortment have been found among avirulence loci in cereal
powdery mildews (2,12). Linkage of host resistance loci could also account for associations of avirulence alleles at the corresponding pathogen loci; in this case, a pyramid of defeated resistance genes would select for multiply virulent pathogen isolates. Assuming an absence of linkage in either host or pathogen, isolates virulent at a given locus should on average assort 1:1 virulent:avirulent at any other virulence locus. Significant deviations from 1:1 thus suggest linkage of loci. Fisher‟s exact tests were also used to determine significant
differences in virulence frequencies among geographic locations by comparing the actual and expected frequencies of virulence in tests of all locations together, as well as testing each possible pair of locations.
Multilocus virulence haplotypes were analyzed using Map (1) within SNAP
workbench version 1.0 (1,29). Isolate virulence haplotypes, with Pm gene reactions coded as either R or S, were manually converted to standard FASTA format. Isolates that had
6
the effectiveness of the sampling scheme and address questions of possible isolate clonality and population diversity among replicate plots in a field.
Nei‟s (26) standard genetic distance computes a matrix of genetic distance (GST)
from gene frequencies. To automate this calculation, frequencies of virulence summed over locations were input into GENDIST (4). Rooted trees were inferred from distance matrices using NEIGHBOR with the Unweighted Pair Group Method with Arithmetic Mean
(UPGMA) and random number seed options from PHYLIP (4). All missing data were excluded from this analysis. It was hypothesized that as the geographic distance between locations increased, the genetic distance between the corresponding isolate populations would increase. To test whether the data were consistent with an isolation by distance
model, GST was plotted against geographic distance, and a regression analysis was performed.
RESULTS
One hundred isolates from 2003 and 107 isolates from 2005 were recovered from cleistothecial samples (Table 1.1). Isolates were collected from four states and five locations in 2003, and five states and seven locations in 2005. From the samples collected west of the Appalachian Mountains, only four viable isolates could be derived in 2003 (those from Princeton, KY), and none in 2005, despite repeated efforts. As few as one and as many as 12 leaves produced viable isolates from each location and year. A few isolates reproducibly provoked both resistant and susceptible interactions on the same differential line, a
7
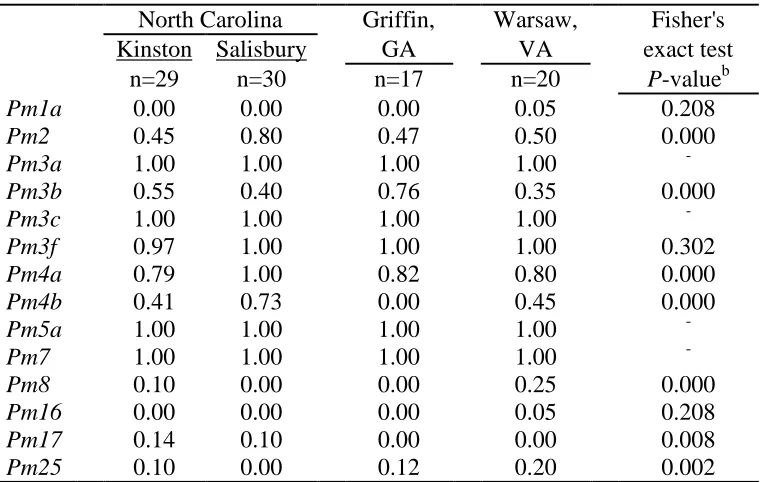
Proportions of isolates virulent to each Pm gene are given in Tables 1.3 and 1.4 for the years 2003 and 2005, respectively. The following percentages apply only to fully virulent isolates, not to those that provoked intermediate reactions. Averaging across
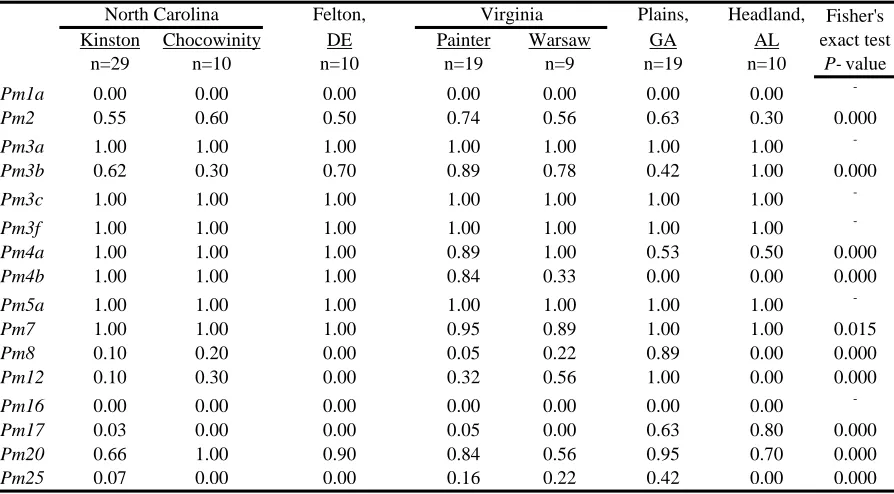
locations and years, in 2003 and in 2005, over 90% of isolates were virulent to Pm3a, Pm3c, Pm3f, Pm5a, and Pm7;virulence to Pm2 was present in over 50% of isolates; and fewer than 10% of all isolates were virulent to Pm1a, Pm16, Pm17, and Pm25. Although it must be kept in mind that sample locations differed between years, mean increases in virulence were observed from 2003 to 2005 as follows: Pm8 virulenceincreased from 7% of isolates in 2003 to 21% in 2005; Pm3b virulence from 48% to 66%; and Pm4b virulence from 42% to 65%. Complete virulence to Pm17 was rare in both 2003 and 2005, with no virulent isolates in 2003 and only one virulent isolate in 2005. However, levels of intermediate Pm17
virulence increased from 9% in 2003 to 20% in 2005.
8
to a minimum of seven and a maximum of 13 of the 16 resistance genes screened (Fig 1.2). Possession of the same multilocus virulence haplotype, especially among isolates from the same field plot, suggests but does not prove isolate clonality. The haplotype data suggest that our isolate population may contain a modest percentage of clones (Fig. 1.3). The lowest haplotype diversity was in Felton, with only four unique haplotypes among 10 isolates from a single plot in 2005. Diversity in Warsaw, Kinston, and Plains was highest, with over 80% of sampled isolates having multilocus virulence haplotypes unique to their plot. Overall, 67% of isolates had unique haplotypes in their plots.
In 2003, there were significant differences among locations in the frequencies of virulence to seven Pm genes (Table 1.3). Results of pairwise virulence comparisons of locations in 2003 appear in Table 1.8. In 2003, isolates from Kinston and Warsaw had the lowest number of significant virulence frequency differences (zero), and isolates from Warsaw and Salisbury had the largest number (five). In 2005, there were significant differences among locations in the frequencies of virulence to 10 Pm genes(Table 1.4). Felton virulence frequencies did not differ significantly from those of three other locations in 2005 (Table 1.9), perhaps owing in part to the small Felton sample size. Plains had the largest number of virulence frequency differences (seven each with Kinston and Painter).
Phylograms for each year based on Nei‟s genetic distance (GST) matrices for
9
analysis of geographic distance between locations versus genetic distance between locations indicated a significant linear relationship (Fig. 1.6, R2 = 0.40, P < 0.001) suggesting isolation by distance.
Associations between alleles at pairs of virulence loci were detected by chi-squared tests (Table 1.10). Significant interactions between pairs of loci were categorized as positive or negative associations. In a positive association, virulence at one locus was associated with virulence at the second locus, or conversely avirulence was associated with avirulence. In a negative association, virulence at one locus was associated with avirulence at the other.
DISCUSSION
This is the first survey of eastern U.S. wheat powdery mildew virulence frequencies since Niewoehner and Leath‟s report (27) on the 1993-94 mildew population. Few changes are evident since the previous survey. Of the Pm genes used in our study, only Pm1a, Pm8, Pm12, Pm17, and Pm25 appear to remain effective in the field (authors‟ personal
observations). Most of the Pm genes in our differential set have long been deployed in commercial U.S. production. Commercial cultivars with Pm2, Pm3a, Pm5a, and Pm8 have been in field use for at least 10 years in the eastern U.S. (27). Cultivars with Pm17 (7,8) were released in 2002 and were widely planted starting in 2003 in the eastern U.S., although
Pm17 was deployed in the U.S. Great Plains in the early 1980‟s. Pm1a has been available in adapted germplasm, and is currently utilized in NC-Neuse (PI 633037) (24), and Pm25 (31) has not yet been deployed in commercial production. Our surveys indicate that virulence to
10
frequency of Pm8 and Pm17 virulent isolates detected at Plains, GA in 2005. The low detected levels of Pm25 virulence were as expected.
Commonly used alleles at the Pm3 and Pm4 loci are largely defeated in the U.S. The frequency of virulence to Pm3b and Pm4a has increased since 1994 in North Carolina, where mildew epidemics are relatively common, but not in Georgia, where epidemics are less common. No clear trend in virulence to Pm4b was evident since 1994, when Niewoehner and Leath (27) found that 62% of Georgia isolates and 81% of North Carolina isolates were virulent to Pm4b (sample sizes not given). In our survey, 41% of North Carolina isolates were virulent to Pm4b in 2003, and 100% in 2005, while no Pm4b-virulent isolates were found in Georgia either year. Given the infrequent occurrence of mildew epidemics in Georgia, genetic drift due to a population bottleneck may account for the absence of Pm4b
virulence detected in this survey as compared to the high frequency found in the 1994 Georgia sample.
In the 1993-94 survey, virulence to Pm7 was at high levels in the mildew population. The original source of Pm7 was the breeding line „Transec‟ (CI14189), which was derived from a wheat-rye chromosome translocation and was used in many U.S. wheat breeding programs beginning in the last 1960‟s (3). However, few if any cultivars have been released and grown from Transec-containing germplasm. With a single exception, all isolates
surveyed in 2003 and 2005 were virulent to Pm7. The high levels of virulence to Pm7 may be due to reduced expression of genes transferred from related species (11).
11
failed to mature and release ascospores under controlled conditions conducive to obtaining ascospores from more easterly samples, especially as the 1993-94 study did not have similar difficulties (27). Perhaps B. graminis does not reproduce sexually every year in the Midwest and Plains states. Host maturity and moisture have an important effect on whether
cleistothecia become “ripe to spore” (32,34), and our western samples were likely collected from less mature plants than the eastern samples, as collection dates were similar. Also, nutritional deficits during early developmental stages of the “generative” (cleistothecium-forming) mycelia could prevent cleistothecia from maturing ascospores later (6). In any case, viable conidial samples from west of the Appalachians have been obtained and will be included in future population genetic and virulence studies.
Screening with 16 differential lines, we found that the majority of isolates were virulent to 8-10 resistance genes, with a maximum of 13 virulences. Niewoehner and Leath (27) found most isolates virulent to seven of the 15 screened Pm genes and a maximum of 12 virulence genes in a single isolate in 1994. Due to differences between the surveys in the number and identity of resistance genes used, the results cannot be directly compared to determine if the U.S. mildew population complexity has increased in the last decade.
12 employed.
The chi-squared and Nei‟s distance analyses reported in Tables 1.8 and 1.9 and Figs. 1.4 and 1.5 address whether differences in virulence among U.S. wheat powdery mildew populations increase with geographic separation. We found an increase in virulence frequency dissimilarity with increasing geographic distance (Fig. 1.6), although the relationship was stronger in 2005 than in 2003, likely due to the larger number of sampled locations. There are at least two possible reasons for this association: 1) differences in frequencies of commercially deployed Pm genes increase with geographic distance, and/or 2) mildew populations are subdivided geographically, with restricted gene flow among
locations. To investigate the second possibility, research is currently underway using markers that are not directly under selective virulence pressure.
Similar but not identical results were obtained by assessing differences in virulence frequencies across locations using Nei‟s genetic distance and Fisher‟s exact tests. For 2003, the phylogram based on Nei‟s genetic distance indicates that the Griffin population is the outgroup (Fig. 1.4), while chi-squared analysis indicated the Salisbury population was the most different (Table 1.8). Fisher‟s exact test examines each locus independently, while Nei‟s genetic distance accounts for gene frequencies at all loci in a cumulative, single estimator of genetic distance. As such, Nei‟s genetic distance is more accurate if the underlying assumptions are correct (constant effective population size, differences between populations arise from drift and mutation, all loci have same mutation rate) (26).
13
corresponding avirulence loci are linked (most of the Pm gene pairs with “+” association type
in Table 1.10) should be the most durable because recombination between linked pathogen loci would be uncommon, especially if virulence to each pyramided gene was at a relatively low level. To overcome such a pyramid, an isolate would have to acquire inactivating mutations at each avirulence locus. However, once multiple virulence genes were combined in the same background, they would likely stay linked in the population.
Virulences to Pm8 and Pm12 were positively associated, with about 60% of isolates avirulent at both loci and about 30% virulent at both loci (Table 1.10). Pm12 was
introgressed from Aegilops speltoides into the UK spring wheat cultivar Wembley (14). As this gene is not known to be present in U.S. wheat cultivars, the association of Pm8 virulence and Pm12 virulence is not due to the selective effects of a resistance gene pyramid. Rather, it may be the result of pathogen genetic linkage or of pleiotropy (the same pathogen effector recognized by both Pm genes). Positive but weaker associations were observed between virulence to Pm8 and Pm17, and also Pm12 and Pm25, suggesting that these loci may be loosely linked in the pathogen. Pm8 and Pm17 are allelic in U.S. wheat cultivars, which possess the T1BL-1RS rye (Secale cereal L.) translocation (10), so the two alleles could be combined only if a plant were heterozygous and the alleles were codominant.
14
15 LITERATURE CITED
1 Aylor, D. L., Price, E. W., and Carbone, I. 2006. SNAP: Combine and Map modules for multilocus population genetic analysis. Bioinformatics 22:1399-1401.
2 Brown, J. K. M., and Jessop, A. C. 1995. Genetics of avirulence in Erysiphe graminis f. sp. hordei. Plant Path. 44:1039-1049.
3 Driscoll, C. J., and Jensen, N. F. 1965. Release of a wheat-rye translocation stock involving leaf rust and powdery mildew resistances. Crop Sci. 5:279-280.
4 Felsenstein, J. 1989. PHYLIP - Phylogeny Inference Package (Version 3.2). Cladistics 5:164-166.
5 Goetz, M., Friedrich, S., and Boyle, C. 1996. Development of cleistothecia and early ascospore release of Erysiphe graminis DC. f. sp. tritici in winter wheat in relation to host age and climatic conditions. Z. Pflanzenkr. Pflanzenschutz 103:134-141.
6 Gotz, M., and Boyle, C. 1998. Haustorial function during development of cleistothecia in Blumeria graminis f. sp. tritici. Plant Dis. 82:507-511.
7 Griffey, C. A., Rohrer, W. L., Pridgen, T. H., Brooks, W. S., Chen, J., Wilson, J. A., Nabati, D., Brann, D. E., Rucker, E. G., Behl, H. D., Vaughn, M. E., Sisson, W. L., Randall, T. R., Corbin, R. A., Kenner, J. C., Dunaway, D. W., Pitman, R. M., Bockelman, H. E., Gaines, C., Long, D. L., McVey, D. V., Cambron, S. E., and Whitcher, L. 2005. Registration of 'McCormick' wheat. Crop Sci. 45:416-417. 8 Griffey, C. A., Rohrer, W. L., Pridgen, T. H., Brooks, W. S., Chen, J., Wilson, J. A.,
16
Bockelman, H. E., Gaines, C., Long, D. L., McVey, D. V., Cambron, S. E., and Whitcher, L. 2005. Registration of 'Tribute' wheat. Crop Sci. 45:419-420. 9 Heun, M. 1987. Virulence frequencies influenced by host resistance in the
host-pathogen system wheat-powdery mildew. J. Phytopathol. 118:363-366.
10 Hsam, S. L. K., and Zeller, F. J. 1997. Evidence of allelism between genes Pm8 and
Pm17 and chromosomal location of powdery mildew and leaf rust resistance genes in the common wheat cultivar 'Amigo.' Plant Breed. 116:119-122.
11 Hsam, S. L. K., and Zeller, F. J. 2002. Breeding for powdery mildew resistance in common wheat (Triticum aestivum L.). Pages 219-238 in: The Powdery Mildews: A Comprehensive Treatise. R. R. Belanger, W. R. Bushnell, A. J. Dik and T. L. W. Carver, eds. APS Press, St. Paul, MN.
12 Jensen, J., Jensen, H. P., and Jorgensen, J. H. 1995. Linkage studies of barley powdery mildew virulence loci. Hereditas 122:197-209.
13 Jevtic, R., Pribakovic, M., Stojanovic, S., and Leath, S. 1991. Screening the virulence of Erysiphe graminis DC. Ex Merat f. sp. tritici Em. Marchal in mobile nurseries. Plant Prot. 42:21-31.
14 Jia, J., Devos, K. M., Chao, S., Miller, T. E., Reader, S. M., and Gale, M. D. 1996. RFLP-based maps of the homoeologous group-6 chromosomes of wheat and their application in the tagging of Pm12, a powdery mildew resistance gene transferred from Aegilops speltoides to wheat. Theor. Appl. Genet. 92:559-565.
17 Appl. Biol. 65:263-268.
16 Leath, S. 1991. Wheat powdery mildew in the USA: Status of pathogen virulence and host resistance. Pages 22-32 in: Integrated Control of Cereal Mildews:
Virulence Patterns and Their Change. J. H. Jorgensen, eds. Riso National Laboratory, Roskilde, Denmark.
17 Leath, S., and Bowen, K. L. 1989. Effects of powdery mildew, triadimenol seed treatment, and triadimefon foliar sprays on yield of winter wheat in North Carolina. Phytopathol. 79:152.
18 Leath, S., and Heun, M. 1990. Identification of powdery mildew resistance genes in cultivars of soft red winter wheat. Plant Dis. 74:747-752.
19 Leath, S., and Murphy, J. P. 1985. Virulence genes of the wheat powdery mildew fungus, Erysiphe graminis f. sp tritici in North Carolina. Plant Dis. 69:905. 20 LeBoulch, V., Goyeau, H., Brabant, P., and deVallavieille-Pope, C. 1995.
Identification of specific powdery-mildew-resistance genes in individual wheat plants using the first two seedling leaves. Plant Breed. 114:281-286.
21 Limpert, E., Felsenstein, F. G., and Andrivon, D. 1987. Analysis of virulence in populations of wheat powdery mildew in Europe. J. Phytopathol. 120:1-8. 22 Lipps, P. E., and Madden, L. V. 1989. Assessment of methods of determining
powdery mildew severity in relation to grain yield of winter wheat cultivars in Ohio. Phytopathol. 79:462-470.
18
Proceedings of the 10th International Wheat Genetics Symposium.
24 Murphy, J. P., Navarro, R. A., Leath, S., Bowman, D. T., Weisz, P. R., Ambrose, L. G., Pate, M. H., and Fountain, M. O. 2004. Registration of 'NC-Neuse' wheat. Crop Sci. 44:1479-1480.
25 Namuco, L. O., Coffman, W. R., Bergstrom, G. C., and Sorrells, M. E. 1987. Virulence spectrum of the Erysiphe graminis f. sp. tritici population in New York. Plant Dis. 71:539-541.
26 Nei, M. 1972. Genetic distance between populations. Am. Nat. 106:283-292. 27 Niewoehner, A. S., and Leath, S. 1998. Virulence of Blumeria graminis f. sp. tritici
on winter wheat in the eastern United States. Plant Dis. 82:64-68.
28 Persaud, R. R., and Lipps, P. E. 1995. Virulence genes and virulence gene frequencies of Blumeria graminis f. sp. tritici in Ohio. Plant Dis. 79:494-499. 29 Price, E. W., and Carbone, I. 2004. SNAP: workbench management tool for
evolutionary population genetic analysis. Bioinformatics 21:402-404.
30 Royer, M. H., Nelson, R. R., and MacKenzie, D. R. 1984. An evaluation of the independence of certain virulence genes of Erysiphe graminis f. sp. tritici. Phytopathol. 74:1007-1010.
31 Shi, A. N., Leath, S., and Murphy, J. P. 1998. A major gene for powdery mildew resistance transferred to common wheat from wild einkorn wheat. Phytopathol. 88:144-147.
19 Vet.- og Landbohojsk. Aarsskr. 77:1-28.
33 Svec, M., and Miklovicova, M. 1998. Structure of populations of wheat powdery mildew (Erysiphe graminis DC f. sp. tritici Marchal) in Central Europe in 1993-1996: I. Dynamics of virulence. Eur. J. Plant. Pathol. 104:537-544.
34 Turner, D. M. 1956. Studies on cereal mildew in Britian. Trans. Brit. Mycol. Soc. 39:495-506.
35 Tursumbaev, A. 1974. Some biological characteristics of the causal agent of wheat powdery mildew. Vestn. Skh. Nauki. Kaz. 17:29-33.
20
Table 1.1 Origin of wheat powdery mildew isolates recovered in 2003 and 2005 from leaves collected in the field
Year State Location Wheat cultivar or breeding line
Number of isolates recovered
Field replicates (sampled separately)
2003 NC Kinston Coker 9663 29 3
2003 NC Salisbury Coker 9663 30 3
2003 GA Griffin Coker 9663 17 2
2003 VA Warsaw Coker 9663 20 2
2003 KY Princeton Jagalene 4 1
2005 NC Kinston Roane 29 3
2005 NC Chocowinity Roane 10 1
2005 VA Warsaw unknown 9 1
2005 VA Painter unknown 19 2
2005 DE Felton Roane 10 1
2005 GA Plains P26R61 20 2
21
Accession numberb / Cultivar name
Pm
gene Pedigree
CI12333 - Chancellor
none Dietz/Carina//Carina/Mediterranean/3/Kanred"S"/Purplestraw
CI14114 1a Axminster/8*Chancellor
CI14118 2 Ulka/8*Chancellor
CI14120 3a Asosan/8*Chancellor
CI14121 3b Chul/8*Chancellor
CI14122 3c Sonora/8*Chancellor
CI15888 3f Michigan Amber/8*Chancellor
CI14123 4a Khapli/8*Chancellor
NICc - Ronos 4b Graf/Kormoran//Krojuwel
CI14125 5a Hope/8*Chancellor
NIC 7 Transec/8*Chancellor
PI361879 - Kavkaz 8 Lutescens 314H147/Bezostaja 1 (=Bezostaja II) (=PI367723) PI520591 - Wembley 12 Hobbit/Sona 227//Sicco
NIC - Pm16 16 Norman/ T. dicoccoides line
PI578213 - Amigo 17 Teewon"S"/6/Gaucho/4/Tascosa/3/Wichita/Teewon/5/2*Teewon CI17452 - TAM-W-104 20 Male sterile Sturdy/PI252003
PI599035 - NC96BGTA5 25 Saluda/PI427662//Saluda/3/Saluda (=NC94-3778) aPm12 and Pm20 only used with 2005 isolates.
cNIC = Not in Collection.
Table 1.2 Pedigree of powdery mildew (Pm) differential wheat lines used in virulence screening of wheat powdery mildew isolates from 2003 and 2005a.
b
22
Table 1.3 Proportion of isolates virulent to wheat powdery mildew (Pm) resistance genes collected from three states in 2003a
North Carolina Griffin, Warsaw, Fisher's
Kinston Salisbury GA VA exact test
n=29 n=30 n=17 n=20 P-valueb
Pm1a 0.00 0.00 0.00 0.05 0.208
Pm2 0.45 0.80 0.47 0.50 0.000
Pm3a 1.00 1.00 1.00 1.00 -
Pm3b 0.55 0.40 0.76 0.35 0.000
Pm3c 1.00 1.00 1.00 1.00 -
Pm3f 0.97 1.00 1.00 1.00 0.302
Pm4a 0.79 1.00 0.82 0.80 0.000
Pm4b 0.41 0.73 0.00 0.45 0.000
Pm5a 1.00 1.00 1.00 1.00 -
Pm7 1.00 1.00 1.00 1.00 -
Pm8 0.10 0.00 0.00 0.25 0.000
Pm16 0.00 0.00 0.00 0.05 0.208
Pm17 0.14 0.10 0.00 0.00 0.008
Pm25 0.10 0.00 0.12 0.20 0.002
a“n” = number of single-ascospored isolates tested from that site. b
23
Felton, Plains, Headland,
Kinston Chocowinity DE Painter Warsaw GA AL
n=29 n=10 n=10 n=19 n=9 n=19 n=10
Pm1a 0.00 0.00 0.00 0.00 0.00 0.00 0.00
-Pm2 0.55 0.60 0.50 0.74 0.56 0.63 0.30 0.000
Pm3a 1.00 1.00 1.00 1.00 1.00 1.00 1.00
-Pm3b 0.62 0.30 0.70 0.89 0.78 0.42 1.00 0.000
Pm3c 1.00 1.00 1.00 1.00 1.00 1.00 1.00
-Pm3f 1.00 1.00 1.00 1.00 1.00 1.00 1.00
-Pm4a 1.00 1.00 1.00 0.89 1.00 0.53 0.50 0.000
Pm4b 1.00 1.00 1.00 0.84 0.33 0.00 0.00 0.000
Pm5a 1.00 1.00 1.00 1.00 1.00 1.00 1.00
-Pm7 1.00 1.00 1.00 0.95 0.89 1.00 1.00 0.015
Pm8 0.10 0.20 0.00 0.05 0.22 0.89 0.00 0.000
Pm12 0.10 0.30 0.00 0.32 0.56 1.00 0.00 0.000
Pm16 0.00 0.00 0.00 0.00 0.00 0.00 0.00
-Pm17 0.03 0.00 0.00 0.05 0.00 0.63 0.80 0.000
Pm20 0.66 1.00 0.90 0.84 0.56 0.95 0.70 0.000
Pm25 0.07 0.00 0.00 0.16 0.22 0.42 0.00 0.000
a
"n" = number of single-ascospore isolates tested from that site
Table 1.4 Proportion of isolates virulent to wheat powdery mildew (Pm) resistance genes collected form
five states in 2005a
North Carolina Virginia Fisher's
exact test P-value
b
24
Table 1.5 Most frequent multilocus virulence haplotypes of wheat powdery mildewisolates collected fromfour states in2003a
Number of isolates
Effective / ineffective resistance genes Frequency (%) 12 1a,3b,8,16,17,25 / 2,3a,3c,3f,4a,4b,5a,7 12.5 12 1a,2,4b,8,16,17,25 / 3a,3b,3c,3f,4a,5a,7 12.5 10 1a,8,16,17,25 / 2,3a,3b,3c,3f,4a,4b,5a,7 10.4 8 1a,4b,8,16,17,26 / 2,3a,3b,3c,3f,4a,5a,7 8.3 8 1a,3b,4b,8,16,17,25 / 2,3a,3c,3f,4a,5a,7 8.3 6 1a,2,3b,8,16,17,25 / 3a,3c,3f,4a,4b,5a,7 6.3 5 1a,2,8,16,17,25 / 3a,3b,3c,3f,4a,4b,5a,7 5.2
5 1a,2,3b,4a,4b,8,16,17,25 / 3a,3c,3f,5a,7 5.2
3 1a,2,8,16,25 / 3a,3b,3c,3f,4a,4b,5a,7,17 3.1 3 1a,2,3b,4b,8,16,17,25 / 3a,3c,3f,4a,5a,7 3.1 3 1a,3b,8,16,25 / 2,3a,3c,3f,4a,4b,5a,7,17 3.1 2 1a,2,4a,4b,8,16,17,25 / 3a,3b,3c,3f,5a,7 2.1 2 1a,4a,4b,8,16,17,25 / 2,3a,3b,3c,3f,5a,7 2.1 2 1a,3b,4b,8,16,17 / 2,3a,3c,3f,4a,5a,7,25 2.1 2 1a,3b,4b,16,17,25 / 2,3a,3c,3f,4a,5a,7,8 2.1 a
25
Table 1.6 Most frequent multilocus virulence genotypes of wheat powdery mildew isolates collected from five states in 2005a
Number of isolates
Effective / ineffective resistance genes Frequency (%) 19 1a,8,12,16,17,25 / 2,3a,3b,3c,3f,4a,4b,5a,7,20 19.8 8 1a,2,8,12,16,17,25 / 3a,3b,3c,3f,4a,4b,5a,7,20 8.3 7 1a,2,3b,8,12,16,17,25 / 3a,3c,3f,4a,4b,5a,7,20 7.3 7 1a,3b,8,12,16,17,25 / 2,3a,3c,3f,4a,4b,5a,7,20 7.3 6 1a,8,12,16,17,20,25 / 2,3a,3b,3c,3f,4a,4b,5a,7 6.3 3 1a,2,4b,8,12,16,25 / 3a,3b,3c,3f,4a,5a,7,17,20 3.1 3 1a,2,8,12,16,17,20,25 / 3a,3b,3c,3f,4a,4b,5a,7 3.1 3 1a,4b,16 / 2,3a,3b,3c,3f,4a,5a,7,8,12,17,20,25 3.1 2 1a,2,3b,8,16,17,25 / 3a,3c,3f,4a,4b,5a,7,12,20 2.1
2 1a,2,3b,8,12,16,17,20,25 / 3a,3c,3f,4a,4b,5a,7 2.1
2 1a,2,4b,8,12,16,20,25 / 3a,3b,3c,3f,4a,5a,7,17 2.1 2 1a,3b,4a,4b,16,25 / 2,3a,3c,3f,5a,7,8,12,17,20 2.1 2 1a,3b,16,17,25 / 2,3a,3c,3f,4a,4b,5a,7,8,12,20 2.1 2 1a,4a,4b,16,17,25 / 2,3a,3b,3c,3f,5a,7,8,12,20 2.1 a
26
Table 1.7 Most frequent multilocus virulence haplotypes of wheat powdery mildew from sixstates in 2003 and 2005
Number of isolates in
2003
Number of isolates in
2005
Effective / ineffective resistance genes Frequency (%) 10 25 1a,8,16,17,25 / 2,3a,3b,3c,3f,4a,4b,5a,7 18.2
5 11 1a,2,8,16,17,25 / 3a,3b,3c,3f,4a,4b,5a,7 15.7
12 7 1a,3b,8,16,17,25 / 2,3a,3c,3f,4a,4b,5a,7 9.9
27
Table 1.8 P-values from pairwise location comparisons by Fisher‟s exact test of virulence frequencies of wheat powdery mildew isolates collected in 2003a
Kinston/ Kinston/ Kinston/ Griffin/ Griffin/ Salisbury/ Salisbury Griffin Warsaw Salisbury Warsaw Warsaw
Pm1a - - 0.408 - 0.541 0.400
Pm2 0.005 0.238 0.215 0.019 0.254 0.022
Pm3a - - - -
Pm3b 0.106 0.092 0.090 0.014 0.012 0.221
Pm3c - - - -
Pm3f 0.492 0.630 0.592 - - -
Pm4a 0.011 0.293 0.280 0.042 0.320 0.021
Pm4b 0.010 0.001 0.223 0.000 0.001 0.032
Pm5a - - - -
Pm7 - - - -
Pm8 0.112 0.241 0.126 - 0.036 0.007
Pm16 - - 0.408 - 0.541 0.400
Pm17 0.283 0.146 0.112 0.250 - 0.207
Pm25 0.112 0.363 0.206 0.126 0.283 0.021
a
28
Kinston/ Kinston/ Kinston Kinston/ Chocowinity/ Chocowinity/ Chocowinity/ Delaware/ Delaware/ Painter/ Delaware Chocowinity Painter Warsaw Painter Warsaw Delaware Warsaw Painter Warsaw
Pm1a - - -
-Pm2 0.274 0.279 0.108 0.297 0.244 0.350 0.315 0.344 0.146 0.212
Pm3a - - -
-Pm3b 0.275 0.067 0.031 0.230 0.002 0.047 0.078 0.372 0.173 0.301
Pm3c - - -
-Pm3f - - -
-Pm4a - - 0.152 - 0.421 - - - 0.421 0.452
Pm4b - - 0.056 0.000 0.265 0.003 - 0.003 0.265 0.008
Pm5a - - -
-Pm7 - - 0.396 0.237 0.655 0.474 - 0.474 - 0.226
Pm8 0.111 0.286 0.058 0.056 0.110 0.195 0.132 0.108 0.306 0.097
Pm12 0.400 0.134 0.059 0.009 0.325 0.200 0.105 0.011 0.057 0.159
Pm16 - - -
-Pm17 0.744 0.744 0.191 0.763 0.421 - - - 0.421 0.452
Pm20 0.120 0.032 0.101 0.261 0.265 0.033 0.500 0.108 0.408 0.103
Pm25 0.548 0.548 0.031 0.198 0.098 0.211 - 0.211 0.098 0.168 Table 1.9 P-values from pairwise location comparisons by Fisher's exact tests of virulence frequencies of wheat powdery mildew isolates collected in 2005a
P-values from pairwise site comparisons
a
29
Kinston/ Chocowinity/ Delaware/ Painter/ Warsaw/ Georgia/ Kinston/ Chocowinity/ Delaware/ Painter/ Warsaw/ Alabama Alabama Alabama Alabama Alabama Alabama Georgia Georgia Georgia Georgia Georgia
Pm1a - - -
-Pm2 0.118 0.150 0.240 0.027 0.200 0.078 0.204 0.306 0.245 0.216 0.296
Pm3a - - -
-Pm3b 0.021 0.002 0.105 0.421 0.211 0.002 0.096 0.262 0.117 0.002 0.073
Pm3c - - -
-Pm3f - - -
-Pm4a 0.000 0.016 0.016 0.028 0.022 0.300 0.000 0.009 0.009 0.013 0.013
Pm4b 0.000 0.000 0.000 0.000 0.033 0.655 0.000 0.000 0.000 0.000 0.010
Pm5a - - -
-Pm7 - - - - 0.474 - - - 0.321
Pm8 0.400 0.238 0.500 0.265 0.087 0.000 0.000 0.000 0.000 0.000 0.001
Pm12 0.400 0.105 - 0.057 0.011 0.000 0.000 0.000 0.000 0.000 0.006
Pm16 - - -
-Pm17 0.000 0.000 0.000 0.000 0.001 0.226 0.000 0.001 0.001 0.000 0.002
Pm20 0.296 0.105 0.248 0.245 0.300 0.096 0.017 0.655 0.468 0.249 0.024
Pm25 0.548 - - 0.098 0.211 0.018 0.007 0.018 0.018 0.021 0.207
Table 1.9 continued
a
P-values < 0.05 indicate significant differences in virulence proportions among or between sites. Missing values indicate populations with identical virulence proportions where no test was possible.
30
Table 1.10 Linkage between pairs of wheat powdery mildew virulence/avirulence loci in clone-corrected sample of 2003 and 2005 isolates from 10 southeastern U.S. locations
Pm gene pair
Pathogen alleles
A Aa Pathogen alleles A V Pathogen alleles V A Pathogen alleles V V
Sum Association typeb
Fisher‟s exact test
P-value
3b 8 44 19 62 10 135 - 0.012
3b 12 14 16 29 11 70 - 0.019
3b 20 4 26 14 26 70 +/- 0.027
4a 4b 26 0 42 67 135 + <0.001
4a 12 5 9 38 18 70 - 0.023
4b 8 47 21 59 8 135 - 0.005
4b 12 8 20 35 7 70 - <0.001
8 12 42 7 1 20 70 + <0.001
8 17 95 11 17 12 135 + <0.001
8 20 16 33 2 19 70 +/- 0.303
8 25 96 10 19 10 135 + 0.002
17 12 37 16 6 11 70 + 0.010
17 25 100 12 15 8 135 + 0.006
25 12 42 17 1 10 70 + <0.001
a
Number of isolates virulent (V) / avirulent (A) at respective Pm loci; e.g., “44” in first cell signifies 44 isolates avirulent to Pm3b andavirulent to Pm8.
31
32
Fig. 1.2 Complexity (number of virulence genes detected) in wheat powdery mildew isolates sampled in 2003 (n=100, 14 Pm genes screened) and 2005 (n=106, 16 Pm genes screened) from 10 locations in the southeastern U.S.
0 5 10 15 20 25 30 35 40 45 50
5 6 7 8 9 10 11 12 13
Number of Virulence Genes
2003
2005
N
u
m
b
e
r
o
f
Is
o
la
te
33 0% 10% 20% 30% 40% 50% 60% 70% 80% 90% 100% Grif fin (1
7)
Sal isbur
y (3 0) Kin ston (29, 29) War saw (20, 9) Felto n (1
0) Pai nter (19) Cho cow inity (10) Hea dlan
d (1 0) Pla ins (19) Locations C lo n e -c o rr e c te d i s o la te s a s a p e rc e n ta g e o f to ta l is o la te s 2003 2005
34
35
36
Fig. 1.6 Pairwise plot of geographic distance vs. Nei‟s genetic distance for 206 wheat powdery mildew isolates sampled from 10 locations in the southeastern U.S. in 2003 and 2005.
y = 0.0001x + 0.0123 R2 = 0.400
0.0 0.1 0.2 0.3
0.0 500.0 1000.0 1500.0
G
e
n
e
ti
c
d
is
ta
n
c
e
(
G
s
t)
Geographic distance (km)
P ≤ 0.001
37
CHAPTER 2 – SINGLE NUCLEOTIDE POLYMORPHISM
ANALYSIS OF EASTERN U.S. WHEAT POWDERY MILDEW
POPULATION STRUCTURE
INTRODUCTION
Native to the Middle East, wheat is among the world’s oldest cultivated plants and was widely spread by humans (61). Wheat was first grown in the United States in 1602 off the southern coast of Massachusetts (17) and was first cultivated in Virginia in 1611 (15). Around the same time, Spanish settlers introduced wheat to Mexico (15).
The biotrophic filamentous ascomycete Blumeria graminis (DC.) E. O. Speer f. sp.
tritici (Em. Marchal) causes powdery mildew of wheat
(23,24,29,38,40-42,53,55,64,65,68,69,71,77-80). Due to the specialized nature of the host-pathogen relationship, mildews parasitic to one host species generally cannot grow on another
(35,48,49,57,63,80) and B.graminis is divided into eight formae specialis (32). Given what is known about the arrival of wheat in North America, it is likely that wheat powdery mildew was first introduced to the continent less than 500 years ago. At least in recent history, the U.S. region most consistently favorable for wheat powdery mildew development
38 within the population, remain largely unstudied.
Previous studies of wheat powdery mildew population structure have been virulence surveys (34,40,42,45,52-55,68,71,77,79). Due to the effects of host selection on virulence and to geographic variability in deployment of host resistance genes, powdery mildew virulence gene frequencies are of limited use in inferences about population structure on a continental scale, and offer no insights into historical structuring processes such as gene flow, range expansion, or fragmentation.
In population analysis, electrophoretically derived markers such as AFLPs (80) are useful for identification of strains or races, but these markers are limited because bands present in two isolates may not derive from a common ancestor (46). Single-nucleotide polymorphisms (SNPs) in DNA sequences can be utilized in powerful mathematical models to draw statistical inferences about historical processes structuring modern populations (37,58,74). These data also allow for a phylogeographic, or tree-based, approach to investigating population structure (4,5,8,75,76). Using a combination of methods, more accurate inferences can be made concerning contemporary and historical processes structuring the wheat powdery mildew population (2,9).
39
transmitted novel barley powdery mildew virulences from continental Europe to Britain (10). Transport of viable cereal mildew spores across the North Sea from Britain to Denmark, a distance of approximately 800 km, has been demonstrated (28). However, gene flow due to LDD does not preclude the possibility of regional differentiation. Large-scale spore dispersal with unknown rates of gene flow suggests a need for sampling wheat mildew at varying geographic scales (3,20,71). Previous studies based on virulence frequencies indicated regional clustering of virulence phenotypes (40,54), but such clustering may result from regional differences in wheat cultivars grown and not from actual restricted gene flow.
In order to investigate the eastern United States B. g. tritici population structure, we undertook two types of analysis: a survey of frequencies of virulence to commonly deployed wheat powdery mildew resistance (Pm) genes (in press), and analysis of selectively neutral pathogen DNA sequences within a phylogenetic and coalescent framework. To carry out both studies, a collection of 206 single-ascospore derived isolates from the 2003 and 2005 wheat growing seasons was derived from samples collected in 10 different locations. Collecting both data types from the same samples allowed a comparisons of inferences from neutral DNA sequences and virulence frequencies. In spite of the difficulty inherent in working with protein coding regions in biotrophs (32), SNPs in presumably conserved B. g. tritici “housekeeping” genes were utilized because of the enhanced phylogenetic resolution
40 MATERIALS AND METHODS
Population Sampling. Wheat leaves bearing mildew cleistothecia were sampled from highly susceptible cultivars in several eastern U.S. areas of powdery mildew importance (Fig. 2.1). Single-ascospore isolates were derived on detached leaves floating on
benzimidazole agar as previously described (54).
DNA Extraction. Conidia were collected by dipping five to ten detached leaves with large colonies of mildew into a microfuge tube with 1.5 mL of 95% ethanol to disrupt
hydrophobic interactions and allow conidia to enter solution. Micro-centrifuge tubes were centrifuged for ~20 seconds at maximum speed and the ethanol was decanted, leaving a pellet of conidia which was air-dried and then frozen at -80oC until DNA extraction.
DNA was extracted using a Qiagen DNeasy Blood and Tissue kit and followed the spin column protocol for animal tissue with slight modifications. Modifications included adding ~25mg of sand to the micro-centrifuge tubes and grinding at high speeds (~12,000 rpm) for approximately 30 seconds in the presence of liquid nitrogen with a pellet pestle inserted into an electric drill. Once conidia were sufficiently ground, the Qiagen protocol was begun at step 1 with the addition of buffer ATL. After the addition of proteinase K, samples were incubated at 65oC for 20 minutes. Prior to addition of cell lysate to columns, 30µl of 3M sodium acetate pH 5 was added to ensure sample binding. DNA yields ranged from 1,000-10,000 ng.
41
B. g. hordei accessions coding for housekeeping genes. Protein coding genes were chosen because of the greater rate of evolution when compared to rDNA (32). Available sequences were input into Primer3 (60) for primer design. When coding regions were known, Primer3 was instructed to select regions spanning at least one intron in order to increase the likelihood of detecting polymorphisms (12).
PCR was carried out in 20μl volumes, and all primers amplified under identical cycling conditions and reagent concentrations, except the primers for protein phosphatase type 2A (PPA) which ran at an annealing temperature of 61oC. Each reaction contained 2μl Bioline 10X Buffer (160 mM (NH4)2SO4, 670 mM Tris-HCl, 0.1% Tween-20), 3.0 mM MgCl2, 0.3125mM dNTPs, 0.8μM each primer, 1.5 units Bioline Taq polymerase, and ~20 ng genomic DNA. Cycling conditions were was follows: one cycle of 96oC for 5 minutes, then 34 cycles of 96oC for 25s, 55oC for 25s and 72oC for 45s, followed by a final extension step of 72oC for 5 minutes. Prior to sequencing, unincorporated dNTPs, salts, and primers were removed using either the QIAquick PCR purification kit (Qiagen, Valencia, CA) or the QuickStep 2 96-well PCR purification kit (Edge BioSystems, Gaithersburg, MD).
Sequencing was carried out at the Iowa State University DNA Facility. In total, 12 protein-coding regions were amplified and sequenced (Table 2.1). Sequence alignment and manual editing of base calls were carried out with Sequencher 4.7 (Gene Codes Corporation, Ann Arbor, MI).
42
SNAP Workbench 2.0, an application combining multiple evolutionary analysis methods under a single interface (56). Within the Workbench, analysis followed the flowchart
outlined by Carbone et al (13). Sequences were collapsed into haplotypes using SNAP MAP (6). Recombination analysis within the Workbench was carried out for each locus by
RecMin (51) and beagle (47). Both methods assume a contiguous linked DNA strand for analysis. Our data combined multiple sequences into a single sequence, violating this
assumption. To ensure correct inferences, each locus was tested separately. Relative ages of mutations were determined on each locus using Genetree version 9.01 (7,25) as implemented in SNAP Workbench.
Tests for neutrality are tests of whether the observed genetic variation is consistent with the hypothesis that the majority of polymorphisms contributing to a population’s genetic variability are selectively neutral (36). Tajima’s D (73), Fu and Li’s D, F, Ds, and Fs (22), and Fu’s Fs (21) neutrality statistics were computed using NeutralityTest (44). Neutrality statistics were tested for an excess of recent mutations or rare alleles (left-side test) and excess of ancient mutations (right-side test). Tests for linkage disequilibrium (LD) detect the non-random association of alleles at different loci (43,66). LD tests were carried out using MultiLocus (1), with each set of polymorphic sites sampled from a single contiguous DNA sequence (one gene) considered as linkage groups.
43
estimates the number of genotypes in a population, and evenness, which measures the
distribution of genotypes. Most diversity estimates combine richness and evenness, which is appropriate as long as sample sizes are similar. To correct for unequal sample sizes,
rarefaction curves have been employed to estimate the number of genotypes that would be sampled in a population of n samples (26,27,39). Tests of richness estimated by rarefaction curves were performed using rarefac.C (27). For a given population, rarefac.C estimates the expected number of sampled genotypes for samples of size 1 to n. This estimator is E(gn) and the curve obtained from the population with the largest size can be used to predict the number of genotypes expected to be found in a smaller sample (62). The slope of the rarefaction curve can be used to explain the rate of genotype accumulation, with steeper slopes indicating greater richness (33).
Tests for population subdivision were applied hierarchically using Snn, a
permutation-based nearest-neighbor statistic (31). First, sequences from all 10 sampling locations were tested in pairwise comparisons. Each pair of two locations with no significant sequence differences between them was collapsed into a single population for subsequent tests, and then another round of pairwise comparisons was conducted. This process continued until only significantly different population groups remained.
44
single field was one population. AMOVA requires a priori hypotheses about population structure that can be tested by aggregating multiple populations into groups. Results included variance components of each source of variation (among groups, within
populations, and among populations within groups), percentage of total variation explained by each variance source, and Φ-statistics with associated P-values. Φ-statistics are haplotype correlation coefficients with ΦCT representing correlation within predefined groups relative to other groups, ΦST representing correlation within populations across all sampled
populations, and ΦSC representing correlations of populations within each predefined group (19). All Φ-statistics are analogous to Wright-Fisher’s Fst (19). The final population divisions found with Snn were input as groups in Arlequin and tested via AMOVA to confirm. P-values computed for Φ-SC, Φ-ST, Φ-CT were based on 1,023 permutations of the null distribution for each variance component and indicate the probability of obtaining a more extreme result than the observed value.
RESULTS
45
known coding regions, all polymorphisms were present within the coding regions except positions one and two in PPA.
Amplification and sequencing of all four polymorphic regions of interest was successful with 141 of the 206 available B. g. tritici isolates. In total, there were 15 unique DNA sequence haplotypes (Table 2.2). Out of the 141 total isolates sequenced, 60 isolates were of haplotype 1 (H1) and 40 were of H12, leaving 41 isolates of the remaining 13 haplotypes. No insertions or deletions were detected, and all data were consistent with an infinite sites model, where each variable position has only a single mutation. All right-side neutrality tests were non-significant and only Fu’s Fs left-side test was significant (Fs = -8.273, P = 0.004) indicating an excess of recent mutation or rare alleles. Tests for LD in MultiLocus were all non-significant. Relative ages of mutations for each site as calculated in Genetree matched expectations, with frequent mutations rooting deeper in the genealogy and low-frequency mutations at tips. Estimates of diversity indices are in Table 2.2. Rarefaction curves estimating haplotype richness at each geographic area with sufficient sampling (3 sites from N, 4 sites from S) appear in Fig. 2.2.
The overall test with Snn (31) divided the population into five groups. Kinston, Warsaw, Felton, Salisbury, and Chocowinity formed a single undifferentiated group (group 1). Plains and Headland formed group 2; Painter and Griffin were groups 3 and 4,
respectively; and the three isolates from Princeton provided too little information to be
46
Painter was not significantly different from group 1 and Griffin was not significantly different from group 2. Princeton was significantly different from group 2, but was not different from any other group or location. The result was a putative population structure of three groups designated North (N), South (S), and Princeton (KY).
When the three groups defined by Snn were subjected to AMOVA in Arlequin, the largest percentage of population variance (76.7%) was within populations. Only 3.2% of total variance was among populations within groups, leaving 20.1% of variance among groups. All P-values were significant (Table 2.3).
Alternative parsimony heuristic search via PAUP* (72) with 1,000 replications resulted in 1,717 equally parsimonious trees. The strict consensus of the trees clustered haplotypes 6, 13, and 14 into a monophyletic clade; all other haplotypes had no discernible structure. Maximum likelihood heuristic search within PAUP* inferred two phylogenetic trees differing only in the placement of H7 (Fig. 2.3) and improved upon the population resolution inferred with parsimony. H6, H13, and H14 were also monophyletic with maximum likelihood. Recombination analysis by RecMin and beagle found no recombination events in the history of the sampled data.
DISCUSSION
47
recent (67), consistent with the hypothesis of a young population. These results are also consistent with a recent population bottleneck and subsequent range and population size expansion (2), as would be expected following introduction by European colonists.
Historical records indicate that wheat was introduced into the U. S. at least twice (15,17). Due to the ephemeral nature of mildew conidia (14,16), it does not seem likely that conidia were the means of introduction. Rather, the transatlantic crossing was likely made by cleistothecia embedded in wheat straw that was used as animal bedding or for some other purpose. Unfortunately, this survey did not include the region around Texas, which might increase power to infer multiple introductions. Also, there may have been more
introductions of wheat mildew following the initial ones, further confounding the analysis. However, the overall detected trend of north-south population subdivision with a zone of demarcation approximately at North Carolina, supported by both AMOVA and Hudson’s Snn results, could reflect roughly contemporaneous initial introductions in Texas and Virginia, and subsequent population expansions into common regions. Alternatively, the north-south differences we detected might be the result of isolation by distance (50) from the Virginia source alone.
48
haplotypes. If there are actual barriers to gene flow, over time the percentage of total variance among groups would increase, while the within-population variance would decrease.
Further support for recent population introduction is the significant result for Fu’s Fs left side test. Fu’s Fs provides a test based on the model of no population growth; significant deviations from the model indicate an expanding population. These results must be
considered carefully because the validity of Fu’s Fs has not been tested in the presence of recombination (21) and powdery mildew regularly undergoes sexual reproduction.
The rarefaction results are interesting in light of what is known about European colonization of North America. The three northernmost locations in our sampling area (Warsaw, Painter, and Felton) all have similar, steeper rarefaction slopes, indicating similar levels of haplotype richness, while every location south of Virginia has a shallower slope and therefore less richness (Fig. 2.3). Lower haplotype diversity in the southernmost sampling locations (Headland, Plains, and Griffin) is logical given the infrequence of mildew
49
range expansion. Below, we discuss efforts to expand our knowledge of continental B. g tritici population history and its Old World antecedents.
It is believed that each year the main source of primary inoculum for wheat mildew epidemics is of ascospores, but the relative contributions of sexual and asexual reproduction to the structure of the eastern U.S. wheat mildew population have not been previously investigated. Most recombination events are undetectable because they occur between non-polymorphic sites; therefore, it is common to calculate the minimum number of
recombination events (Rm) required to explain the sampled data and the actual number is often much higher (30). In our samples, most loci were monomorphic, so no detectable recombination is not unexpected. However, due to the sexual stage of the pathogen, many haplotypes resulted from recombination or independent assortment between the most frequent haplotypes combined with a more recent mutation to form a third haplotype, which helps explain the large number of haplotypes detected.
It would be desirable to estimate migration rates of mildew in the eastern U. S., in order to assess the risk of rapid spread of novel virulences. For example, as of this writing,
50
these resistance-breaking isolates may migrate to the N group. Nevertheless, the broad geographic distribution of our most frequent haplotypes (H1 and H12) is certainly consistent with the hypothesis of a random-mating population with gene flow throughout the sampling region. Based on research in the United Kingdom, spores of B. graminis remain viable after traveling up to 800 km in a single trip (28), so it appears that Pm17-virulent spores could rapidly move north if wind patterns were ideal and conditions were favorable for spore survival. Given the low levels of variation detected in B. g. tritici genomic regions, the only way to directly estimate migration rates and directions is to sample more loci, preferably those with higher mutation rates such as microsatellites.
51 LITERATURE CITED
1 Agapow, P. M., and Burt, A. 2001. Indices of multilocus linkage disequilibrium. Mol. Ecol. Notes 1:101-102.
2 Althoff, D. M., and Pellmyr, O. 2002. Examining genetic structure in a bogus Yucca moth: A sequential approach to phylogeography. Evolution 56:1632-1643.
3 Andrivon, D., and Vallavieille-Pope, C. 1993. Racial diversity and complexity in regional populations of Erysiphe graminis f. sp. hordei in France over a 5-year period. Plant Pathology 42:443-464.
4 Avise, J. C. 2000. Phylogeography. Cambridge, Massachusetts: Harvard Univ. Press. 5 Avise, J. C., Arnold, J., Ball, R. M., Bermingham, E., Lamb, T., Neigel, J. E., Reeb,
C. A., and Saunders, N. C. 1987. Intraspecific phylogeography: The mitochondrial DNA bridge between population genetics and systematics. Annu. Rev. Ecol. Syst. 18:489-522.
6 Aylor, D. L., Price, E. W., and Carbone, I. 2006. SNAP: Combine and Map modules for multilocus population genetic analysis. Bioinformatics 22:1399-1401.
7 Bahlo, M., and Griffiths, R. C. 2000. Inference from gene trees in a subdivided population. Theor. Pop. Biol. 57:79-95.
52
9 Bernatchez, L. 2001. The evolutionary history of brown trout (Salmo trutta L.)
inferred from phylogeographic, nested clade, and mismatch analyses of mitochondrial DNA variation. Evolution 55:351.
10 Brown, J. K. M., and Hovmøller, M. S. 2002. Aerial dispersal of pathogens on the global and continental scales and its impact on plant disease. Science 297:537-541. 11 Brown, T. A., Harris, D. R., Rollo, F., and Evershed, R. P. 1999. How ancient DNA
may help in understanding the origin and spread of agriculture [and discussion]. Phil. Trans. R. Soc. Lond. 384:89-98.
12 Carbone, I., and Kohn, L. M. 1999. A method for designing primer sets for speciation studies in filamentous ascomycetes. Mycologia 91:553-556.
13 Carbone, I., Liu, Y.-C., Hillman, B. I., and Milgroom, M. G. 2004. Recombination and Migration of Cryphonectria hypovirus 1 as inferred from gene genealogies and the coalescent. Genetics 166:1611-1629.
14 Cherewick, W. J. 1944. Studies on the biology of Erysiphe graminis DC. Canadian Journal of Research 22:52-86.
15 Clarke, N. P. A history of small grain crops in Texas: Wheat, oats, barley, rye 1582-1976.
16 Corner, E. J. H. 1935. Observations on resistance to powdery mildews. New Phytologist 34:180-200.
53
18 Excoffier, L., Laval, G., and Schneider, S. 2005. Arlequin ver. 3.0: An integrated software package for population genetics data analysis. Evolutionary Bioinformatics Online 1:47-50.
19 Excoffier, L., Smouse, P. E., and Quattro, J. M. 1992. Analysis of molecular variance inferred from metric distances among DNA haplotypes: Application to human mitochondrial DNA restriction data. Genetics 131:479-491.
20 Felsenstein, F. G., Limpert, E., and Fischbeck, G. 1991. Wheat mildew populations in the FRG and neighboring regions (1986-1988) - some aspects of their change. Pages 1-7 in: Integrated control of cereal mildews: virulence patterns and their change. J. H. Jorgensen, eds. Riso National Laboratory, Roskilde, Denmark.
21 Fu, Y. X. 1997. Statistical tests of neutrality of mutations against population growth, hitchhiking and background selection. Genetics 147:915-925.
22 Fu, Y. X., and Li, W. H. 1993. Statistical tests of neutrality of mutations. Genetics 133:693-709.
23 Götz, M., and Boyle, C. 1998. Haustorial function during development of cleistothecia in Blumeria graminis f. sp. tritici. Plant Dis. 82:507-511.
24 Götz, M., Friedrich, S., and Boyle, C. 1996. Development of cleistothecia and early ascospore release of Erysiphe graminis DC. f. sp. tritici in winter wheat in relation to host age and climatic conditions. Z. Pflanzenkr. Pflanzenschutz 103:134-141.