Mutation-Selection Balance and Metabolic Control Theory
Andrew
G .
Clark
Department of Biology and Genetics Program, Pennsylvania State University, University Park, Pennsylvania 16802 Manuscript received October 26, 1990
Accepted for publication July 20, 199 1
ABSTRACT
The evolution of metabolic control is examined with models that unify approaches of classical
quantitative genetics and metabolic control theory. The quantitative traits considered are the activities of enzymes embedded within metabolic pathways. In the models, polygenic mutation alters the enzyme activities (V,,,JKm) according to prescribed distributions, and the population evolves following classical haploid viability selection. Stabilizing selection operates on global properties of the metabolic pathway, including either flux or metabolite pool concentration. Analytical results and numerical simulations demonstrate several important properties of these characters, including skewed, non-Gaussian equi- librium distributions, and an expected positive correlation between activities of enzymes flanking a
substrate pool undergoing stabilizing selection. T h e house-of-cards approximation proved to be accurate in predicting the equilibrium distribution of allelic effects for a biologically reasonable segment of the parameter space. Further experimental and theoretical work is needed before a clear assessment can be made whether the observed variance in enzyme activities is explicable by a mutation- selection balance, and this system provides an excellent opportunity for such a test.
T
HE controversy over parameterization of models that address the question of whether observed levels of additive genetic variance can be explained by mutation-selection balance lies at the heart of the dichotomy of evolution at the genotypic and pheno- typic levels (BARTON and TURELLI 1989). While quan- titative genetics provides the tools to yield useful and predictive estimates of components of phenotypic var- iance, whenever models require estimates of the num- ber of loci, or the per-locus mutation rate, it becomes very difficult to assess the validity of the models. Without a good understanding of the connection be- tween genotype and phenotype, including parameters like the number of loci, the magnitudes of their effects and ways they interact, there is little hope of being able to claim that observed phenotypic distributions are explained by a balance of evolutionary forces.T h e situation might be improved by seeking phe- notypes for which there is a well defined mechanism of expression, and for which there is a simple genetic basis. There is now a large body of theory relating the properties of individual enzymes in a metabolic path- way to global properties of the pathway (KACSER and BURNS 1973, 1979, 1981; HEINRICH and RAPOPORT
1983). For any phenotype that might be determined by such a global property (such as flux through the pathway or concentration of an intermediate metab- olite), this metabolic control theory provides just the mechanistic model needed to relate a series of traits (such as enzyme activities) that may have a simpler genetic basis than the global phenotype.
KACSER and BURNS (1981) were the first to bring
Genetics 149: 909-923 (November, 1991)
together the results of metabolic control theory with the consequences of genetic transmission of enzyme kinetic properties. They showed that under a wide range of conditions, a change in the activity of an enzyme is expected to have a much smaller effect on the flux through the pathway. This is consistent with the empirical observation that heterozygotes for null alleles are often phenotypically normal, and is a plau- sible mechanism for the dominance of wild-type over loss-of-function alleles. Several experimental systems have demonstrated a good fit of metabolic control theory to in vivo relations between enzyme activity and flux (reviewed by KACSER and BURNS 1981). Epistasis and pleiotropy, like dominance, were also shown to follow from metabolic control theory, since lesions in one part of the pathway may have manifold phenotypic effects (KEIGHTLEY and KACSER 1987).
910 A. G. Clark
Although a formal variance partitioning is impor- tant for understanding the evolutionary quantitative genetics of a metabolic pathway, one can begin to address the dynamics of evolutionary change with simple haploid models. HARTL, DYKHUIZEN and DEAN (1985) initiated this line of thinking with a verbal model of natural selection acting on metabolic flux. In nutrient-limited chemostats, the rate of growth is limited by metabolic flux, so flux and fitness can be equated in this experimental context. As mutations with ever higher flux accumulate, the population ap- proaches an asymptote, such that even large changes in the activity of an enzyme have little effect on the flux. They refer to this situation as evolution toward selective neutrality, because ultimately the variance in flux will be on the order of l/N and subsequent evolution will be primarily neutral. This is somewhat of an oversimplification, because as the flux becomes less sensitive to variation in activity of one enzyme, the summation theorem of KACSER and BURNS (which states that the control coefficients must sum to one) dictates that the other enzymes must increase in con- trol. Not all enzymes can evolve to neutrality. Despite this caveat, the connection between flux and fitness in nutrient-limited chemostats appears to be good, and in general metabolic control theory has survived experimental tests in this controlled in vivo system
(DEAN, DYKHUIZEN and HARTL 1986, 1988; DYKHU-
IZEN and HARTL 1983; DYKHUIZEN, DEAN and HARTL 1987; DEAN 1989). There is need to develop the formal theory of mutation-selection balance in this context, with mutations having directional or pleio- tropic effects on enzyme activity, and selection opti- mizing a global property of a metabolic pathway.
THE MODELS
One-enzyme mutation-selection balance: Consider
a simple linear metabolic pathway (SI
*
S2+
Ss+
. . .
S,), with genetic variation influencing the activ- ity of one of the enzymes in the pathway. Let the genetic transmission be haploid, with one locus and a continuum-of-alleles in an infinite population (CROWand KIMURA 1964). Under the assumption that all
substrates are at sufficiently low concentration that none of the enzymes is saturated, and that the initial and final metabolite concentrations are constant, the pathway will have a velocity across the ith step given by :
vi =
Vrnax,,
(Si
-
Si+l/Ki) (1)(KACSER and BURNS 1973), where Km,, is the Michaelis constant of the ith enzyme, Ki is the equilibrium constant across the step, and Vrnax,, is the maximum
velocity of the reaction catalyzed by the ith enzyme. At steady state, the rate across each of the steps is the
same, so a system of simultaneous equations of the form of ( 1 ) can be solved. T h e solution for the steady- state flux is:
S1
-
Sn/LJ =
c
( ~ m , z / v m a x , ~ ~ ~ - * ) (2)where
S1
and S , are the first and last substrates in the pathway, and are assumed to be of fixed concentra- tion, and k, = IIK,. In the case where only one enzyme exhibits variation, Equation2
can be written as:= ( 1 / E )
+
b =a aE
(3)
where E = Vmax/Km is the activity of the variable enzyme, and a and b are constants. T h e simultaneous equations ( 1 ) can also be solved for the steady state concentration of the substrate of our varying enzyme. If E, is the activity of an upstream enzyme, the solu- tion is of the form:
aE,
+
b cE,+
d ' [SI = ~In this case, the metabolite concentration goes from
b/d to a / c (where a / c
>
b / d ) as the enzyme increases in activity. If Ed is the activity of a downstream en- zyme, the solution iswhere the metabolite concentration now decreases from a/c to b (where b
<
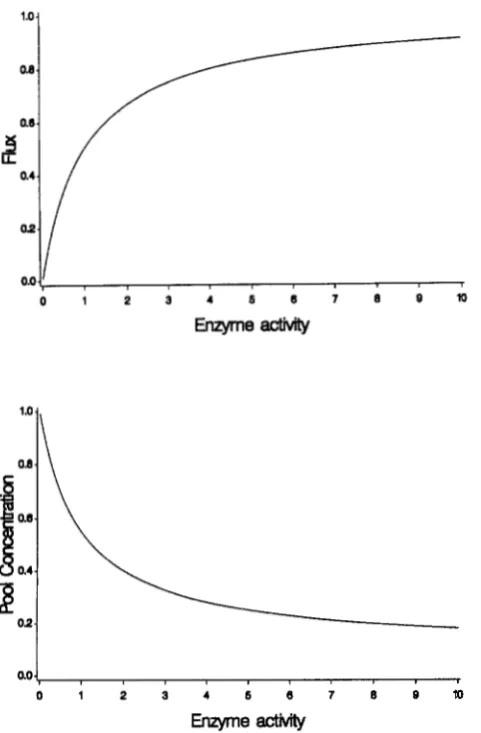
a / c ) as the enzyme activity increases from 0 to the point at which the pathway flux reaches a plateau. Figure 1 shows the form of these linear fractionals for flux and metabolite con- centration. Note that the relation between the up- stream enzyme and the following metabolite concen- tration has a similar linear fractional form as flux. We now have analytical expressions that allow derivation of phenotypic distributions of flux and of substrate pool concentration from the phenotypic distribution of enzyme activities.Natural selection will be assumed to operate on the distribution of either fluxes or substrate pool concen- trations, since these are global properties of the met- abolic pathway. T h e fitness may be an arbitrary func- tion of flux or pool concentration, and we initially assume that this function is Gaussian:
where Jopc is the optimum flux (or pool concentration,
Sopt), and us represents the strength of selection (smaller us implies that fitness falls off rapidly as J
deviates from Jopt). Equation 6 is scaled so that the
fitness of Jopt is 1.0. Figure
2
presents the GaussianEvolution of Metabolic Control
0.0
y
I0 1 2 3 4 6 6 7 8 8 1 0
Enzymeactivity
os
"I\
ao i
0 1 2 3 4 6 8 7 8 8 1 0
Enzyme activity
FIGURE 1 .-The relationship between enzyme activity and flux through a linear metabolic pathway, where each enzyme in the pathway obeys Briggs-Haldane kinetics. The relation is a linear fractional, and in this numerical example it is] = E / ( 1
+
E ) , whereJ is the flux and E is the enzyme activity. The lower panel gives the relation between the concentration of a metabolite to the down- stream enzyme. The function plotted is [SI = ( 1
+
0 . 2 E ) / ( 1+
E ) .lation between enzyme activity and fitness, which is obtained as the compound function of activity
+
flux, and flux =$ fitness. Note the distinctly skewed appear- ance of the fitness functions, and that as the fitness optimum gets closer to the plateau flux, the selection becomes more directional. As the variance in the fitness function increases, the strength of stabilizing selection decreases, resulting in progressively weaker selection against the higher activities.Analytical approximation of the moments: BAR- TON and TURELLI (1987) presented an approach to modeling the evolution of quantitative characters that is applicable to a wide variety of modes of selection. Under specified patterns of selection and mutation, the means, variances, and higher moments of the distributions of allelic effects can be approximated by matrix equations. Assume that genetic effects are completely additive on the scale of enzyme activities, and that environmental effects are genotype-inde-
0.0 02 0.4 0.8 0.8 1.0
nux
0 1 2 3 4 6 8 7 8 8 1 0
Enzymeactivity
FIGURE 2."If the relation between flux and fitness is Gaussian (top), then the relation between enzyme activity and fitness is skewed, with the degree of skew depending on the mean of the selection function. The distribution of fitnesses is Gaussian with
cr?
= 0.05, and means varying from 0.4 to 1.0. If the mean of the selection function is close to saturation, then there is effectively directional selection acting on enzyme activity. Similar results would obtain if fitness were a property of metabolite concentration.
pendent and additive. Let selection act as specified by (6), and assume that its effects are weak. Following the nomenclature of BARTON and TURELLI (1 987), let m, be the average contribution of alleles at locus i, and let mki be the kth central moment of the distribution of allelic effects at locus i. These effects are summed over loci, and we will use the terms M I , M2 and M s to
A. Clark
BARTON and TURELLI (1987) take this (which is their equation 5.3) and show that under Gaussian stabilizing selection, the third moment vanishes at equilibrium. In the present context, the phenotypic scale of the above equation is in terms of enzyme activity, and fitness is not Gaussian on this scale, but rather is skewed (see Figure 2). In the case of Gaussian stabiliz- ing selection on flux, the fitness of an individual with flux J is:
T h e character that we measure however is enzyme activity, which is related to flux by a linear fractional of the form, J = aE/(1
+
b E ) . Substitution yields an expression of fitness in terms of enzyme activity, and produces the skewed, unimodal distributions in the lower panel of Figure 2. Derivation of the recursions of the moments of the distribution of allelic effects can be done either in terms of enzyme activity, E , or in terms of flux,J. In the former case, we would have to deal with a non-Gaussian selection function, while in the latter, if the distribution of mutational effects is Gaussian in enzyme activity, then mutations affect flux in a non-Gaussian manner. By doing the analysis in terms of flux, we can follow the derivations of BARTON and TURELLI (1987) and add the skewing effects of mutations at the end. The mean fitness isw
= J p ( J ) W ( J ) d J , wherep ( J )
is the phenotypic dis- tribution of flux. Assuming an initial normal distri- butionp ( J )
with meanJand variance V , we obtain an expression for In(W) in terms ofJandJ,,, and get:d(ln w ) / a M ~ 0
-(J
-
J O p t ) / dd(1n
W ) / ~ M ,
=
-(1/2)us' (9) d(1nF ) / ~ M ,
= 0.This fully specifies the way that Gaussian stabilizing selection acting on pathway flux changes the first three moments of the distribution of pathway flux. Mutations influence flux through their effects on en- zyme activity. Let the mutation rate summed over loci be p and the variance of mutational effects on enzyme activity be uz. To obtain the recurrence equations in the moments of the distribution of allelic effects, we add the vector of the effects of mutation on the first three moments to (7). T h e distribution of mutational effects on E is assumed to be Gaussian, and since J =
aE/(l
+
b E ) , we use moment generating functions toshow that when the distribution of mutation effects is Gaussian in enzyme activities, it is a gamma distribu- tion in terms of flux J . T h e mutation vector that is added to (7) is:
Although we do not present the equilibrium solution to this set of equations, several features of the solution are evident. First, the mean of the equilibrium distri- bution can depart fromJopt, and the magnitude of the departure depends on the magnitude of the skew. Directional mutation can also force the equilibrium away fromJ,,,, but only for high mutation rates. T h e skewness of the relationship between activity and fit- ness, and the skew of the mutational distribution on flux result in an equilibrium variance that is greater than that predicted by the house-of-cards model for Gaussian effects (BARTON and TURELLI 1987). Finally, it is evident that the equilibrium distribution of allelic effects will be skewed, which results in an important non-independence when more than one character is considered.
The house-of-cards approximation and numerical simulations: Mutations enter the haploid continuum- of-alleles model at a rate p per generation, and the allelic effect of a mutation is specified by the distri- bution g(x). If the allelic effect after mutation depends on the allelic effect before mutation, then the change in the distribution of allelic effects, p ( x ) , can be ex- pressed by the "KIMURA-LANDE-FLEMING" model (TURELLI 1984):
P t + l ( X ) = (1
-
M ( X >+
rJP:(Mx
- M
(1 1) where p ' ( x ) is the density function after selection (selection occurs before mutation).p
'(x) follows clas- sical haploid selection:and
zl, = Jw(x)pt(x)dx (13)
is the mean fitness at time t. There is an extensive literature dealing with the steady state solution of (1 1) (reviewed by TURELLI 1984), and the solutions de- pend on the Gaussian approximation of
pt(x),
which is accurate for sufficiently weak selection and small mu- tational effects.If the allelic effect after mutation does not depend on the premutational state, then the "house-of-cards" approximation of KINCMAN (1 978) is appropriate. Equation 11 is replaced by:
the house-of-cards approximation was excellent when
p
<<
ai/a:, and his numerical simulations verified theaccuracy of the approximation when 20 p
<
a:/a?.Under the condition of large mutational effects, the Gaussian approximation of KIMURA (1 965), which was used to solve (1 I), leads to an overestimate of the equilibrium genetic variance.
Numerical simulations were performed for a range of parameters in order to explore the behavior of the model. T h e distribution of allelic effects was first discretized into 200 segments, representing a range of enzyme activities. Equation 14 was then approxi- mated by its discrete form and iterated numerically. T h e two functions that map enzyme activity into a global property of the metabolic pathway are given in the legend of Figure 1. All the other parameters were varied in the simulations, including the mean of the selection function (Jopc or Sop,), the variance of the
fitness function a:, the mutation rate p , the mean of the mutation function a x ) , and the variance of the mutation distribution u:. T h e density function of mutational effects, g(x), is assumed to be either Gaus- sian with mean a x ) and variance a i (and truncated at zero) or uniform centered on g(x). T h e equilibrium distribution, p ( x ) , can be obtained numerically from the left eigenvector corresponding to the largest ei- genvalue of V = wiuv (TURELLI 1985), but we chose to iterate the transformation over generations because manipulating a 200 X 200 matrix was cumbersome, and convergence was sufficiently rapid (on the order of l / p generations). T h e criterion for equilibrium was a change over 100 successive generations of less than in the mean of p ( x ) , and at that time the mean, variance, and skewness (E(x3)/E(x2)"/') were tallied. All numerical work was done in double precision on a SUN 3/50 workstation.
KINCMAN (1 978) solved the house-of-cards recur- sion (14) to obtain the equilibrium distribution of allelic effects:
where
K
satisfies the equationJfi(x)dx = 1. (16)
T h e validity of this approximation in this context, when the distribution of allelic effects can depart markedly from a normal distribution, was tested by solving (1 5) and (16) numerically. T h e mean, vari- ance, and skewness of $(x) is reported along with the simulation results.
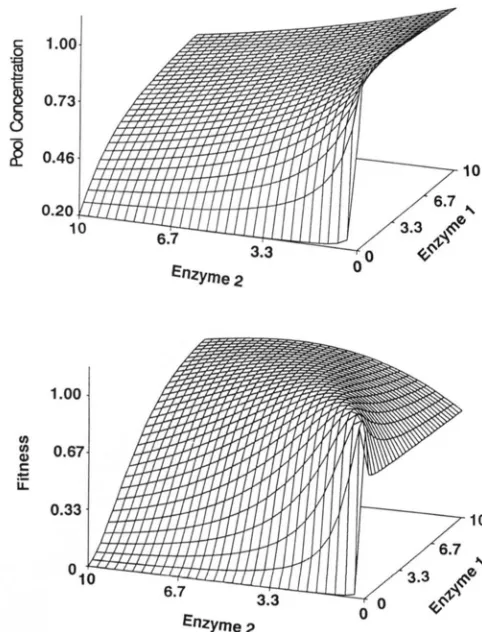
Two-enzyme mutation-selection balance: T h e joint evolution of two enzymes can be explored with the one locus continuum-of-alleles model by allowing pleiotropic effects of mutations. T h e mutations have
U -
1.0
u) cn
c
aJ
L
ii 0.9
0.8 1
FIGURE 3.-(Top) With two enzymes embedded in a linear path-
way, the relation between activities and flux is a surface that saturates at high levels of both enzymes. The function plotted is Flux = l/[(l/E,)
+
(I/&)+
11. (Bottom) If there is optimizing selection acting on flux, with a fitness maximum at a flux of 0.7 andd
= 0.2, then the surface that relates enzyme activities to fitness has a ridge as indicated.effects on the two enzymes in a linear pathway, and selection may act on any global property of the path- way. T h e flux through the pathway can be expressed from
(2)
asa
= (l/El)
+
(1/&)+
6' (1 7)This function is plotted in Figure 3, showing that flux reaches a plateau at high activities of both enzymes. When Gaussian stabilizing selection is applied to flux, the mapping between enzyme activities and fitness has a curved ridge that runs from high activity of E1 and low activity of E:! through low activity of El and high activity of E2 (Figure 3). Fitness might instead depend on the concentration of an intermediate metabolite. If [S2] is the concentration of the metabolite that is between E l and E:! in the pathway, then (1) has a solution of the form
5
1.00w
0.73
$
0.460.20
1
0 -
1 .oo
u)
c
L
L
S
0.670.33
O 1
FIGURE 4.-(Top) The relationship between the activities of two enzymes in a linear pathway and the steady state concentration of the metabolite between the t w o enzymes (enzyme 1 is "upstream" and enzyme 2 is "downstream"). The function plotted is [SI = (2El
+
0.2E2)/(2EI+
E?). (Bottom) When optimizing selection acts on the concentration of the metabolite, the surface that relates enzyme activities to fitness has a ridge running along El = E?. Fitness is Gaussian on [SI, with mean 0.7 and variance 0.10.( E l ) increases
[&I,
while increasing activity of the downstream enzyme (E*) decreases[&I.
At high ac- tivities of both enzymes, all partial derivatives tend toward zero, and the surface tends to flatten out. If Gaussian stabilizing selection is now applied to[&I,
the function that relates the activities of the two enzymes to fitness has a ridge that runs from low activities of both enzymes to high activities of both enzymes (Figure 4).model has the same form as (1 l), where p ( x ) , w ( x ) ,
and g(x) are replaced by bivariate distributions of allelic effects p ( x , y ) , fitnesses w(x,y), and mutational effects g(x,y), and the integration is taken over all values of x and y. T h e distribution of allelic effects may initially be bivariate normal, but the processes of mutation and selection soon make it depart from this form. T h e fitness function w(x,y) is represented by compounding the function that maps activities into flux or metabolite concentration with the bivariate A bivariate analog of the KIMURA-LANDE-FLEMING
o.m
0 1 2 3 4 I
Enzyme
activityFIGURE 5.-Equilibrium distribution of allelic effects in the case of selection on metabolic flux (parameters are those of line 15 in Table 1). The solid line is the solution found numerically by iterating the recursion to equilibrium, and the dashed line repre- sents the solution to the house-of-cards approximation (Equation 15). Note that the house-of-cards model accurately portrays the skewed distribution.
Gaussian selection acting on the flux or metabolite concentration. Mutations may have pleiotropic effects on both enzymes, and the distribution of mutational effects is assumed to be bivariate normal. There are five parameters of the mutational distribution that must be specified, including the means and variances of effects on both enzyme activities, and the correla- tion of mutational effects. T h e house-of-cards approx- imation can also be made in this bivariate case, by simply substituting the bivariate analogs of p ( x ) , w ( x ) ,
and g(x) into (1 4).
Numerical simulation of the two-enzyme model closely parallels the one-enzyme simulations. The bi- variate distribution of allelic effects is discretized into a 30 X 30 grid, and the distribution of allelic effects is initialized. Natural selection occurs by weighting each element of the 30 X 30 grid by the fitness and normalizing. A fraction p of the alleles of the subse- quent generation are novel mutations, the distribution of which is specified. This cycle of selection and mu- tation is continued until the mean of the distribution of allelic effects changes less than over a 100, generation period. Only two functions that map en- zyme activities into flux and
[SI
were examined (those plotted in Figure 5 ) , and a range of input parameters, including selection optima, variances, correlations, and mutational means, variances and correlations was examined.NUMERICAL RESULTS
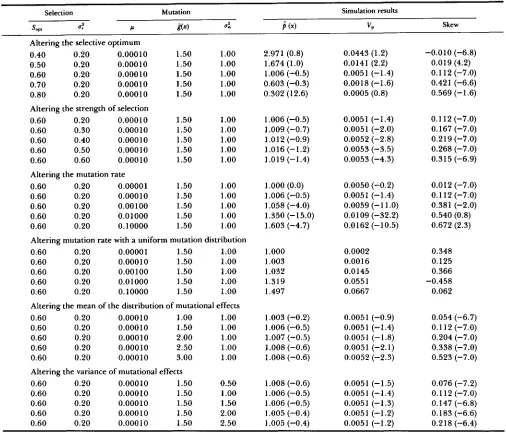
TABLE 1
Results of simulations of the one-enzyme model with stabilizing selection on flux
Selection Mutation Simulation results
JW d Ir &x) a i P ( x ) "P Skew
Altering the selective optimum
0.40 0.20 0.00010 1.50 1 .oo 0.701 (-0.1)" 0.0025 (-29.5) 0.163 (26.1)
0.50 0.20 0.00010 1.50 1 .oo I .003 (-0.2) 0.0051 (-0.8) 0.071 (-6.8)
0.60 0.20 0.00010 1.50 1 .oo 1.504 (-0.2) 0.0114 (-0.7) 0.020 (-7.1)
0.70 0.20 0.00010 1.50 1 .oo 2.239 (-0.6) 0.0272 (-1.0) -0.001 (8.5)
0.80 0.20 0.000 10 1.50 1 .oo 3.953 (1.0) 0.0783 (1.9) -0.010 (-6.7)
Altering the strength of selection
0.60 0.20 0.00010 1.50 1 .oo 1.504 (-0.2) 0.01 14 (-0.7) 0.020 (-7.1)
0.60 0.30 0.00010 1.50 1 .oo 1.507 (-0.4) 0.0114 (-1.1) 0.030 (-7.1)
0.60 0.40 0.00010 1.50 1 .oo 1.510 (-0.5) 0.0115 (-1.5) 0.039 (-7.1)
0.60 0.50 0.00010 1.50 1 .oo 1.513 (-0.7) 0.0115 (-1.9) 0.048 (-7.0)
0.60 0.60 0.00010 1.50 1 .oo 1.515 (-0.8) 0.01 16 (-2.3) 0.056 (-7.0)
Altering the mutation rate
0.60 0.20 0.00001 1.50 1 .oo 1.500 (0.0) 0.0113 (-0.1) 0.002 (-7.1)
0.60 0.20 0.00010 1.50 1 .oo 1.504 (-0.2) 0.0114 (-0.7) 0.020 (-7.1)
0.60 0.20 0.00 100 1.50 1.00 1.543 (-2.0) 0.0122 (-5.7) 0.150 (-6.4)
0.60 0.20 0.0 1000 1.50 1.00 1.687 (-5.4) 0.0159 (-15.0) 0.378 (-2.7)
0.60 0.20 0.10000 1.50 1 .oo 1.720 (0.1) 0.0179 (-2.8) 0.480 (-1.1)
Altering mutation rate with a uniform mutation distribution
0.60 0.20 0.00001 1.50 1 .00 I .500 0.00 15 1.404
0.60 0.20 0.00010 1.50 1 .oo 1.501 0.0 104 0.191
0.60 0.20 0.00100 1.50 1 .oo 1.502 0.0543 0.016
0.60 0.20 0.0 1000 1.50 1 .oo 1.500 0.0652 0.006
0.60 0.20 0.10000 1.50 1 .oo 1.500 0.0665 0.001
Altering the mean of the distribution of mutational effects
0.60 0.20 0.00010 1.00 1.00 1.501 (-0.1) 0.0113 (-0.3) 0.007 (-7.1)
0.60 0.20 0.00010 1.50 1.00 1.504 (-0.2) 0.01 14 (-0.7) 0.020 (-7.1)
0.60 0.20 0.00010 2.00 1.00 1.508 (-0.4) 0.01 14 (-1.1) 0.043 (-7.2)
0.60 0.20 0.00010 2.50 1 .oo 1.510 (-0.5) 0.0115 (-1.4) 0.078 (-7.2)
0.60 0.20 0.000 10 3.00 1 .00 1.510 (-0.5) 0.01 15 (-1.6) 0.127 (-7.1)
Altering the variance of mutational effects
0.60 0.20 0.000 10 1.50 0.50 1.504 (-0.2) 0.01 14 (-0.7) 0.010 (-7.3)
0.60 0.20 0.00010 1.50 1 .oo 1.504 (-0.2) 0.01 14 (-0.7) 0.020 (-7.1)
0.60 0.20 0.00010 1.50 1.50 I .504 (-0.2) 0.01 14 (-0.7) 0.030 (-6.9)
0.60 0.20 0.00010 1.50 2.00 1.504 (-0.2) 0.01 14 (-0.7) 0.040 (-6.7)
0.60 0.20 0.00010 1.50 2.50 1.504 (-0.2) 0.01 14 (-0.7) 0.050 (-6.6)
In these simulations, Gaussian stabilizing selection acts on flux with an optimum atJop, and a variance of 6:. WhenJOp, = 0.4, 0.5, 0.6, 0.7
or 0.8, the enzyme activities that produce these optimal fluxes are 0.67, 1.0, 1.50, 2.33 and 4.0, respectively. Mutations occur at a rate of p,
and the variance of the distribution of mutational effects is 6:. In the house-of-cards case, the mean of the distribution of murational effects
is
ax).
For each set of input parameters, the distribution of allelic effects is allowed to evolve to equilibrium, and the mean ( p (x)), variance(V,) and skewness are reported. The deviation of the house-of-cards results ( H C ) from the Gaussian results ( G ) are reported as the percent relative error, which is 100 X ( H C
-
G ) / G .a The numbers in parentheses are the percent relative deviations of the house-of-cards approximation from the continuum-of-alleles
simulation.
selection simulations when flux is subjected to stabiliz- ing selection. T h e first set of parameters in Table 1 examines the effect of increasing the mean of the selected optimum. T h e effect this has on the fitness function can be seen in Figure 2. As the optimum flux moves closer to the plateau level, the fitness function shifts to the right and becomes less peaked. This results in increasing equilibrium mean activity and variance. T h e degree of skewness of p ( x ) decreases as the mean increases, in part because the population is
shifted away from the truncation at 0. The three rightmost columns of Table 1 were obtained by solv-
ing (14), and determining the mean, variance, and
916 A. G. Clark
T h e second parameter set in Table 1 examines the effect of increasing :.a As predicted, the mean and variance increase only slightly as the strength of selec- tion decreases, in part because of the relatively low mutation rate. T h e third parameter set in Table 1 varies the mutation rate. Because of the asymmetry of the selection function (on the scale of enzyme activity), with weaker selection acting against high activity mu- tants, as the mutation rate increases, the mean and variance of the distribution of allelic effects increases. This too was accurately predicted by the house-of- cards model.
In the fourth set of parameters in Table 1 the mean of the distribution of mutational effects increases. Because of the high variance in mutational effects and the low mutation rate, the equilibrium mean is largely determined by selection, and is only slightly affected by varying the mutational mean. T h e last parameter varied is ,:a the variance in the distribution of muta- tional effects. T h e effects on the mean and the vari- ance of the distribution of allelic effects at equilibrium were negligible, but the skewness increased with in- creasing mutational variance.
Table 2 reports the results of simulations and house- of-cards predictions for the same parameter values as Table 1, but here selection optimizes the concentra- tion of a metabolite that is ahead of the enzyme in the metabolic pathway. As selection favors higher metab- olite concentrations, the activity of the selected en- zyme decreases, and the skewness of the distribution of allelic effects increases. Relative insensitivity to a:, a;, p and the mean of the mutational distribution are again corroborated by the house-of-cards approxima- tion.
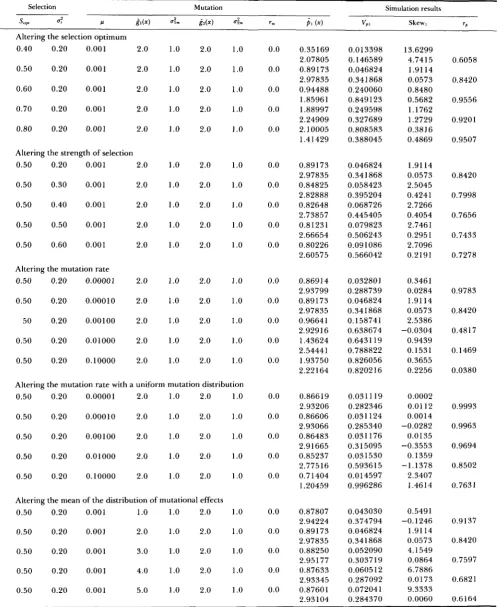
Tables 3 and 4 report the results of the two-enzyme models, with selection acting on flux and metabolite concentration, respectively. T h e most striking result from these two tables is that every case of selection acting on flux results in a negative correlation of allelic effects, and every case of selection optimizing a me- tabolite concentration results in a positive correlation. Examination of Figures 3 and 4 reveals ridges in the fitness functions that give intuitive appeal to this re- sult. T h e first parameter varied in Table 3 is the optimum flux (the mean of the fitness function w(x,y)). As in the one enzyme case, selecting for higher flux increases the equilibrium activities, but the additional change in the two enzyme case is that the magnitude of the correlation between activities decreases from a highly significant negative value (-0.736) to -0.223. T h e reason is clear: as the optimum flux is increased toward the maximum flux, the fitness surface becomes more flat. Increasing the mutation rate results in higher equilibrium variance in allelic effects, and de- creases the magnitude of the correlation. As the mean of the distribution of mutational effects increases for one enzyme, the corresponding equilibrium mean of
allelic effects increases, while the other enzyme ex- hibits a decrease in equilibrium mean. This is a con- sequence of the negative equilibrium genetic correla- tion between the two activities. Increasing the vari- ance in the distribution of mutational effects increases the equilibrium variance slightly, as predicted from the house-of-cards approximation (not shown). T h e last five lines of Tables 3 and 4 show that with reason- able mutation rates and strong selection, the distri- bution of mutational effects can be highly correlated and not influence the equilibrium correlation of allelic effects. This result is consistent with the findings of LANDE (1 980), and may provide a key to experimental tests of the theory of mutation-selection balance for metabolic traits.
In all the simulations reported in Tables 1 through
4, the mean fitness at equilibrium was very close to one, implying that selection was weak. Even in the cases of a mutation rate of 0.1, the mean fitness was 0.99957 in the flux optimizing case (Table 1) and 0.984 15 in the case of optimizing metabolite concen- tration (Table 2). With a mutation rate of the mean selection coefficient was
ioF3
or lower.DISCUSSION
Five general conclusions can be drawn from the results of the analyses of models of mutation-selection balance when selection acts on a global property of a metabolic pathway. (1) T h e equilibrium distribution of allelic effects is usually skewed, with a longer tail toward high enzyme activities. This is so whether selection acts on flux or metabolite concentration, because both result in skewed fitness functions and probably skewed distributions of mutational effects as well (see also BEAUMONT 1988). (2) If natural selection acts to optimize flux, there tend to be negative cor- relations among allelic effects on the activities of pairs of enzymes within the pathway. (3) If natural selection acts to optimize metabolite concentration, there tends to be a positive correlation among allelic effects on activities of enzymes that flank the selected metabo- lite. (4) Experimental verification of the theory will require estimates of several aspects of mutations, in- cluding the polygenic mutation rates and the distri- bution of mutational effects. ( 5 ) Because of these experimental unknowns, it is premature to assess whether mutation-selection balance can explain levels of variation in enzyme activities observed in natural populations (LAURIE-AHLBERG et al. 1982; CLARK
1989, 1990).
Evolution of Metabolic Control
TABLE 4
Results of simulations of the one-enzyme model with stabilizing selection on metabolite concentration [SI
Selection Mutation Simulation results
s=+ a: P
a4
0:i
( 4 "P SkewAltering the selective optimum
0.40 0.20 0.00010 1.50 1
.oo
0.50 0.20 0.00010 1.50 1
.oo
0.60 0.20 0.00010 1.50 1
.oo
0.70 0.20 0.00010 1.50 1
.oo
0.80 0.20 0.00010 1.50 1
.oo
Altering the strength of selection
0.60 0.20 0.00010 1.50 1
.oo
0.60 0.30 0.00010 1.50 1
.oo
0.60 0.40 0.00010 1.50 1
.oo
0.60 0.50 0.00010 1.50 1
.oo
0.60 0.60 0.00010 1.50 1
.oo
Altering the mutation rate
0.60 0.20 0.00001 1.50 1
.oo
0.60 0.20 0.00010 1.50 1
.oo
0.60 0.20 0.00100 1.50 1
.oo
0.60 0.20 0.01000 1.50 1
.oo
0.60 0.20 0.10000 1.50 1
.oo
Altering mutation rate with a uniform mutation distribution
0.60 0.20 0.00001 1.50 1
.oo
0.60 0.20 0.00010 1.50 1
.oo
0.60 0.20 0.00100 1.50 1
.oo
0.60 0.20 0.01000 1.50 1
.oo
0.60 0.20 0.10000 1.50 1
.oo
Altering the mean of the distribution of mutational effects
0.60 0.20 0.00010 1
.oo
1.oo
0.60 0.20 0.00010 1.50 1
.oo
0.60 0.20 0.00010 2.00 1
.oo
0.60 0.20 0.00010 2.50 1
.oo
0.60 0.20 0.00010 3.00 1
.oo
Altering the variance of mutational effects
0.60 0.20 0.00010 1.50 0.50
0.60 0.20 0.00010 1.50 1
.oo
0.60 0.20 0.00010 1.50 1.50
0.60 0.20 0.00010 1.50 2.00
0.60 0.20 0.000 10 1.50 2.50
2.971 (0.8) 1.674 (1.0) 1.006 (-0.5) 0.603 (-0.3) 0.302 (12.6)
1.006 (-0.5) 1.009 (-0.7) 1.012 (-0.9) 1.016 (-1.2) 1.019 (-1.4)
1.000 (0.0) 1.006 (-0.5) 1.058 (-4.0) 1.350 (-15.0) 1.603 (-4.7)
1
.ooo
1.003 1.032 1.319 1.4971.003 (-0.2) 1.006 (-0.5) 1.007 (-0.5) 1.008 (-0.6) 1.008 (-0.6)
1.008 (-0.6) 1.006 (-0.5) 1.006 (-0.5) 1.005 (-0.4) 1.005 (-0.4)
0.0443 (1.2) 0.0141 (2.2) 0.0051 (-1.4) 0.0018 (-1.6) 0.0005 (0.8)
0.0051 (-1.4) 0.0051 (-2.0) 0.0052 (-2.8) 0.0053 (-3.5) 0.0053 (-4.3)
0.0050 (-0.2) 0.0051 (-1.4) 0.0059 (-1 1.0) 0.0109 (-32.2) 0.0162 (-10.5)
0.0002 0.0016 0.0145 0.0551 0.0667
0.0051 (-0.9) 0.0051 (-1.4) 0.0051 (-1.8) 0.0051 (-2.1) 0.0052 (-2.3)
0.0051 (-1.5) 0.0051 (-1.4) 0.0051 (-1.3) 0.0051 (-1.2) 0.0051 (-1.2)
-0.010 (-6.8) 0.019 (4.2) 0.112 (-7.0) 0.421 (-6.6) 0.569 (-1.6)
0.1 12 (-7.0) 0.167 (-7.0) 0.219 (-7.0) 0.268 (-7.0) 0.315 (-6.9)
0.012 (-7.0) 0.1 12 (-7.0) 0.381 (-2.0) 0.540 (0.8) 0.672 (2.3)
0.348 0.125 0.366
0.062 -0.458
0.054 (-6.7) 0.1 12 (-7.0) 0.204 (-7.0) 0.338 (-7.0) 0.523 (-7.0)
0.076 (-7.2) 0.112 (-7.0) 0.147 (-6.8) 0.183 (-6.6) 0.218 (-6.4)
. , . . . ,
In these simulations, Gaussian stabilizing selection acts on one metabolite concentration with an optimum at Sopr and a variance of u:. The relationship between the downstream enzyme activity and S used in all simulations is S = (1
+
0.2E)/(1+
E ) . When Sop, = 0.4, 0.5, 0.6, 0.7 or 0.8, the enzyme activities that produce these optimal concentrations are 3.00, 1.67, 1.0, 0.6 and 0.33, respectively. Mutations occur as described in the footnote of Table 1.clude the accumulation of phenylalanine and phenyl- pyruvate in phenylketonuria (PKU), ceramide tri- hexoside in Fabry's disease, galactose-1 -phosphate in galactosemia, orotic acid in oroticaciduria, glycogen in von Gierke's disease, homogentisic acid in alkapton- uria, uric acid in Lesch-Nyhan disease, and GM2 gan- glioside in Tay-Sachs disease (BROCK and MAYO
1978). In all these examples, the genetic cause of the disorder is a mutation in the structural gene for an enzyme causing a loss of activity. Examples of genetic lesions whose deleterious phenotype is caused by a lack of a product include albinism and GGPD defi- ciency, both of which are also loss-of-activity muta- tions. While conditions favoring maximization or op- timization of flux can be imagined and experimentally
established (such as nutrient-limiting chemostats), a consideration of human inborn errors of metabolism makes it appear that the deleterious effects of most metabolic errors are due to a departure from meta- bolic homeostasis. Changes in activity of an enzyme will affect the immediately flanking metabolite pools more than pools more distant in the pathway (as is the case for the human inborn errors of metabolism cited above). This means that natural selection acting on the concentration of a particular metabolite can have a greater effect on loci that regulate the immediately flanking enzymes.
Clark
TABLE 3
Results of simulations of the two-enzyme model with optimizing selection on flux
Selection Mutation Simulation results
J"V
IT:
P gl(x) d m g.L(x) a%, 7, P l W "9 I Skew,rP Altering the selection optimum
0.40 0.20 0.001 2.0 1.0 2.0 1.0 0.0 1.47308 0.228305
0.50 0.20 0.001 2.0 1.0 2.0 1.0 0.0 2.13958 0.3931 00
0.60 0.20 0.001 2.0 1.0 2.0 1.0 0.0 3.03524 0.277874
0.70 0.20 0.001 2.0 1.0 2.0 1.0 0.0 4.63568 0.277371 -0.3849 -0.5649
0.80 0.20 0.001 2.0 1.0 2.0 1.0 0.0 7.54038 0.330861 -2.3823 -0.2233
Altering the strength of selection
0.50 0.20 0.001 2.0 1.0 2.0 1.0 0.0 2.13958 0.393100
0.50 0.30 0.001
1.3862 -0.7103
2.0 1.0 2.0 1.0 0.0 2.14903 0.413981
0.50 0.40 0.001
1.2294 -0.6978 2.0 1.0 2.0 1.0 0.0 2.1 5544 0.427659
0.50 0.50 0.001
1.13 14 -0.6809
2.0 1.0 2.0 1.0 0.0 2.15997 0.437472
0.50 0.60 0.001
1.0609 -0.6625
2.0 1.0 2.0 1.0 0.0 2.16325 0.445093 1.0670 -0.6436
Altering the mutation rate
0.50 0.20 0.00001 2.0 1.0 2.0 1.0 0.0 2.09712 0.269711
0.50 0.20 0.00010 2.0 1.0 2.0 1.0
1.2869 -0.7933
0.0 2.13958 0.393100
0.50 0.20 0.00100 2.0 1.0 2.0 1.0
1.3862 -0.7103
0.0 2.17916 0.509618
0.50 0.20 0.01000 2.0 1.0 2.0 1.0
0.7 138 -0.4506
0.0 2.15677 0.710053 0.3749 -0.1056
0.50 0.20 0.10000 2.0 1.0 2.0 1.0 0.0 2.10362 0.814761 0.2959 -0.0209
Altering the mutation rate with a uniform mutation distribution
0.50 0.20 0.00001 2.0 1.0 2.0 1.0 0.0 2.09334 0.260432 1.2740 -0.8035
0.50 0.20 0.00010 2.0 1.0 2.0 1.0 0.0 2.09258 0.261377 1.2593 -0.7960
0.50 0.20 0.00100 2.0 1.0 2.0 1.0 0.0 2.08497 0.270779 1.1220 -0.7244
0.50 0.20 0.01000 2.0 1.0 2.0 1.0 0.0 2.08080 0.359242 0.3630 -0.2293
0.50 0.20 0.10000 2.0 1.0 2.0 1.0 0.0 1.15457 0.546257 0.2725 0.0708
Altering the mean of the distribution of mutational effects
0.50 0.20 0.001 1.0 1.0 2.0 1.0 0.0 2.01056 0.262620 1.1961 -0.7524
0.50 0.20 0.001 2.0 1.0 2.0 1.0 0.0 2.13958 0.393100 1.3862 -0.7103
0.50 0.20 0.001 3.0 1.0 2.0 1.0 0.0 2.62688 0.812046 0.7174 -0.7296
0.50 0.20 0.001 4.0 1.0 2.0 1.0 0.0 3.12920 1.200150 0.1629 -0.7488
0.50 0.20 0.001 5.0 1.0 2.0 1.0 0.0 3.16137 1.716510 0.4639 -0.7386
1.0708 -0.7356
1.3862 -0.7103
0.5692 -0.7329
2.20263 0.364970 1.2480
2.13958 0.393100 1.3862
1.87334 0.302120 1.5939
1.70199 0.238432 1.8098
1.74804 0.259471 1.5959
Altering the variance of mutational effects
0.50 0.20 0.001 2.0 0.5 2.0 0.5 0.0 2.09400 0.250316 1.0940 -0.7205
0.50 0.20 0.001 2.0 1.0 2.0 1.0 0.0 2.13958 0.393100 1.3862 -0.7103
0.50 0.20 0.001 2.0 1.5 2.0 1.5 0.0 2.17762 0.518220 1.4058 -0.7045
0.50 0.20 0.001 2.0 2.0 2.0 2.0 0.0 2.19855 0.591365 1.4310 -0.6972
0.50 0.20 0.001 2.0 2.5 2.0 2.5 0.0 2.20939 0.633272 1.4752 -0.6891
Altering the correlation of mutational effects
0.50 0.20 0.001 1.0 1.0 2.0 1.0 -0.9 2.05716 0.201984 1.8549 -0.7093
0.50 0.20 0.001 1.0 1.0 2.0 1.0 -0.5 2.13116 0.296567 1.1519 -0.7642
0.50 0.20 0.001 1.0 1.0 2.0 1.0 0.0 2.20263 0.364970 1.2480 -0.7524 0.50 0.20 0.001 1.0 1.0 2.0 1.0 0.5 2.23451 0.350929 1.1054 -0.7432
0.50 0.20 0.001 1.0 1.0 2.0 1.0 0.9 2.23931 0.270066 0.6775 -0.7356
Subscripts 1 and 2 indicate the respective statistic for enzyme activity characters 1 or 2. In examples where only one set of means and variances are given, the results were identical for the two enzymes. When the results were asymmetrical, the second enzyme is reported beneath the first. Definitions of terms are as for Table 1, with T , the correlation of the bivariate mutation distribution, and r, the correlation of allelic effects at equilibrium.
~~ ~~ ~~~ ~ ~~ ~ ~~
tolerance (CAVENER and CLEGG 198 l), and energy metabolism (CLARK et al. 1983; CLARK 1989). T h e activities of many of the enzymes are strongly inter- correlated, with some tendency for enzymes that have a close metabolic connection to be more strongly correlated (WILTON et al. 1982). Just because enzymes are metabolically adjacent, however, does not suggest that selection operates on them in the same way (CARTER and WATT 1988). One might expect that enzyme activity would differ from traits of typical quantitative genetic models due to the major effects of variation in the structural gene, but as little as 10% of the variation in activity of G6PD and 6PGD are due to allozyme variation (MIYASHITA et al. 1986). Similarly, the contribution of the structural loci to the genetic correlation between these activities is much smaller than that of modifiers on other chromosomes. Interactions between modifiers on different chromo- somes were found to be much weaker than main effects (MIYASHITA et al. 1986).
Long-term mutation-accumulation experiments of MUKAI and co-workers have allowed quantification of the rate of mutational accumulation of variance in activities of Adh (MUKAI, HARADA and YOSHIMARU
1984) and Amylase (TACHIDA et al. 1989). Both the mutation rate to null alleles and the population fre- quency of null alleles have been estimated for
D.
melanogaster, and the estimates are consistent with a mutation-selection balance provided that selection coefficients against null heterozygotes is about 0.00 15 (LANGLEY et al. 1981). Although the simulations span this selection intensity, the models presented here do not accommodate the observation of nulls, because the haploid models assume additivity, and 13 of the 14 loci produced viable genotypes when homozygous for null alleles. T r u e nulls must reduce the pathway flux to zero, in which case the selection functions used here result in a fitness of zero. T h e observation of viable homozygous nulls implies that either the rele- vant metabolic pathway is not essential or that alter- native pathways are available. Finally, the simulations of this report show that selection on metabolite con- centration results in a striking tendency for positive correlations in activity, and experimental observations indicate that positive correlations occur much more frequently than negative correlations (WILTON et al.
1982; CLARK and KEITH 1988, 1989; CLARK 1989, 1990). In some cases, such as the strong positive correlation between GGPD and 6PGD activities, the deleterious effects of imbalanced activities are evident (EANES 1984; CLARK 1989).
While the initial development of metabolic control theory invoked many restrictive assumptions (a linear pathway of unsaturated enzymes all in homogeneous solution), most of the results described here are more generally applicable. Provided there is an asymptotic
relation between enzyme activity and the global prop- erty undergoing selection (flux, metabolite concentra- tion, or whatever), a non-Gaussian distribution of allelic effects will be obtained at mutation-selection balance. Regardless of the biochemical details, the observation that heterozygotes for nulls are generally closer to wild phenotype than the null homozygote argues that the mean phenotype is on the plateau of the relation between activity and fitness (or pheno- type). In the absence of natural selection, mutations that decrease activity predominate, and the popula- tion would inexorably move toward fixation for zero activity as loss-of-function mutations occur and are fixed by drift. Rather than the population evolving toward neutrality (HARTL, DYKHUIZEN and DEAN
1985), it might be more precise to view it as evolving toward a balance between natural selection retaining activity and mutational loss of activity.
T h e purpose of the analyses presented here was to begin to explore the theoretical consequences of nat- ural selection acting on characters related to metabo- lism when mutations alter enzyme activities. While the continuum-of-alleles model of mutation-selection bal- ance has been widely applied, it almost entirely ignores the complications introduced by real genetic trans- mission. Haploid models implicitly assume only addi- tive effects and no allelic interactions. While domi- nance and epistasis in diploid and multi-locus models will add complicating constraints, some properties of the haploid model are likely to be conserved (TURELLI and BARTON 1990). In particular, the skewed distri- butions of allelic effects are a consequence of the plateau in the fitness functions, and will probably be found regardless of the genetic model. Similarly, the negative correlation across enzymes under flux selec- tion and positive correlation across enzymes under selection on metabolite concentration are properties of the fitness function, and will probably be present in diploid models. T h e analysis of SLATKIN (1987) showed that a diploid model with recessive alleles and stabilizing selection maintains somewhat more genetic variance at equilibrium than a haploid model, but otherwise the haploid and diploid models yielded very similar results.
Other investigators have found that haploid models provide a good approximation to the diploid and pleiotropic cases in a variety of circumstances. TUR-
TABLE 4
Results of simulations of the two-enzyme model with optimizing selection on [SI
Selection Mutation Simulation results
SO,, 0: w g l ( x ) d m g&) d m rm il ( 4 V, 1 Skew,
-
Altering the selection optimum
0.40 0.20 0.001 2.0
0.50 0.20 0.001 2.0
0.60 0.20 0.001 2.0
0.70 0.20 0.001 2.0
0.80 0.20 0.001 2.0
Altering the strength of selection 0.50 0.20 0.001
0.50 0.30 0.001
0.50 0.40 0.001
0.50 0.50 0.001
0.50 0.60 0.001
Altering the mutation rate 0.50 0.20 0.00001
0.50 0.20 0.00010
50 0.20 0.00100
0.50 0.20 0.01000
0.50 0.20 0.10000
2.0 2.0 2.0 2.0 2.0 2.0 2.0 2.0 2.0 2.0 1
.o
1.o
1.o
1.o
1.01
.o
1.o
1
.o
1
.o
1.o
1.o
1.o
1.o
1
.o
1.o
2.0 2.0 2.0 2.0 2.0 2.0 2.0 2.0 2.0 2.0 2.0 2.0 2.0 2.0 2.0 1
.o
1.o
1.o
1.o
1.o
1
.o
1.o
1.o
1
.o
1.o
1.o
1.o
1.o
1.o
1.o
Altering the mutation rate with a uniform mutation distribution0.50 0.20 0.00001 2.0 1.0 2.0 1.0
0.50 0.20 0.00010 2.0 1.0 2.0 1.0
0.50 0.20 0.00100 2.0 1.0 2.0 1.0
0.50 0.20 0.01000 2.0 1.0 2.0 1.0
0.50 0.20 0.10000 2.0 1.0 2.0 1.0
Altering the mean of the distribution of mutational effects
0.50 0.20 0.001 1.0 1.0 2.0 1.0
0.50 0.20 0.001 2.0 1.0 2.0 1.0
0.50 0.20 0.001 3.0 1.0 2.0 1.0
0.50 0.20 0.001 4.0 1.0 2.0 1.0
0.50 0.20 0.001 5.0 1.0 2.0 1.0
0.0 0.0 0.0 0.0 0.0 0.0 0.0 0.0 0.0 0.0 0.0 0.0 0.0 0.0 0.0 0.0 0.0 0.0 0.0 0.0 0.0 0.0 0.0 0.0 0.0 0.35169 2.07805 0.89173 2.97835 0.94488 1.85961 1.88997 2.24909 2.10005 1.41429 0.89173 2.97835 0.84825 2.82888 0.82648 2.73857 0.81231 2.66654 0.80226 2.60575 0.86914 2.93799 0.89173 2.97835 0.9664 1 2.92916 1.43624 2.54441 1.93750 2.22164 0.86619 2.93206 0.86606 2.93066 0.86483 2.91665 0.85237 2.77516 0.71404 1.20459 0.87807 2.94224 0.89173 2.97835 0.88250 2.951 77 0.87633 2.93345 0.87601 2.93104 0.013398 0.146589 0.046824 0.341868 0.240060 0.849123 0.249598 0.327689 0.808583 0.388045 0.046824 0.341868 0.058423 0.395204 0.068726 0.445405 0.079823 0.506243 0.091086 0.566042 0.032801 0.288739 0.046824 0.341868 0.158741 0.638674 0.6431 19 0.788822 0.826056 0.820216 0.031119 0.282346 0.031 124 0.285340 0.031 176 0 . 3 15095 0.031530 0.593615 0.014597 0.996286 0.043030 0.374794 0.046824 0.341868 0.052090 0.303719 0.060512 0.287092 0.072041 0.284370 13.6299 4.7415 1.91 14 0.0573 0.8480 0.5682 1.1762 1.2729 0.381 6 0.4869 1.91 14 0.0573 2.5045 0.4241 2.7266 0.4054 2.7461 0.2951 2.7096 0.2191 0.3461 0.0284 1.91 14 0.0573 2.5386 -0.0304 0.9439 0.1531 0.3655 0.2256 0.0002 0.01 12 0.00 14 -0.0282 0.0135 -0.3553 0.1359 -1.1378 2.3407 1.4614 0.5491 -0.1246 1.91 14 0.0573 4.1549 0.0864 6.7886 0.0173 9.3333 0.0060 7, 0.6058 0.8420 0.9556 0.9201 0.9507 0.8420 0.7998 0.7656 0.7433 0.7278 0.9783 0.8420 0.4817 0.1469 0.0380 0.9993 0.9963 0.9694 0.8502
0.763 1
0.9137
0.8420
0.7597
0.6821
Altering the variance in mutational effects 0.50 0.20 0.001 2.0 0.5
0.50 0.20 0.001 2.0 1.0
0.50 0.20 0.001 2.0 1.5
0.50 0.20 0.001 2.0 2.0
0.50 0.20 0.001 2.0 2.5
Altering the correlation of mutational effects
0.50 0.20 0.001 1.0 1.0
0.50 0.20 0.001 1.0 1.0
0.50 0.20 0.001 1.0 1.0
0.50 0.20 0.001 1.0 1.0
0.50 0.20 0.001 1.0 1.0
2.0
2.0
2.0
2.0
2.0
2.0
2.0
2.0
2.0
2.0 0.5
1
.o
1.52.0
2.5
1
.o
1.o
1.o
1.o
1.o
0.0
0.0
0.0
0.0
0.0
-0.9
-0.5
0.0
0.5
0.9
0.87509 2.92572 0.89173 2.97835 0.90738 3.03027 0.92073 3.07532 0.93234 3.11475
0.80287 2.72136 0.86008 2.89139 0.87807 2.94224 0.86923 2.90686 0.58604 1.87449
0.040744 0.292304 0.046824 0.341868 0.055038 0.415872 0.064082 0.501 134 0.073608 0.593197
0.03 1762 0.281652 0.036600 0.323097 0.043030 0.374794 0.045483 0.381898 0.068622 0.5638 13
1.6433 -0.0755
1.9114 0.0573 2.1 117 0.4442 2.2753 0.8287 2.4048 1.1440
0.8704 0.5785 0.3365 -0.1831
0.5491 -0.1246
0.7767 -0.2 128 1.527 1 0.5222
0.8226
0.8420
0.8626
0.8788
0.8915
0.9137
0.9128
0.9137
0.9075
0.8979
Results of the simulations are reported for both enzymes, with the mean, variance, and skewness of enzyme 1 reported on the same line as the input parameters, and the mean, variance, and skewness for enzyme 2 reported along with the correlation on the line below.
a single trait under mutation-selection balance, assum- ing that the per-locus mutation rate is low and selec- tion is not too weak, the equilibrium variance is in- dependent of the number and effects of alleles, or on the distribution of mutation effects (TURELLI 1984; BARTON and TURELLI 1987, 1988; BURGER 1986, 1989). As was seen in the numerical simulations, this is not always true when there are pleiotropic effects and selection acts on composite characters. T h e de- pendence of the equilibrium on the mutation distri- bution may be due to the skew in the fitness distribu- tion, which causes a skewed distribution of allelic effects (BARTON 1986).
It is necessary to consider the effects of random genetic drift when assessing the conditions for muta- tion-selection balance in finite populations. T h e rela- tion between effective population size and equilibrium genetic variance may be useful in testing mutation- selection balance (HOULE 1989). Theoretical results and Monte Carlo simulations show that the change in variance components due to directional selection are not expected to be dramatically different from the changes due to drift, suggesting that it may be very difficult to infer reliably the operation of selection from variance components (KEIGHTLEY and HILL
1989). Mutation-selection-drift equilibria may occur as a continuum of stable points in the case of when the alleles that contribute to the variation are rare
(hence the relevant loci are diallelic), and shifts among these equilibria occur at a rate that depends on the population size and the strength of selection (BARTON
1986, 1989). BURGER, WAGNER and STETTINGER (1989) examined the heritability of traits in a contin- uum-of-alleles model at mutation-selection-drift equi- librium and found that heritabilities on the order of 0.5 can only be explained if the trait is neutral or if it is determined by very many loci (>loo), or by loci with very large effects. Their analytical solution to the equilibrium genetic variance was bounded by the equi- librium variance in the purely neutral case (V, =
2NeV,, where V , is the variance of mutational effects) and the house-of-cards approximation of TURELLI (1 984).
922 A . G . Clark
precise estimates of mutation rates. Much of the her- itable variation for a trait may be maintained by pleiotropic effects of genes that influence strongly selected traits, and stabilizing selection may appear to operate on neutral traits even when the directly se- lected trait faces directional selection (BARTON 1990). A formal test of whether variation in enzyme activities is compatible with models of mutation-selection bal- ance is complicated by two very difficult problems- assessing the distribution of allelic effects at individual loci and quantifying the intensity of selection (BARTON and TURELLI 1989). T h e distinction between a Gaus- sian approximation to the KIMURA-LANDE-FLEMING model and the house-of-cards model hinges on the number of alleles and the magnitudes of their effects, parameters that would seem resistant to direct empir- ical measure. Perhaps the best approach is to consider multiple characters, and to approach the experimental problem through causes of correlation. One could, for example, estimate correlated mutational effects without knowing the number of loci or the effects of each mutation. Constraints on pleiotropic effects can be empirically tested [as in WAGNER’S (1 989) B-matrix model], by directly quantifying the mutational distri- bution of phenotypic effects. According to the Gaus- sian approximation model of LANDE, the equilibrium variances of traits with zero genetic correlation are independent, and directional selection on either trait will not change the correlation between the two traits. In the house-of-cards model, where most alleles are rare and mutations are rare but have large effects, the equilibrium variance of one trait depends on that of the other trait, even when they are uncorrelated, and the genetic correlation is expected to change under directional selection on one trait. Unfortunately, these two extreme models do not seem to be connected by a smooth continuum of intermediate behaviors, mak- ing empirical tests difficult (SLATKIN and FRANK
1990). Other parameterizations of models of pleio- tropic selection demonstrate great sensitivity to initial conditions (HASTINGS and HOM 1990).
Molecular biology has identified a wide variety of transcription factors, providing a likely mechanism for pleiotropic effects and for coordinated regulation of gene expression. Particularly good examples of mutations having correlated effects on the expression of other genes are the enhancers and suppressors of position effect variegation in Drosophila (TARTOF et al. 1989). Explicit metabolic models that connect var- iation at the genetic and phenotypic levels will help extend quantitative genetics theory beyond simple descriptions of variance components, and will suggest tests of the ability of the models to explain the mag- nitude and structure of variation of these complex traits in natural populations.
I thank CATHY LAURIE (Duke University) for suggesting the
problem of mutation-selection balance in the context of maintaining variation in enzyme activities and MICHAEL TURELLI for suggesting an analytical approach to the problem. This work was supported by grant BSR-9007436 from the National Science Foundation.
LITERATURE CITED
BARNES, P. T., and C. C. LAURIE-AHLBERG, 1986 Genetic varia- bility of flight metabolism in Drosophila melanogaster. 111. Ef- fects of Gpdh allozymes and environmental temperature on power output. Genetics 112: 267-294.
BARTON, N. H., 1986 The maintenance of polygenic variation through a balance between mutation and stabilizing selection. Genet. Res. 47: 209-216.
BARTON, N. H . , 1989 The divergence of a polygenic system subject to stabilizing selection, mutation and drift. Genet. Res. 54: 59-77.
BARTON, N. H., 1990 Pleiotropic models of quantitative variation. Genetics 124: 773-782.
BARTON, N. H., and M. TURELLI, 1987 Adaptive landscapes, genetic distance, and the evolution of quantitative characters. Genet. Res. 4 9 157-173.
BARTON, N. H., and M. TURELLI, 1989 Evolutionary quantitative genetics: how little do we know? Annu. Rev. Genet. 23: 337- 370.
BEAUMONT, M. A., 1988 Stabilizing selection and metabolism. Heredity 61: 433-438.
BROCK, D. J. H . , and 0. MAYO, 1978 The Biochemical Genetics of
M a n , Ed. 2. Academic Press, New York.
BURGER, R., 1986 On the maintenance of genetic variation: global analysis of Kimura’s continuum-of-alleles model. J. Math. Biol.
BURGER, R., 1989 Linkage and the maintenance of heritable variation by mutation-selection balance. Genetics 121: 175-
184.
BURGER, R., G. P. WAGNER and F. STETTINGER, 1989 How much heritable variation can be maintained in finite populations by mutation-selection balance? Evolution 43: 1748-1 766. CABALLERO, A,, M. A. TORO and C. LOPEZ-FANJUL, 1991 The
response to artificial selection from new mutations in Drosophila melanogaster. Genetics 127: 89-102.
CARTER, P. A., and W . B. WATT, 1988 Adaptation at specific loci. V. Metabolically adjacent enzyme loci may have very distinct experiences of selective pressures. Genetics 119 91 3-924. CAVENER, D. R., and M. T. CLEGG, 1981 Evidence for biochemi-
cal and physiological differences between enzyme genotypes in Drosophila melanogaster. Proc. Natl. Acad. Sci. USA 78: 4444- 4447.
CLARK, A. G., 1989 Causes and consequences of variation in lipid and carbohydrate storage in Drosophila. Genetics 123: 13 1 -
144.
CLARK, A. G., 1990 Genetic components of variation in energy storage in Drosophila melanogaster. Evolution 44: 637-650. CLARK, A. G., and L. E. KEITH, 1988 Variation among extracted
lines of Drosophila melanogaster in triacylglycerol and carbohy- drate storage. Genetics 119 595-607.
CLARK, A. G., and L. E. KEITH, 1989 Rapid enzyme kinetic assays of individual Drosophila and comparisons of field-caught D. melanogaster and D . simulans. Biochem. Genet. 27: 263-278. CLARK, R. L., E. BOERWINKLE, G. J. BREWER and C. F. SING,
1983 Studies of enzyme polymorphism in the Kamuela pop- ulation of Drosophila mercatorum. 111. Effects of variation at the (u-GPD locus and subflight stress on the energy charge and glycolytic intermediate concentrations. Genetics 104 661-675. CROW, J. F., and M. KIMURA, 1964 The theory of genetic loads.
Proc. XIth lnt. Congr. Genet. 2: 495-505.
DEAN, A. M., 1989 Selection and neutrality in the lactose operon of Escherichia coli. Genetics 123: 441-454.