Abstract
MEHROTRA, MINOO. Application of Color Sorting Technology for Reduction of Fruity Fermented Off-flavor and Improvement of Flavor and Shelf Life of Roasted Peanuts. (Under the direction of Dr. Timothy H. Sanders.)
A range of maturity stages is present in peanut pods at any harvest date due to an indeterminate flowering habit. Since the size-maturity relationship is not absolute, immature peanuts are found in all grade sizes. Immature peanuts are associated with increased fruity
fermented off-flavor potential at high curing temperatures (>35°C). Upon roasting immature
peanuts acquire a darker roast color and have lower roast peanutty flavor than mature peanuts.
The objective of this study was to determine the effectiveness of a novel application of machine color sorting for reduction of fruity fermented off-flavor and improvement of flavor and shelf life of roasted peanuts.
Two fruity-fermented peanut lots of Flavor Runner 458 from the years 2002 and 2003 and a non-fruity fermented lot of Georgia Green (65 kg each) were roasted to a target Hunter L value of 49 ± 1, blanched, and subdivided into 3 sub-lots. Each sub-lot was color sorted using a Sortex color sorter. The sensitivity parameter of the color sorter was increasingly adjusted to separate about 5, 20 and 30 % of the darkest peanuts (rejects) from the lighter
ones (accepts). Hunter L values of 40 ± 2, 43 ± 2 and 45 ± 2 were recorded for the first,
second and third reject fractions (dark peanuts) respectively for all peanut lots. All rejects
A panel highly trained in peanut flavor descriptive sensory analysis evaluated the unsorted and color sorted fractions for all flavor attributes. Statistical analysis indicated significant differences among the light and dark color-sorted peanuts (p <0.0001). The third accept (2002 and 2003 fruity fermented crops) formed after removing ca. 30 % dark peanuts had the highest roast peanutty intensity (4.63 and 4.69). The first reject (2003) consisting of 6.6 % of darkest peanuts received the lowest score for roast peanutty (3.7) and the highest score for fruity off-flavor (3.1). In both the 2002 and 2003 lots there was a reduction in the intensity of fruity fermented off flavor from 2.4 and 2.76 respectively in the unsorted peanuts to 0.48 and 0.41 respectively in the third accept. Dark roast flavor and bitter taste decreased significantly (p> 0.0001) with removal of higher percentage of dark peanuts in the fruity-fermented 2003 crop. No significant differences were established in the descriptive flavor analysis among the accept fractions in the non-fruity fermented lot.
Results from chemical analysis demonstrated that the first reject with ca.5 % of darkest peanuts had significantly lower percentage of oil content (45-46%), higher free fatty acid values (0.22-0.26) and lower O/L ratio (11.48-11.58) in the fruity fermented lots. The rejects from the non-fruity fermented lot had significantly lower O/L ratio (1.54-1.60), higher free fatty acid value (2.45-2.58) and higher sugar concentration (75-82 mg/g). No significant differences were established in the shelf life characteristics among the accept fractions in all peanut lots.
Dedication
For my wonderful daughter Shivani who is wise beyond her years.
Biography
Minoo Mehrotra was born the second child of S.N. Varma and Rama Varma on May 8, 1966. She grew up in India with two brothers. Her parents still live in India. She was in boarding school for most of her academic life. She attended Loreto Convent School and Loreto
College in India. She was captain of her school and was involved with several club activities. She loved to attend camps at Nirmala Bhavan, in Calcutta, India where Mother Teresa worked. She received her Bachelor of Science degree in biological sciences (Botany, Zoology and Chemistry) in 1988 from University of Allahabad, India. She enrolled in 1989 to pursue her Master’s Degree in Anthropology. She was employed in a public school in New Delhi, India for two years where she taught English and Science. She married Sanjay
Acknowledgements
I would like to extend my sincere gratitude to Dr. Tim Sanders, Chairman of my Advisory Committee, for his advice, support and understanding throughout my Master’s Program. I will always remember his encouragement and kindness. His trust in my work and me always boosted my confidence. I would like to thank Dr. Jonathan Allen for being my advisor and for his immense help and guidance throughout my study at NC State University. I would also like to thank Dr. Josip Simunovic for his helpful suggestions. His pleasant attitude and good humor always made me feel very happy that he was my advisor.
I would like to convey my gratitude to Keith Hendrix, Lisa O. Dean, Geeti Patnaik, Jim Schaeffer and Jennifer Stephenson for all their assistance and support during my research. I would like to extend my special thanks to my good friend Beryl Krinsky for always being there when I needed her. Her positive attitude and sincerity was a big help.
I would like to sincerely thank Ian Farrell for helping me become an expert at operating the color-sorting machine. I would also like to thank Sandra Donaghy for her time and effort with the statistical analysis of my data.
Table of Contents
List of tables ………viii
List of figures ………x
Chapter 1. Literature Review ………1
1.1 Brief History of Arachis hypogaea L...………...2
1.2 The Peanut Industry………2
1.3 Composition ………3
1.4 Maturity………..5
1.5 Harvest………7
1.6 Curing ………7
1.7 Flavor ………8
1.6.1 Fruity Fermented Off-flavor ………..10
1.8 Shelf life ………12
1.9 Roast Color ………...13
1.10.1 High Speed Color Sorter………15
1.10.2 Components of the Color Sorter ………...16
1.10.3 Mapping Techniques ……….19
1.10.4 Limitations to Color Sorting ………..20
1.11 References ……….21
Chapter 2. Reduction of fruity fermented off-flavor by color sorting of roasted peanuts …..36
2.1 Abstract………37
2.2 Introduction……….39
2.3 Materials and Methods………42
2.4 Results and Discussion ………...53
2.5 Conclusions ………64
Chapter 3.
Application of color sorting for improvement of flavor and shelf life of roasted
peanuts………94
3.1 Abstract………..95
3.2 Introduction………97
3.3 Materials and Methods………..99
3.4 Results and Discussion ………110
3.5 Conclusions ……….…118
List of Tables
Table 1.
Lexicon of peanut flavor descriptors………..30
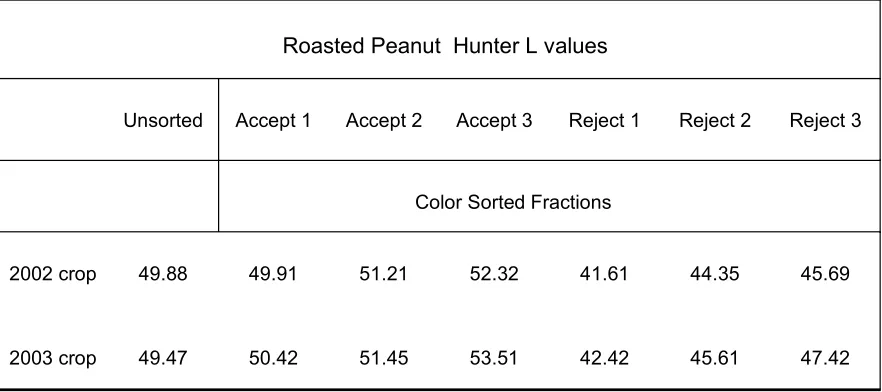
Table 2.1.Mean Hunter L values of roasted peanuts of unsorted and color sorted accept and reject fractions of 2002 and 2003 fruity fermented lots ………...75
Table 2.2. Moisture and oil characteristics of 2002 fruity fermented lot …………..79
Table 2.3. Moisture and oil characteristics of 2003 fruity fermented lot…………...80
Table 2.4. Fatty acid composition of 2002 fruity fermented lot……….81
Table 2.5. Fatty acid composition of 2003 fruity fermented lot……….…………...82
Table 2.6. Composition of various sugars of 2002 fruity fermented lot………83
Table 2.7.Composition of various sugars of 2003 fruity fermented lot………84
Table 2.8. Mean Intensity score of flavor descriptors of 2002 fruity
fermented lot………..88
Table 2.9. Mean intensity score of flavor descriptors of 2003 fruity
Table 2.10. Mean intensity score of flavor descriptors of 2002 unsorted and
accepts in storage ….………91
Table 3.1. Mean Hunter L values of unsorted and color sorted accepts and rejects. ………..129
Table 3.2. Moisture and oil characteristics of all samples ……….….131
Table 3.3. Fatty acid composition of all samples ………132
Table 3.4. Composition of various sugars for all samples………..….133
Table 3.5. Mean intensity scores of flavor descriptors of unsorted and color sorted accepts in storage...….134
List of Figures
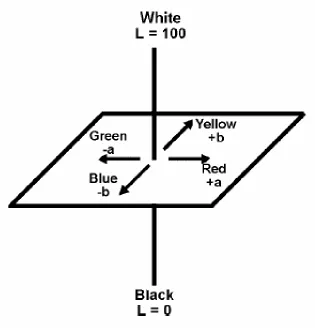
Figure 1. Hunter Lab color system ………32
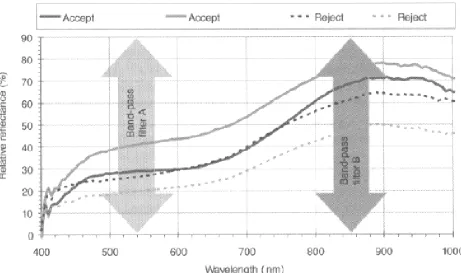
Figure 2. Spectral curves in bichromatic sorting. ………..33
Figure 3. Schematic layout of a typical color-sorting machine ……….34
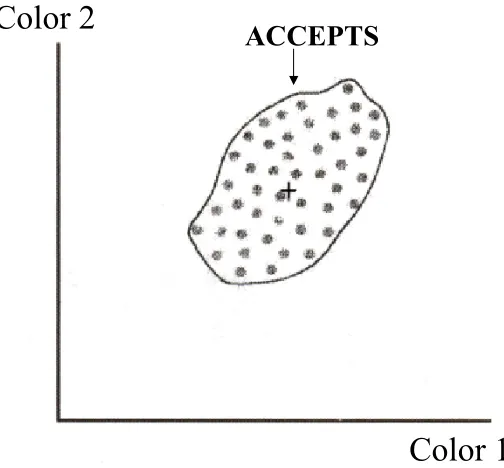
Figure 4. A bichromatic color map representing the distribution of color 1 versus
color 2 ……….35
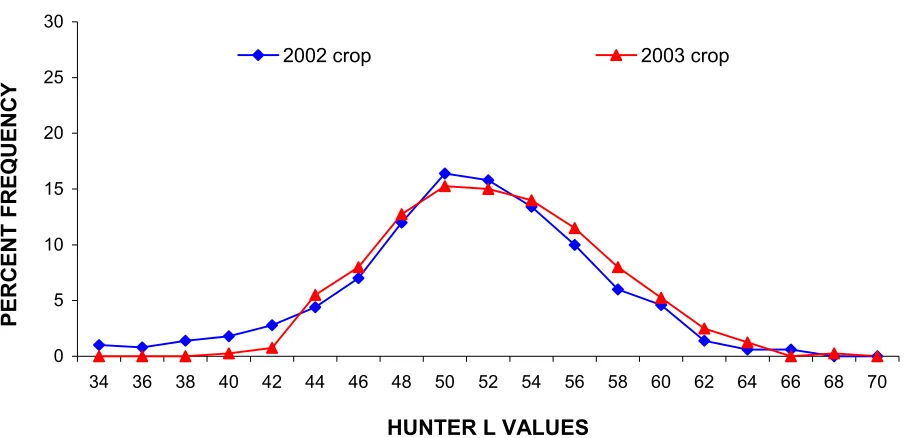
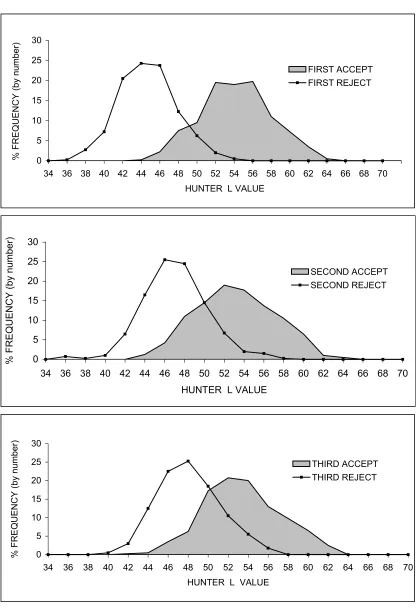
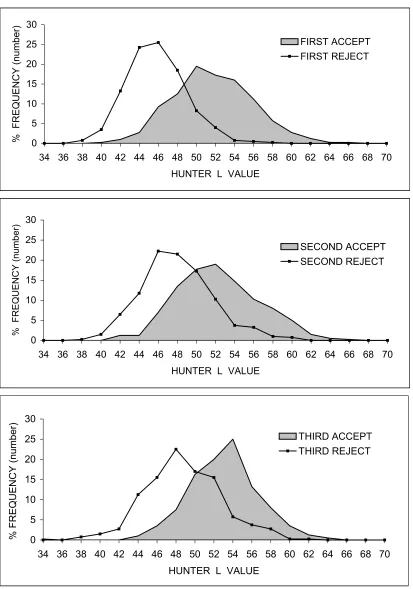
Figure 2.1. Single seed color distribution of 400 randomly picked roasted peanuts of 2002 and 2003 fruity fermented lots………..73
Figure 2.2.Weight % of color sorted accepts and rejects of 2002 and 2003
fruity fermented lots at three color sorter sensitivity levels ………..74
Figure 2.3. A visual representation of the unsorted and the color sorted accepts
and rejects produced by color sorting of the 2003 peanut lot………76
Figure 2.4. Single seed color distribution of 400 randomly picked seeds from
the first, second and third accepts and rejects of the 2002 fruity fermented lot …...77
Figure 2.5. Single seed color distribution of 400 randomly picked seeds from
Figure 2.6. Intensity of roast peanutty flavor and fruity fermented off-flavor in unsorted and accepts of 2002 fruity fermented lot………..85
Figure 2.7. Intensity of roast peanutty flavor and fruity fermented off-flavor in Unsorted and accepts of 2003 fruity fermented lot ………...86
Figure 2.8. Intensity of dark roast and bitter flavors in the unsorted and
color sorted fractions of 2003 fruity fermented peanut lot ……….87
Figure 2.9. Mean intensity scores during storage for roast peanutty, fruity fermented and painty flavors in the unsorted and accept samples
in storage of 2002 peanut lot ……….…………..90
Figure 2.10. PV and OSI values of 2002 fruity fermented lot in storage………...92
Figure 2.11. PV and OSI values of 2003 fruity fermented lot………93
Figure 3.1.Single seed color distribution of 400 randomly picked
roasted peanuts………127.
Figure 3.2. Weight of color sorted accepts and rejects produced by color
sorting roasted peanuts at three color sorter sensitivity levels………..128
Figure 3.3. Single seed color distribution of 400 randomly picked peanuts from the first, second and third accepts and the corresponding rejects
Figure 3.4. Changes in intensity of roast peanutty, painty and cardboardy
flavor attributes of the unsorted and accepts during storage………….………136
CHAPTER 1
1.1 Brief History of Arachis hypogaea L.
The peanut (Arachis hypogaea L.) is one of the oldest and most important food legumes in the world (Ory and Flick, 1991). It is an annual herb of the Leguminosae family and is indigenous to the Andes in South America. Preserved fruits of the peanut dating back to 750 B.C. have been recovered from the Peruvian coast (Hammons, 1982).
Peanuts were cultivated in the West Indian Islands, Mexico, Brazil and the Rio de la Plata basin including Argentina, Paraguay and Bolivia (Hammons, 1982). Early Spanish and Portuguese explorers wrote a historical account of the peanut in 1527 and were responsible for disseminating the peanut to Europe,Africa, Asia and the Pacific Islands (Hammons, 1982). Peanuts reached the colonial coast of North America from Africa via the slave trade route between 1707 and 1725 (Hammons, 1982).
1.2 The Peanut Industry
Peanut production, concentrated in the southeastern and southwestern regions of the United States, generates an annual crop value of about $700 million (ERS/USDA, 2002). The direct consumption of peanuts is about 70 percent of the total domestic use. Shelled peanuts include those used for peanut butter (about 45 percent of peanut food use), snack peanuts (23 percent), and peanut candy (21 percent). Roasted in-shell peanuts account for about 9 percent of U.S. peanut food use. The proportion of peanuts crushed for animal feed and vegetable oil is small, especially when compared with other oilseeds (e.g., soybeans). Lower quality peanuts used for crushing make up only 18 percent of domestic consumption. Seed and residual uses account for the remaining 12 percent (ERS/USDA, 2002).
demand. U.S. peanut consumption has turned around since 1995 as food use rose almost without interruption to a projected record of 2.34 billion pounds in 2001/02. Some observers have attributed it to reduced concern about fat in foods, a growing awareness of studies linking peanut consumption to improved health, the introduction of new products (e.g., flavored in-shell peanuts), and increased retail promotion by peanut product manufacturers and industry associations (ERS/USDA, 2002).
The most common variety, runners, accounts for about three-quarters of U.S. peanut production and is used mainly to make peanut butter (52 percent of runners in 2000/01) but also in peanut candy (26 percent) and as snack peanuts (20 percent). The large, high-quality virginia peanuts account for about 15 percent of domestic production and are more favored as snack peanuts (e.g., roasted in-shell peanuts and salted or honey-roasted peanuts). Spanish peanuts, with smaller kernels and higher oil content, are used mainly in peanut candies. The least common, valencias, also have small kernels and are known for their sweetness. They are produced almost exclusively in New Mexico, and are usually roasted and sold in the shell. Peanut production is concentrated in a small number of states and is a key contributor to local economies. Virtually all peanut production takes place in just nine states in three regions: the Southeast (Georgia, Alabama, Florida, and South Carolina), with 55 percent of national production; the Southwest (Texas, Oklahoma, and New Mexico), with 30 percent; and the Virginia-North Carolina region, with 15 percent (ERS/USDA, 2002).
1.3 Composition
that peanut composition affects peanut quality and shelf life. (Sanders et al., 1989a, b;Pattee
et al., 1989; Pattee et al., 1990; Sanders et al., 1990).
High oil and protein content and lower percentages of carbohydrates and ash characterize peanut composition. In the four major market types (runner, virginia, valencia and spanish) total oil content was found to vary from 44–56 % (Pancholy et al., 1978; Hoffpauir, 1953; Cobb and Johnson, 1973; Holaday and Pearson, 1974; Ahmed and Young, 1982). Peanut oil has low viscosity, a light yellow color and slightly nutty taste. Conditions of maturity, variety and local environmental conditions influence the oil content. Rapid changes in oil percentage were found to occur in early maturity stages (Sanders, 1980 a; Sanders et al., 1982). Apparently there are no studies which indicate a direct correlation between the amount of oil in peanuts and their shelf life but many studies have indicated a positive correlation of oil content with maturity which in turn is associated with flavor and shelf life (Ahmed and Young, 1982; Pattee et al., 1974; Sanders, 1980; Hinds, 1995; Sanders
The protein content of peanuts ranges from 22-33 % with an average of about 25 % (Hoffpauir, 1953; Pattee et al., 1982; Ahmed and Young, 1982). Production location affects the total protein and oil content (Holaday and Pearson, 1974). Peanuts also contain about 4.0 % starch and 2.0-5.0 % of sucrose (Hoffpauir, 1953). Lower concentrations of glucose, fructose, raffinose and stachyose are also present (Pattee et al., 1982). Peanuts contain approximately 50 % moisture at the time of harvest. During windrow curing or field drying the moisture content is generally reduced to about 20 %. Subsequently, peanuts are
mechanically cured or dried with heated air to further reduce the moisture content to 8-10 %. Pattee et al., (1982) suggested that with increased moisture content, protein and starch hydrolysis could significantly change peanut composition.
Other important peanut components include minerals such as calcium, magnesium, phosphorous, sodium, potassium, iron, copper, zinc and manganese and vitamins A, B, C and E (Ahmed and Young, 1982).
Peanut maturity has consistently been shown to be crucial in determining chemical composition, grade and oil stability (Young et al., 1972; Young et al., 1974; Pattee et al., 1974; Basha et al., 1976; Sanders et al., 1982; Sanders et al., 1989b).
1.4 Maturity
visually predicting the optimum harvest date for maximum yield. It is a non-destructive maturity classification based on the changes in color and structure of the pod mesocarp. With maturation the pod mesocarp changes through white, yellow, orange, brown and black color. After abrasive removal of the exocarp peanuts of these various colors are placed on a
maturity profile board and the optimum harvest date is determined (Williams and Drexler (1981). Sanders et al. (1989 b) showed that the correlation between maturity and peanut size is not absolute but maturity differences are most apparent in large versus small peanuts. Because the size-maturity relationship is not absolute peanuts of different maturities are sized together during shelling (Mc Neill and Sanders, 1996). Therefore, each commercial size category contains peanuts from each maturity class. Research by Pattee et al. (1974, 1982) and Sanders et al. (1987, 1989 a, b) showed that the degree of maturation influences the biochemical composition and the overall quality regardless of the size of peanuts. The relative percentages of peanuts of each maturity class in a given commercial size influence lot characteristics such as storability, roast color variation, flavor/off-flavor potential and other quality characteristics related to seed maturity (Sanders et al., 1980 a, b; 1989 a, b; Bett and Boylston, 1992; Sanders & Bett, 1995; McNeil & Sanders, 1998). Sanders et al. (1982) demonstrated compositional dissimilarities among the different maturity stages. Lipids, proteins and sugars in immature peanuts are not compositionally or structurally at the state of metabolic quiescence indicative of maturity (Basha et al., 1976; Pattee et al., 1974; Sanders
1.5 Harvest
Harvesting refers to the operations necessary for the removal of peanut pods from the soil. The timing of harvest is critical since it greatly impacts the yield and grade and therefore the dollar value of the crop (Dickens and Pattee, 1973; Sanders and Williams, 1978; Pattee et al., 1980; Sanders et al., 1980; Williams and Drexler, 1981; Sanders and Bett, 1995). Only a narrow window of time exists for harvest where total crop yield is high and losses are minimized (Pattee and Young ,1982). Optimum harvest time ensures more mature pods, which results in higher percentages of mature seed in commercial grade sizes. The yield in an early harvest has a higher percentage of immature pods and a very late harvest incurs a greater loss of mature pods: both conditions affect the overall quality of harvested peanuts (McNeill, 1996).
1.6 Curing
After peanuts are harvested, the curing process begins. The term curing includes biochemical changes as well as reduction of moisture content to preserve quality (Dickens and Pattee, 1973). Freshly harvested peanuts are subjected to windrow and mechanical curing to reduce moisture content on a wet basis, from approximately 50 to 10%. Wet basis
In artificial curing the temperature of the heated air, the relative humidity and the airflow rate controls the efficiency of the drying process. In standard recommended practice, the drying air temperature may be increased up to 95°F (35°C), without exceeding 15°F above the ambient temperature. Thomas et al., (1968) observed that peanuts cured at 49 °C in a forced draft-drying bin were significantly inferior in quality to both bag-cured and field-cured peanuts. They recommended that the airflow rate should be greater or high enough to create a thick drying zone but not so great or high that the exit air remains unsaturated. Maintenance of proper air temperature, airflow and relative humidity during the curing process result in good milling quality, reduced numbers of split kernels and seeds with intact testa (Troegoer, 1982; Chai et al., 1995). Peanuts have been shown to develop off-flavors at air temperatures greater than 95°F (Beasley et al., 1963; Sanders et al., 1989 a).
Sanders et al. (1989 a) investigated the interaction of maturity and curing temperature on descriptive flavor attributes in roasted peanuts. In comparison tomature peanuts,
immature peanuts cured at higher temperatures (above 38°C) were reported to have
decreased intensity for roasted peanutty and sweet aromatic flavor attributes and increased intensity for fruity fermented, painty, sour, and bitter attributes (Sanders et al., 1989 a, b).
1.7 Flavor
In the first step of Maillard browning, a reversible reaction occurs between a reducing sugar, namely glucose, fructose or lactose and an amine to produce glycosylamine (Bemiller and Whistler, 1996). This compound undergoes an Amadori re-arragement and subsequently forms a variety of carbonyl intermediates and flavor compounds (Bailey, 1992). Picket and Holley (1952) first showed that amino-carbonyl reactions produced derivatives of
tetrahydrofuran, ammonia, hydrogen sulfide, and diacetyl with detectable browning and aroma compounds in peanuts. They hypothesized that the two major globulin proteins, arachin and conarchin, along with sucrose were the precursors of peanut flavor. Pickett and Holley (1952) reported 120 ºC as the minimum required temperature for producing flavor compounds. In another study by Mason and Waller (1964), a slightly higher temperature of 132ºC was considered essential for formation of flavor compounds. Mason et al. (1966) identified a pyrrole and several pyrazine compounds as flavor constituents. A previous study by Hodge (1953) showed that pyrazines and pyrroles were produced from heated mixtures of sugars and amino acids. Newell et al. (1967) identified the amino acids responsible for typical and atypical peanut flavor. The authors reported that aspartic acid, glutamic acid, glutamine,asparagines, histidine and phenylalanine were associated with typical peanut flavor while threonine, tyrosine, lysine and an unidentified nitrogen containing compound were precursors of atypical flavor. The volatile components responsible for peanut flavor were also studied by Pattee et al. (1969 a, 1970), Brown et al. (1972), Bett and Boylston (1992) and reviewed by Cobb and Johnson (1973), Pattee and Singleton (1981), Sanders et al. (1982) and Ahmed and Young (1982).
(1967) reported that glucose and fructose were the main reducing sugars, which react with amino acids when peanuts are roasted. Previously, Hodge (1953) showed sucrose as a source of reducing sugars since glucose and fructose are present in very small quantities in peanuts. Mason et al. (1969) confirmed that sucrose was inverted tofructose and glucose during roasting. Mason et al. (1967) suggested other carbonyl compounds as precursors to roasted peanut flavor.
How (1984) and Oupadissakoon and Young (1984) used descriptive analysis
terminology to define flavor attributes associated with peanut variety, handling, roasting and storage. Johnsen et al. (1988) created a descriptive flavor lexicon to describe the desirable and undesirable flavors in peanuts. This lexicon was further expanded by Sanders et al.
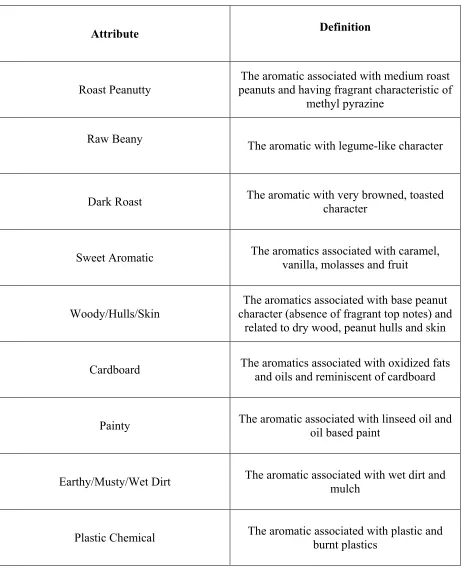
(1989) to include the term fruity fermented.The peanut lexicon mainly consists of three categories: aromatics, tastes and chemical feeling factors (Johnsen et al., 1988) (Table 1). The various descriptors for aromatic attributes include roasted peanutty, raw/beany, dark roast, sweet aromatic and woody/hulls/skins and the off-flavors such as cardboard, painty, earthy/musty, plastic chemical and fruity-fermented. The tastes attributes include the four basic tastes: sweet, sour, salty and bitter and the chemical feeling factors are astringent and metallic. The intensity of all flavor descriptors is evaluatedon a 0-15 point universal reference scale (Meilgaard et al., 1987). The universal scale is an absolute scale, which is constant across all products and attributes.
1.7.1 Fruity Fermented off-flavor
various defects and found that drying temperatures of 120º F caused inferior flavored peanuts. Sanders et al. (1989) compared the effect of three wagon-drying temperatures
(ambient, ambient + 8.4 ºC and ambient + 16.8 º C) on the various maturity stages of peanuts. The more mature peanuts were relatively unaffected by high temperature curing. However, immature peanuts exhibited lower intensities of roasted peanutty and sweet aromatic and higher intensities of fruity fermented, sour and dark roast at higher curing temperatures. The fruity fermented flavor defect originally described as high-temperature curing off-flavor can therefore be defined as the flavor associated with immature and improperly cured peanuts or fermented peanut vegetation flavor which is reminiscent of over ripe / rotten fruits, vegetables or grain (Ory et al., 1992; Pattee et al., 1999). Schenk (1961) found that curing temperatures of 42°C and above caused maximum respiration rates in peanuts. Studies have shown that the process of curing has a significant effect on seed respiration (Whitaker and Dickens, 1964; Whitaker et al., 1974). Rapid respiration was found to reduce oxygen levels inside the peanuts and induce anaerobic respiration. As a result certain volatile
compounds were formed which were assumed responsible for the off-notes. The presence of more volatiles in immature peanuts correlated positively with increased intensity of off-flavor (Whitaker and Dickens, 1964). Young et al., (1982) recommended that curing
temperature should not increase beyond 5 -10 °C above ambient temperature or exceed more than 35°C.
high-that immature peanuts with fruity-fermented off-flavor contained fruit like esters (ethyl 2-methylpropanoate, ethyl 2-methylbutanoate and ethyl 3-methylbutanoate) in addition to higher levels of short chain organic acids (butanoic, 3-methylbutanoic and hexanoic). Sanders et al., (1989 c) and Pattee et al., (1990) showed that fruity fermented intensity was inversely proportional to the roasted peanut attribute in immature virginia and runner type peanuts.
1.8 Shelf-life
Peanut shelf life or stability is generally associated with lipid oxidation. Oxidation may occur via enzymatic or auto-oxidation mechanisms, respectively during storage of raw and roasted peanuts. Fatty acid composition, presence of antioxidants and metals and lipoxygenase activity also influence stability. In raw peanuts the lipoxygenase-catalyzed oxidation reaction is the major cause of off-flavors. However, heat treatments such as roasting effectively inactivate lipoxygenase activity. Therefore auto-oxidation is the primary concern for the shelf life of roasted peanuts. The initiation of auto-oxidation is by the
abstraction of a hydrogen atom adjacent to a double bond in a fatty acid molecule to form alkyl and hydrogen free radicals (Shahidi and Wanasundara, 1998). UV light, metal ions or heat can catalyze the initiation process. In the propagation step, atmospheric oxygen reacts with an alkyl radical to form an unstable peroxy radical. The peroxy free radical can slowly abstract a hydrogen atom from another unsaturated fatty acid molecule to produce
hydroperoxide and a new alkyl free radical. A chain reaction occurs until two radicals combine at termination.
been studied in relation to stability. Manning (2000) studied the effect of O/L ratio on the flavor quality of roasted peanuts during shelf life. It has also been observed that Maillard reaction products produced during peanut roasting have antioxidant activity and decrease lipid oxidation (Franzke and Iwainsky, 1954; Griffith and Johnson, 1957; Alaiz et al., 1995,).
1.9 Roast Color
Roast color significantly affects the quality of peanuts, as it is associated with the development of flavor and aroma during roasting (Morris et al., 1953). The characteristic color results from amino acid-sugar reactions (Hodge, 1953) that intensify with higher roast temperature and prolonged roast time. Caramelization or thermal degradation of sugars also causes browning in roasted peanuts (Mason et al., 1966).
used Hunter L values as a definitive measure of degree of roast and found that immature peanuts in any sized lot acquired a darker roast color than mature peanuts.
1.10 Machine Vision
Computer vision helps to capture, process and analyze images and facilitate an objective, non-destructive assessment of visual quality characteristics in food products (Timmermans, 1998). The potential of computer vision in the food industry has long been recognized (Tillett, 1990) and currently the food industry is ranked among the top 10 industries using this technology (Gunasekaran, 1996). Rapid advances in hardware and software have provided low cost effective solutions and have motivated numerous studies on the application of computer vision systems in the evaluation of the quality of many raw and processed foods (Locht et al., 1997; Sun, 2000). Automated machine vision technology is of substantial benefit in the food industry because it is cost effective, consistent, fast and accurate.
1.10.1 High-Speed Color Sorter
The demand for automatic color sorting machines has increased over the years due to escalating costs of hand sorting and higher quality requirements imposed on food producers. The optical sorting of peanuts is a complex process and in some cases pushes even current technology to its limits. Difficulties arise when the material to be rejected is of similar color or texture to the acceptable product or when defects (such as insect damage) are very small (Bee and Honeywood, 2002). In current color-sorting machines, spectral
be carried out. Two spectral reflectance curves are obtained where one set of data represents the lightest and darkest of acceptable product and the other represents the lightest and darkest of the reject product (Figure 2). Bichromatic sorting involves twice as many optical
components as monochromatic sorting, additional lighting devices and more complex signal processing. Color sorters with this technology can effectively sort a wide variety of colors making it possible to remove darker roasted peanuts within a peanut lot. (Sortex Ltd., 2002).
Equally important to the accuracy of a color sorter is the precision of the ejection system. The ejectors remove the reject product from an incoming stream of product without removing acceptable product. In reality, some acceptable product is always ejected along with the defects so the measure of a good sorter is the concentration of the reject product. The reject product can be re-sorted to retrieve as much good product as possible. (Sortex Ltd., 2002).
1.10.2 Components of the Color Sorter
Color Sorters generally have four principal systems: Feed System, Optical system, Ejection system and Image processing algorithms (Bee and Honeywood, 2002) (Figure 3).
further ensures a controlled trajectory through the inspection and ejection points (Bee and Honeywood, 2002).
The optical inspection system measures the reflectivity of the product. The inspection components are housed within an optical box and the objects under inspection travel either through or past the optical box. Product does not come into direct contact with any part of the optical box and are separated from it by toughened glass windows. The optical system has one or more lenses and detection units depending on the number of directions from which the incoming product is viewed. Most color sorters have two or three cameras, which view the incoming product from different angles. This feature increases the efficiency of the system to identify unwanted product. The optical system also contains lamp units designed to provide even, consistent illumination of the product. The range of wavelengths measured by an optical sorting machine is defined by the choice of the light source, the properties of the optical filters and the properties of the detector. A primary objective of selecting filters and lighting is to obtain the maximum possible signal-to-noise ratio from the detector at the required wavelengths and the minimum possible signal at all other wavelengths (Bee and Honeywood, 2002).
peanut passes the aperture, there is a decrease in signal amplitude and with a lighter roasted peanut there is an increase in the amplitude (Bee and Honeywood, 2002).
The ejection system is capable of physically removing the reject product from the main stream of incoming prooduct. The ejection typically takes place when the product is in free fall. The accept products (desirable end product) continue along their normal trajectory and collect in a receptacle while the reject products (unwanted product) are deflected into another receptacle. The usual method of removing reject products from the main stream is with a blast of compressed air from a high-speed solenoid or piezoelectric valve connected to a strategically positioned nozzle. Pneumatic ejector valves have a rapid, reliable action capability. Ejectors operate at input pressures between 200 to 550 kPa (30 –80 psi)
depending on the size of the product to be removed. Typically the ejection point is located outside the optical inspection area. The accurate timing which is required to coincide the ejector air blast with that of the object to be ejected relies on the fact that the objects have constant velocity as they fall in front of the ejector nozzle (Bee and Honeywood, 2002).
The image processing system classifies the incoming product as either accept or reject on the basis of color. The electronic processing systems in sorting machines are currently equipped with advanced digital microprocessor-based circuits. A sophisticated optical sorter tracks the average color of the product so that even though the average product color may change with time, the machine continues to remove only the pre-defined reject product. Optical sorters are provided with a white calibration plate, which may be manually or
Once a machine is set up for a particular food product all the machine settings can be stored in memory. This way the machine can be made ready to sort anytime simply by recalling the appropriate settings from the memory. Alternatively, the settings can be used as a coarse starting point from which to fine tune the machine towards an optimum setting for a particular set of products (Bee and Honeywood, 2002).
1.10.3 Mapping Techniques
is the principal parameter that can be changed to increase or decrease the amount of reject products (Figure 4) (Bee and Honeywood, 2002).
1.10.4 Limitations of Color Sorting
There is often a misunderstanding that a color sorter can remove 100% of the
unwanted product from a given batch of product. A color sorter reduces the concentration of unwanted product but not with 100% effectiveness. All color sorters remove some acceptable product and fail to remove some of the reject product. This may occur because the color difference of the defect from the streaming incoming product is too small for accurate detection. Occasionally, the machine may detect a defect and remove the unwanted product but it may re-enter the accept stream after it has been ejected as a consequence of random collision. The performance and position of the ejectors can also become a limiting factor for accurate ejection of the unwanted product. Increasing the sensitivity of the color sorter results in rejection of more undesirable product; however, a greater proportion of good product will also be rejected as the sensitivity threshold approaches the average product color. Also, if the incoming product is not in a monolayer, the food product can overlap and sorting
performance can deteriorate causing rejects to pass undetected by the optical system.
1.11 References
Ahmed, E. M. and Young, C. T. 1982. Composition, quality and flavor of peanuts. In: H. E. Pattee and Young, C.T. (Eds.). Peanut Science and Technology. Amer. Peanut Res. and Educ. Soc. Inc., Yoakum, TX, USA, 655–688.
Alaiz, M., Zamora, R. and hidalgo, F.J. 1995. Antioxidative activity of (E)-2 octenal/amino acids reaction products. J. Agric. Food Chem. 43, 795- 800.
Bailey, M.E., Won Um, Ki. 1992. Maillard Reaction Products and Lipid Oxidation. In St. Angelo (Ed.) Lipid Oxidation in Food. Washington, D.C. Amer. Chem. Soc. 122-139.
Basha, S. M. M., Cherry, J.P., Young, C. T. 1976. Changes in free amino acids,
carbohydrates and proteins of maturing seeds from various peanut (Arachis hypogaea L) cultivars. Cereal Chem. 53, 586-597.
Beasley, E. O. and Dickens, J. W. 1963. Engineering Research in Peanut Curing. N C Exp. Sta. Technol. Bull. No. 155.
Bee, S.C. and Honeywood, M.J. 2002. Color Sorting for the bulk food industry.
In:Colour in Food: Improving Quality. MacDougall D.B. (Ed.), Food Science and Tech. 6, 115-142.
BeMiller, J. N. and Whistler, R. L. 1996. Carbohydrates. In: O. R. Fennema (Ed.), Food Chemistry 3rd ed. 157-223. New York, NY: Marcel Dekker, Inc.
Bett, K. L. and Boylston, T. D. 1992. Effect of storage on roasted peanut quality. In: St. Angelo (Ed), Lipid Oxidation in Food, 322-343. Washington D. C: American Chemical Society.
Buckholz, L. L., Daun, Jr. H., Stier, E. and Trout, R. 1980. Influence of roasting time on sensory attributes of fresh roasted peanuts. J. Food Sci. 45, 547–554.
Chai, L. and Young, J. H. 1995. Simulated airflow rate effects on drying times and costs for conventional and recirculating peanut drying facilities. Peanut Sci. 22, 8-14.
Cobb, W. Y. and Johnson, B. R. 1973. Physiochemical properties of peanuts. In : Peanuts- Culture and Uses. Amer. Peanut Res. and Educ. Assoc. Stone Printing Co., Roanoke, VA. 213, 217, 246-251
Dickens, J. W. and Pattee, H. E. 1973. Peanut curing and post-harvest physiology. In Peanuts- Culture and Uses. Amer. Peanut Res. and Educ. Assoc. Stone Printing Co., Roanoke, VA. 509-514.
Didzbalis, J., Ritter, K. A., Trail, A. C. and Plog, F. J. 2004. Identification of
Fruity/Fermented Odorants in High-Temperature-Cured Roasted Peanuts. Masterfoods USA, 800 High Street, Hackettstown, New Jersey 07840
ERS-USDA. 2002. http://www.ers.usda.gov/publications/agoutlook/Mar2002/ao289a.pdf
Ferreira, V. L. P., Fernandes, S. V., and Yotsuyanagi, K. 1994. The color of chicken and pork meat loaf with added cured bovine blood as evaluated by the Rab, Hunter Lab, L*, a*, b* and XYZ CIE systems. 34, 311–322.
Fore, S.P., Morris, N. J., Mack, C.H., Freeman, A.F. and Bickford, W.G. 1953. Factors affecting the stability of crude oils of 16 varieties of peanuts. J. Amer. Oil Chem. Soc., 30, 298-301.
Griffith, T. and Johnson, J.A. 1957. Relation of the browning reaction to storage stability of sugar cookies. Cereal Chem. 34, 159-169.
Hammons, R. O. 1982. Origin and early history of the peanut. In: H. E. Pattee and C. T. Young (Eds.), Peanut Science and Technology. 486-519. Yoakum, TX: American Peanut Research and Education Society, Inc.
Hinds, M. J. 1995. Fatty acid composition of Caribbean-grown peanuts (Arachis hypogaea L.) at three maturity stages. Food Chem.53, (1), 7-14
Hoffpauir, C. L. 1953. Journal of Agricultural Food Chemistry. 1, 668
Holaday, C. E., and Pearson, J. L. 1974. Effects of genotype and production area on the fatty acid composition, total oil and total protein in peanuts. J. Food Science. 39, 1206-1209.
Hodge, J.E. 1953. Dehydrated Foods: chemistry of browning reactions in model system. J. Agric. Food Chem. 1, 928-943.
Hoffpauir, C.L. and Guthrie, G.D. 1945. Chemical composition of peanuts: A literature review. Peanut J. Nut World. 24 (6), 26-30.
How, J. S. L. 1984. Effects of variety, roasting, modified atmosphere packaging and storage on the chemical composition, headspace volatile and flavor profiles of peanuts. Ph. D. Thesis. North Carolina State University, Raleigh, NC.
Hunter lab 2001. Available at: www.hunterlab.com
Lansden, J.A., Sanders, T.H. and Vercellotti, J.R. 1988. Effect of the degree of roasting on the production of pyrazines in Florunner peanuts. Proc. Am. Peanut Res. Educ. Soc. 20, 46.
Leunissen, M., Davidson, V.J., Kakuda, Y. 1996. Analysis of volatile flavor components in roasted peanuts using supercritical fluid extraction and gas chromatography-mass spectrometry. J. Agric. Food Chem. 44, 2694-2699.
Locht, P., Thomsen, K. and Mikkelsen, P. 1997. Full color image analysis as a tool for quality control and process development in the food industry. In: 1997 ASAE Annual International Meeting, Paper No. 973006, ASAE, St. Joseph, Michigan, USA.
Mason, M.E. and Waller, G.R. 1964. Isolation and localization of the precursors of roasted peanut flavor. J. Agric. Food Chem. 12, 274-278.
Mason, M.E., Johnson, B. and Hamming, M. 1966. Flavor components of roasted peanuts: Some low molecular weight pyrazines and a pyrrole. L. Agric. Food Chem. 14, 454-460.
Mason, M. E., Johnson, B. R., & Hamming, M. C. 1967. Volatile components of roasted peanuts: The major monocarbonyls and some non-carbonyl components. J. Agric. and Food Chem.15, 66-73.
Mason, M.E., Newell, J.A., Johnson, B.R., Koehler, P.E., and Waller, G.R. 1969. Non-volatile components of peanuts. J. Agric. Food Chem. 728-732.
Mc Neil, K.L. and Sanders, T.H. 1996. Pod and seed relation to maturity and in-shell quality potential in Virginia-type peanuts. Peanut Sci. 23, 133-137.
McNeil, K. L. and Sanders, T.H. 1998. Maturity effects on sensory and storage quality of roasted Virginia-type peanuts. J. Food Sci. 63, (2), 366-369
Newell, J. A., Mason, M. E., Matlock, R. S. 1967. Precursors of typical and atypical roasted peanut flavor. J. Agric. and Food Chem., 15, (5), 767-772.
Ory, R.L. and Flick, Jr., G.J. 1991. Peanut and Cottonseed Proteins for Food Uses. In: Progress in Food Proteins- New and Developing Sources. Hudson, B.F.J. (Ed.). Elsevier Applied Science. London.
Ory, R. L., Crippen, K.L. and Lovegren, N.V. 1992. Off-flavors in peanuts and peanut products. In: G. Charalambous (Ed). Off-flavors in Food and Beverages. Elsevier Publishing Co., Amsterdam, The Netherlands.
Oupadissakoon, C. and Young, C. T. 1984. Modeling of roasted peanut flavor for some Virginia-type peanuts from amino acid and sugar contents. J. Food Sci. 49, 52-58.
Pancholy, S. K., Despande, A. S. and Krall, S. 1978. Amino acids, oil and protein content of some selected peanut cultivars. Proc. Am. Peanut. Res. Educ. Assoc. 10, 30-37.
Pattee, H. E., Beasley, E. O., and Singleton, J. A. 1965. Isolation and identification of volatile components from high-temperature-cured off-flavor peanuts. J. Food Science. 38, 388-392
Pattee, H. E., J. A. Singleton and Cobb, W.Y. 1969. Volatile components of raw peanuts: analysis by gas-liquid chromatography and mass spectrometry. J. Food Sci. 34,625-627
Pattee, H. E., Purcell, A. E., and Johns, E. B. 1969. Changes in carotenoid and oil content during maturation of peanut seeds. J. Amer. Oil Chem. Soc. 46, 629-631.
Pattee, H. E., J. A. Singleton, E. B. Johns and Mullin, B.C. 1970. Changes in the volatile profile of peanuts and their relationship to enzyme activity levels during maturation. J. Agric. Food Chem. 18,353-356.
Pattee, H. E. and Singleton, J. A. 1981. Peanut Quality: Its relationship to volatile compounds- A review. In : Quality of Fruits and Vegetables in North America. ACS Symposium Series 170. Teranishi, R., (Ed.). Amer. Chem. Soc.Washington, DC, 147-161.
Pattee, H. E. and Young, C.T. 1982. In H. E. Pattee and C. T. Young (Eds.) Peanut Science and Technology. Amer. Peanut Res. & Ed. Soc., Yoakum, TX.
Pattee, H. E., Yokoyama, M. F. Collins, M. F. and Giesbrecht, F. G. 1990.
Interrelationships between headspace volatile concentration, marketing grades, and flavor in runner-type peanuts. J. Agric. Food Chem. 38,1055-1060.
Pattee, H. E., Giesbrecht, F. G. and Young, C. T. 1991. Comparison of peanut butter color determination by CIELAB L*a*b* and Hunter Color Difference methods and the relationship of roasted peanut color to roasted peanut flavor response. J. Agric. Food Chem. 39, 519-523.
Pattee, H. E., Giesbrecht, F. G and Isleib, T. G. 1999. Sensory attribute variation in low-temperature-stored roasted peanut paste. J. Agric. & Food Chem. 47, 2415-2420.
Pickett, T.A. and Holley K.T. 1952. Peanut roasting studies. Ga., Agric. Expt. Stn. Tech. Bull. 1, 1-36.
Sanders, T.H. and Williams, E.J. 1978. Comparison of four peanut maturity methods inGeorgia. Proc. Amer. Peanut Res. Educ. Assoc. 10, 11-15.
Sanders, T. H. 1980 a. Effects of variety and maturity on lipid class composition of peanut oil. J. Am. Oil Chem. Soc., 57, 8-11.
Sanders, H. T., Landsen, J. A., Greene, R. L., Drexler, J. S. and Williams, E. J. 1982. Oil characteristics of peanut fruit separated by a non-destructive maturity classification method. Peanut Sci 9, 20-23.
Sanders, T. H., Vercellotti, J. R., and Civille, G. V. 1987. Flavor maturity relationship of Florunner peanuts. Proc. Am. Peanut Res. Educ. Sco. 19:42. (Abstr).
Sanders, T. H.; Vercellotti, J. R.; Crippen, K. L.; Civille, G. V. 1989 a. Effect of maturity on roast color and descriptive flavor of peanuts. J. Food Sci., 54, (2), 475-477.
Sanders, T. H. 1989 b. Maturity distribution in commercially sized florunner peanuts. Peanut Science, 16, 91-95.
Sanders, T. H.; Vercellotti, J. R.; Blankenship, P. D.; Crippen, K. L. and Civille, G. V. 1989 c. Interaction of maturity and curing temperature on descriptive flavor of peanuts. J. Food Science. 54, 1066-1069.
Sanders, T.H., Blankenship, P.D., Vercellotti, J.R. and Crippen, K.L. 1990. Interaction of curing temperature and inherent maturity distributions on descriptive flavor of
commercial grade sizes of Florunner peanuts. Peanut Sci. 17, 85-89.
Sanders, T.H., Vercellotti, J.R. and Grimm, D.T. 1993. Shelf-life of peanuts and peanut products. In: The Shelf –Life Studies of foods and beverages- Chemical, Biological, Physical and Nutritional Aspects. G. Charalambous (ed.) Elsevier Science Publ. Amsterdam, The Netherlands. 289-308.
Sanders, T. H.; Bett, K. L. 1995. Effect of harvest date on maturity, maturity distribution, and flavor of florunner peanuts. Peanut Sci. 22, 124-129.
Shahidi, F. and Wanasundara, U. D. 1998. Methods of measuring oxidative rancidity in fats and oils. In : C.C. Akoh and D. B. Min (Eds.), Food Lipids. 377-396. New York: Marcel Dekker, Inc.
Singleton, J. A., Pattee, H. E. and Johns, E. B. Influence of curing temperature on the volatile components of peanuts. J. Agric. Food Chem. 1971, (19), 130-133.
Sun, D. W. 2000. Inspecting pizza topping percentage and distribution by a computer vision method. J. Food Eng. 44, 245–249.
Thomas, M.C., Lyman, C.M., Langley, B.C. and Senn, V.J. 1968. Some factors that affect quality in peanut products as determined by organoleptic evaluation. Food technol. 22 (11), 1442-1447.
Tillett, R.D. 1990. Image analysis for agricultural processes Division Note DN 1585. Silsoe Research Institute.
Timmermans, A. J. M. 1998. Computer vision system for online sorting of pot plants based on learning techniques. Acta Horticulturae 421, 91–98.
Troeger, J. M. 1982. Peanut drying energy consumption - a simulation analysis. Peanut Sci. 9, 40-44.
Schenk, R. V. 1961. Respiration of the curing peanut fruit. Crop Sci.1, 162-165.
Whitaker, T. B. and Dickens, J. W. 1964. The effects of curing on respiration and off-flavor in peanuts. Proc. Third Nat. Peanut Res. Conf. Auburn Univ. Auburn, AL. 71.
Williams, E. J. and Drexler, J. S. 1981. A nondestructive method for determining peanut pod maturity. Peanut Sci. 8, 134-141.
Williams, E. J., Ware, G. O., Lee, J. Y. and Drexler, J. S. 1987. Effect of pod maturity and plant age on the seed size distribution of Florunner peanuts. Peanut Sci. 14, 79-83.
Woodroof, J. G. 1983. Peanuts: Production, Processing and Products 3rd ed. Westport, CT: AVI Publishing Co.
Young, C. T., Mason, M. E., Matlock, R. S., and Waller, G. R. 1972. Effect of maturity on the fatty acid composition of eight varieties of peanuts grown at Perkins, Oklahoma in 1968 J. Am. Oil Chem. Soc. 49: 314
Young, C. T., Matlock, R. S., Mason, M. E., and Waller, G. R. 1974. Effect of harvest date and maturity upon free amino acid levels in three varieties of peanuts. J. Am. Oil. Chem. Soc. 51, 26-273.
Table 1. Lexicon of peanut flavor descriptors
Attribute Definition
Roast Peanutty
The aromatic associated with medium roast peanuts and having fragrant characteristic of
methyl pyrazine Raw Beany
The aromatic with legume-like character
Dark Roast The aromatic with very browned, toasted character
Sweet Aromatic The aromatics associated with caramel, vanilla, molasses and fruit
Woody/Hulls/Skin
The aromatics associated with base peanut character (absence of fragrant top notes) and
related to dry wood, peanut hulls and skin Cardboard The aromatics associated with oxidized fats and oils and reminiscent of cardboard
Painty The aromatic associated with linseed oil and oil based paint
Earthy/Musty/Wet Dirt The aromatic associated with wet dirt and mulch
Attribute Definition
Metallic described as flat, metallic and associated with The chemical feeling factor on the tongue iron and copper
Fruity Fermented The aromatic associated with over ripe fruit or fermented vegetation
Sweet The taste associated with sugars
Sour The taste associated with acids
Salty The taste associated with sodium ions
Bitter The taste associated with bitter agents as caffeine or quinine
Color 2
Color 1
ACCEPTS
+
CHAPTER 2
REDUCTION OF FRUITY FERMENTED OFF-FLAVOR BY COLOR SORTING OF
2.1 Abstract
All big peanuts are not mature and all small peanuts are not immature because of the indeterminate flowering habit of the peanut plant. The relative percentages of peanuts from each maturity class influence lot characteristics such as flavor/off-flavor potential, roast color variation and storability. Peanuts from immature classes roast darker and have potential for more fruity fermented off-flavor and less roast peanutty flavor than mature peanuts of the same size. In 2003, peanuts from many West Texas locations were found to contain unusually high fruity fermented off-flavor characteristic presumably because of drought conditions during maturation (June –August), which delayed maturation and high temperatures (>35°C) during harvest (October).
The objective of this study was to determine the effectiveness of high-speed color sorting for reduction of fruity fermented off-flavor in roasted peanuts.
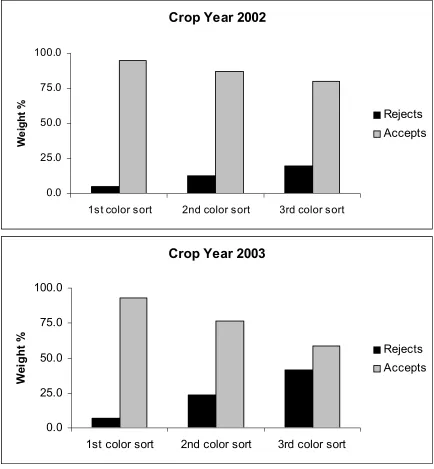
Peanuts of Flavor Runner-458 var. from 2002 and 2003 crop years identified to have fruity fermented off-flavor were roasted to a Hunter L of 50 ± 1 and color sorted to remove successively higher percentages (5-40 %) of darker peanuts (rejects) from the lighter peanuts (accepts). A highly trained descriptive sensory panel evaluated the unsorted and the color sorted fractions for all peanut flavor attributes. Statistical analysis (p<0.0001) indicated that the highest score (3.1) for fruity fermented off-flavor and lowest score (3.7) for roast
from 2.40 (unsorted) to 0.48 (third accept) in the 2002 crop and from 2.76 (unsorted) to 0.41 (third accept) in the 2003 crop resulted from color sorting.
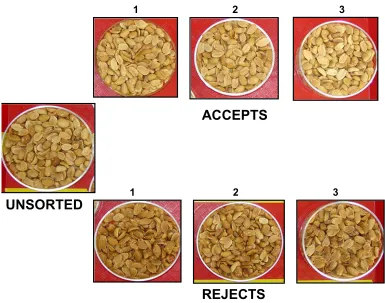
Analysis of peanuts from the 2002 crop demonstrated that removal of dark peanuts (5-20 %) did not significantly improve the shelf life of the lighter colored peanuts possibly due to the high O/L ratio of this variety. Chemical analysis demonstrated that the first ‘reject’ with 5-7% of darkest peanuts from both 2002 and 2003 crops had significantly lower oil content (45-46%), higher free fatty acid (0.22-0.26 %) and lower O/L ratio (11.48-11.58). This suggests that peanuts with relative higher immaturity are less mature in their
biochemical composition.
The results indicated that fruity fermented off-flavor decreased with successively higher percentage removal of darker-roasted, immature peanuts. High–speed color sorting technology provides a method of remediation of peanuts, which have fruity fermented off-flavor.
2.2 Introduction
The unique flavor of roasted peanuts is the basis for the multi-billion dollar peanut industry. Consumers have become more stringent in their demand for high quality peanuts free of chemical residues, toxins and undesirable flavors (American Peanut Council, 2003, Sanders et al., 1989 a). The overall sensory quality of roasted peanuts is described by intensities of desirable flavors such as roasted peanutty and sweet aromatic or undesirable off-flavors such as fruity fermented, painty and bitter (Johnsen et al., 1988). Flavor and quality of roasted peanuts are influenced by a multitude of complex interacting factors. There are uncontrollable factors such asenvironmental conditions, seed maturity, seed composition and the field-curing process that may cause the flavor quality of the peanuts to vary outside acceptable ranges (Bland and Lax, 2000; Sanders et al., 1982, 1989 a, b; Pattee et al., 1974, 1981).
The peanut plant has an indeterminate flowering habit, which results in pods of various maturities at optimum harvest (Sanders, 1989 b). According to Sanders (1989 b) the peanut size-maturity relationship is not absolute and peanuts of different maturities may be commercially sized together. Total oil, protein and carbohydrate composition change with maturity (Mason et al., 1969; Oupadissakoon and Young, 1984; Sanders, 1980 a; Sanders et al. 1982). Maturity differences are perhaps most apparent in large vs. small peanuts (Pattee
peanutty flavor and are more likely to develop fruity–fermented off flavor notes (Sanders et al., 1989).
During curing, the moisture level of peanuts is reduced from about 50% in freshly dug peanuts to approximately 10% before storage. Harvested peanuts are subjected to field drying and mechanical drying, or a combination of both. The production of off-flavor due to curing methods has been the focus of research since the development of artificial drying techniques in the early 1950s. Bailey and co-workers (1954) and Beasley and Dickens (1963) showed that the high temperature curing off-flavor produced in immature peanuts was
significantly higher at temperatures in excess of 35 °C. The study by Whitaker and Dickens (1964) proved that high-temperature curing caused oxygen depletion and induced anaerobic respiration in peanuts. High temperature curing off-flavor or fruity fermented off-flavor occurred as a result of anaerobic respiration (Beasley and Dickens; 1963, Whitaker and Dickens; 1964, Whitaker et al., 1974). Pattee et al., (1965), Singleton et al., (1971) and Sanders and co-workers (1989) found similar sensory results. Didzbalis et al., (2004) identified compounds that caused the fruity fermented off-flavor as fruity esters and short chain organic acids in addition to others like ethanol, ethyl acetate, formaldehyde, acetone, butanal, hexanal and acetaldehyde.
The objectives of this study were to remove increasingly higher percentages of darker roasted peanuts from medium grade size peanut lots and evaluate the flavor, shelf life and chemical composition of the color sorted peanuts to provide important information on high speed color sorting technology that can be implemented for the remediation of fruity fermented peanut lots.
2.3 Materials and Methods
2.3.1 Preparation
Peanut Source
Two fruity fermented lots of Flavor Runner 458 var.(Arachis hypogaea L.) were obtained from the 2002 and 2003 crop years, from West Texas. All the peanuts were medium commercial grade size having width less than 8.3 mm but greater than 7.1 mm.
Storage
Peanuts were stored at a temperature of 7.0 ± 0.2 ° C and relative humidity of 69.0 ±
0.2% in tight-lid plastic storage containers.
Peanut Roasting
Sortex 3000 Color Sorter
All roasted peanuts were color sorted using a Sortex 3000 color sorter (Figure 3). The Sortex 3000 was particularly suited for sorting low volumes of high-value commodities, since the output and efficiency of the machine is very high (Sortex Ltd., 2002). The feed system had an inclined chute, which aligned the peanuts and ensured that the product passed through the machine at a constant speed. The optical system (CCD camera technology) combined with fast, precise ejectors segregated darker roast colored peanuts from the lighter ones. The sorter had two single channels and three sensors surrounding each channel. 3 cameras set at 120° to each other, providing an all-round view, inspected a single row of roasted peanuts. The Sortex 3000 employed a bi-chromatic sorting method, which compared the intensity of light reflected in 2 of the primary wavebands (red/green or red/blue). This allowed the camera to discriminate by color as well as by intensity (Bee and Honeywood, 2002). The intensity of the light reflected off each peanut was measured allowing those that appeared darker than normal (average Hunter L value = 50) to be identified as a reject product. The ejector used short blasts of compressed air to remove the undesirable peanuts (rejects) from the main stream of peanuts. The accepts and the rejects were collected into separate receptacles. The color sorting capacity of the machine was approximately 600 kg of peanuts per hour (Sortex Ltd, 2002).
Color Sorting
was color sorted to remove progressively higher percentage of dark peanuts. The sensitivity parameter for color sorting the first lot was adjusted to remove 5-7 % by weight of the darkest colored peanuts to form the first reject and a corresponding fraction of lighter peanuts, the first accept. It was essential to have 7-10 lbs. of each reject and accept sample for the purpose of experimental analyses. Sensitivity of the machine was increased by approximately 10-15 % and 25-30 % in color sorting of the next two lots to increase the percentage of dark peanuts rejected. Color difference between the accepts and the
corresponding rejects were determined with a Hunter L colorimeter after each sort. Single seed color of randomly selected 400 peanuts from the unsorted roasted peanuts wasanalyzed. A preliminary sensory test evaluated the intensity of fruity fermented off-flavor in the color distribution of the unsorted peanuts. This helped to ascertain the sensitivity level of color sorting in the three sub lots.
Before color sorting the peanut lots, the color sorter was calibrated with hand sorted roasted peanuts corresponding in color to the desired accept and the reject colors. Adjusting the contour of the bichromatic color map helped to modify the sensitivity of the machine to control the amount of rejects during each color sort. Fine-tuning the map decreased the loss of accept peanuts by preventing their accumulation in the receptacle collecting the reject peanuts.
Hunter L Color
The Hunter Lab Color measurement closely matches the degree of perceived color difference by humans. L is the lightness variable on a scale of 0-100; aand b are the chromaticity coordinates. The color was determined of the unsorted and each of the accept and reject fractions using the Hunter Lab DP 9000 (Hunter Associates Laboratory, Resto, VA). Peanuts were placed in a 3-inch diameter petri dish and color measurements were taken in triplicate for each sample after remixing the same peanuts in the petri dish. Hunter L value was also determined for samples after they were made into paste. The Hunter L colorimeter was calibrated with white and black calibration plates and measurements of samples followed immediately after calibration.
Moisture Determination
Moisture content of the raw, unsorted sample and all the color-sorted fractions was determined using the method described by the ASAE Yearbook of Standards S410.1 (Young
et al., 1982 b). Approximately 20g of each sample was ground in a Krups household coffee mill (Krups North America, Closter, NJ) for 2-3 minutes. Approximately 5 g of each sample of ground peanut was placed in previously weighed 1-inch diameter aluminum pans and heated for 6 hours at 140 °F. The samples were cooled to ambient temperature and weighed again. Each sample was analyzed in triplicate.
Oxidative Stability Index (OSI) and Peroxide Value (PV)
glass wool and 5.0 ±0.2 g was weighed into disposableglass tubes for OSI analysis(AOCS, 1992) using an Oil Stability Instrument (Omnion, Inc., Rockland, MA). The tubes were sealed with two hole rubber stoppers and placed in 110° C heating blocks on the oil stability instrument. A disposable Pasteur pipette was inserted through the stopper and into the oil through a tube in the rubber stopper. A second pipette inserted into the glass tube was connected via plastic tubing to a second glass tube containing 50 ml of deionized water. Compressed air was purged through the oil at 38 psi and as the oil oxidized volatile
compounds were transferred into the water and the change in conductivity in the water was determined with the conductivity sensor connected to a data acquisition system. OSI for each samplewas performed in duplicate. OSI was determined by the acquisition software to be the number of hours until the rate of increase in conductivity became exponential.
Peroxide value was determined according to AOAC method 965.3 (AOAC, 1995) using 5.0 ±0.2 g of filtered oil weighed into an Erlenmeyer flask. The oil was dissolved in 30.0 mL of an acetic acid / chloroform (3:2 v/v) solution and 0.5 mL of a saturated potassium iodide solution was added. The sample was shaken for 1 minute. 30 mL of deionized water and 0.5 mL of 1% starch solution were added into the flask. The solution was then titrated with sodium thiosulfate, at concentrations of 0.001 N, 0.01 N or 0.1N, until a change in color was perceived. PV, performed in duplicate, was reported as milliequivalent of peroxide/kg of oil. Starch was purchased from J.T. Baker chemical Co. (Phillipsburg, NJ) and all other chemicals were purchased from Fisher Scientific, Co. (Pittsburgh, PA).
Carbohydrate Analysis
peanut meal was placed into a 25 mL screw capped tube. 15 mL of extraction solvent and 1 mL of internal standard mix were added. The extraction solvent was prepared with 600 mL of methanol (Fisher Cat No. A-452-4), 250 mL of chloroform (Fisher cat No. C297-4) and 150 mL of water. The internal standard solution was prepared with 800-ppm lactose (Aldrich Cat No. 25,971-3) and 400 ppm cellobiose (Fluka Chemie, Steinheim, Germany, Cat
No.22150) dissolved in water by sonication in a 100 mL volumetric flask. Each sample mixture was vortexed for 1 minute and sonicated for 20 minutes. The contents were then centrifuged in a IEC Model K centrifuge. The solution was decanted into a 50 mL beaker and the solid pellet was discarded. The solution was left in a fume hood to evaporate overnight. 1 mL of water was added to the beaker and swirled / sonicated to dissolve the residue. The solution was stored in a 2 mL screw capped vial. 50 µL of solution was withdrawn, diluted to 2 mL with water and passed through a Dionex On Guard-H filter fitted to a syringe. After discarding the first mL, the second mL was collected in an HPLC auto sampler vial. The HPLC standard solution consisted of 5 mg of myo-inositol (Sigma Cat No. I-5125), 10 mg of glucose (Sigma Cat No. G-5250), 15 mg of fructose (Fisher Cat No. L-95), 50 mg of sucrose (Fisher cat No. S-5), 20 mg of raffinose ((Aldrich Cat No. 20,667-9) and 20 mg of stachyose (Sigma Cat No. S-4001) dissolved in 30 mL of water. The HPLC standard was prepared by mixing 9.5 mL of water with 250 µL of internal standard solution and 250 µL of standard solution and the standard was used at frequent intervals during the experiment.
isocratic flow rate of 1.0 mL/min. The column used was a Dionex PA-1, 250 mm in length and 4mm i.d., fitted with a Dionex PA-1 Guard column. The detector was programmed to run a quadruple waveform as recommended by the manufacturer. A shift in the detector range was programmed from 100 to 500 nC between 4 and 7 minutes to allow sucrose to be quantified along with other sugars. A 10 µL sample was injected using a 25 µL or smaller sample loop. The lactose internal standard was used to quantify sucrose. Cellobiose was used as the standard for the other known carbohydrate components. A quantitative value for each unknown carbohydrate was obtained by constructing a ratio of the peak height of the
unknown to the cellobiose standard peak height. All internal and reference carbohydrates were obtained from Sigma Chemical Corporation (St. Louis, MO) except cellobiose
Fatty Acid Profile
PA, Cat No.4210) and GLC-21 Standard (Nu-Check Standards) were used for identification and comparison of fatty acids present in the test samples.
The fatty acid methyl esters (FAME) were analyzed with a Perkin Elmer
Autosampler XL system (Perkin Elmer Instruments, Norwalk, CN) equipped with a flame ionization detector (FID) and a capillary column containing 70% cyanopropyl
polysilphenylene-siloxane as the stationary phase (30 m length, 0.25 mm i.d., 0.25 µm film thickness). Helium at 20 psi (1.85 mL/min) was used as the carrier gas. Hydrogen flow was set to 45 ml min−1 and the airflow was fixed at 450 ml min−1. The split flow ratio was 76.9 mL/minute. The temperature of both the injector and the detector was 265 °C. A temperature program was used with an initial oven temperature of 60° C held for 2 min, which was increased to 180°C at 10°C min−1, and then programmed to a final temperature of 235°C at 4°C min−1. The amount of sample injected was 1 µl. The total amount of palmitic (16:0), stearic (18:0), oleic (18:1), linoleic (18:2), linolenic (18:3), arachidic (20:0), eicosenoic, (20:1), behenic (22:0) and lignoceric (24:0) acids were calculated by determining the percent area of each FAME. The mean value of three replicates was used to determine the
concentration of each fatty acid. Peaks in ascending retention time order were as follows: C16:0, C18:0, C18: 1, C18: 2, C18: 3, C20:0, C20: 1, C22:0, C24:0.).
Free Fatty Acid Analysis
titrated with 0.25 to 0.0025 N NaOH and shaken vigorously until a faint and persistent pink color was obtained. The phenolphthalein imparted a pinkish hue to the solution at pH 8-10. The % free fatty acid was equal to the number of mL of 0.25 N NaOH used in the titration. When a different normality of NaOH was used then the number was calculated as follows: FFA= (normality used /0.25) * (mL used in titration)
The method of free fatty acid analysis was obtained from A.O.C.S. Official Method Aa 6-38 by Booker (1992).
Single Seed Color Distribution
A Minolta Chroma Meter CR-300 (Minolta Corporation, Mississauga, Ontario, Canada) was used to determine the single seed color of 400 individual peanuts randomly selected from each sample. The colorimeter consisted of a compact tristimulus color analyzer for measuring reflective colors of surfaces. The machine had an 8 mm-diameter measuring area (head) and used a diffuse illumination and a 0° viewing angle. A pulsed xenon arc lamp provided illumination on the sample surface. Six high–sensitivity silicon photocells were used to measure both incident light and reflected light. The instrument displayed absolute measurement of Hunter L value for each peanut. Mostly whole peanuts were selected for color evaluation. In case of split peanuts the color of the curved side was recorded.
Total Oil content (Nuclear Magnetic Resonance)
induction decay (FID) was recorded following the 90° pulse. The maximum amplitude of the signal was proportional to the total number of protons from the water and oil phases of the sample. The application of a second RF pulse produced a spin-echo signal when only the signal from the oil phase contributed to the FID. The difference between the two amplitudes was calculated to be proportional to the moisture content. Once the apparatus was suitably calibarated, the automatic conversion of measured signals estimated the percentages of oil and moisture in each test sample.
Descriptive Sensory Analysis
crackers were provided between samples. The intensity of descriptors such as roasted peanutty, sweet aromatic, dark roast, raw/ beany, woody/hulls/skins, musty, fruity /fermented, painty, plastic chemical, sweet, bitter, and astringency were the attributes evaluated on a 0-15 point Spectrum intensity scale(Meilgaard et al., 1999) (Table 1).
2.3.3 Statistics