ABSTRACT
BUHRMAN, GREGORY KALE. Application of the Multiple Solvent Crystal
Structures Method to Analyze the Protein Binding Surface of H-Ras Protein (Under the direction of Carla Mattos)
H-Ras is a member of the small, monomeric GTPase protein superfamily. H-Ras
functions as a ‘molecular switch’, using nucleotide dependent conformational changes to relay signals in a number of signal transduction pathways. Mutations in codons 12, 13 and 61 creates an oncogenic version of the protein which does not hydrolyze GTP, resulting in the constitutive activation of downstream effector proteins. Ras proteins participate in multiple protein : protein interactions in the cell, making Ras a good candidate protein to extend the Multiple Solvent Crystal Structures method (MSCS) to the analysis and prediction of protein binding surfaces. MSCS involves solving the crystal structure of the protein after soaking the protein crystal in a variety of organic solvent molecules. Replacing an aqueous solvent with an organic solvent affects the Ras protein structure in several ways. The disordered Switch II region of Ras is ordered in the presence of 2,2,2-trifluoroethanol or 1,6-hexanediol. Polar interactions that stabilize the ordered switch are enhanced in the presence of hydrophobic co-solvents. This suggests that hydrophobic solvents can be used in general to order short biologically relevant segments of disordered regions in protein crystals. We have used MSCS to study two crystal forms of active H-Ras bound to a nonhydrolyzable GTP analog
Application of the Multiple Solvent Crystal Structures Method to Analyze the Protein Binding Surface of H-Ras Protein
By
Gregory Kale Buhrman
A dissertation submitted to the Graduate Faculty of North Carolina State University in partial fulfillment of the requirements for the Degree of Doctor of Philosophy
Molecular and Structural Biochemistry Raleigh, North Carolina
DEDICATION
I dedicate this dissertation to my wife, Tiffany Wynn Wagner. Without her love and support, nothing worthwhile that I’ve done in this life would have been possible, or meaningful. She has been my constant companion throughout my Masters and Ph.D. program. First, she moved with me to the little town of Emmitsburg, MD, where she worked as a Family Therapist for a residential drug treatment facility and I worked on a Masters degree at Hood College. Then, she left her job and family to follow me to North Carolina, so I could selfishly follow my dreams of learning protein crystallography. She has put up with my long hours and small income for as long as I can remember. She has had the strength of personality to support my dreams, while pursuing hers as well. Because of her, we have a lovely home, populated with one stubborn dog, one
independent cat, one fish, and two amazing children, Eva Jane and Eliza Rae Buhrman. She is my compass and the lens through which I view my life. Without her
BIOGRAPHY
I am the eldest son of Charles and Harriet Buhrman. My father was an electrical engineer, before an unfortunate accident left him partially paralyzed and unable to continue what looked to be a promising engineering career. He now works as a much loved and respected substitute teacher in Pennsylvania. My mother, when she finished raising us, returned to her teaching career as a Montessori school teacher. I was born in Bremerton, Washington, but spent most of my life growing up in Westminster, Maryland. I received my undergraduate B.S. in Molecular Biology from the University of Pittsburgh and a M.S. in Biomedical Research, from Hood College in Frederick, MD. The mentor for my Masters thesis, entitled ‘Analysis of the DNA Binding Properties of
ACKNOWLEDGMENTS
TABLE OF CONTENTS
LIST OF TABLES ………x
LIST OF FIGURES ……….xii
CHAPTER I. INTRODUCTION……….……….1
I. History and Background of Ras Oncogenesis……….1
II. The GTPase Cycle………...…2
III. The Ras Superfamily ……….………7
IV. Structure and Function of Ras ………..9
A. Switch I ………..11
B. Switch II ………..13
C. The P-loop ……..………..14
D. The Guanine Nucleotide Binding Pocket ……..………..14
E. Magnesium ion Coordination ……….……….15
F. GTP Hydrolysis Mechanism ………..………..15
G. Ras Effector Binding Domain ……….………16
V. Characterizing Protein Binding Sites by Solvent Mapping ….………18
A. Multiple Solvent Crystal Structures (MSCS)………18
B. General Characteristics of Protein Binding Sites ………..20
C. Functional Epitopes within Ras Protein Binding Modes …………..23
D. Organic Solvent Molecules ………..25
VI. Summary of Dissertation Work ……….30
CHAPTER II. EXPERIMENTAL PROCEDURES……….33
Room Temperature Studies ………..34
Crosslinking and transfer to organic solvents ………..34
Data Collection, Processing and Structure Refinement …………..……34
Cryo Studies of wild type and Q61L mutant Ras ………35
Crystallization Conditions………35
Data Collection and Processing ………..35
Structure Refinement ………..36
Crosslinking and soaking in organic solvents ………37
Structure Refinement of solvent soaked structures ………37
Solvent Site Validation ………..38
Data Collection, Refinement and Validation Statistics ……….40
CHAPTER III. Organic solvents order the dynamic Switch II in Ras crystals………47
ABSTRACT ………..48
INTRODUCTION ………48
RESULTS AND DISCUSSION ………..49
CHAPTER IV. Ras-GMPPNP wt and Q61L mutant crystallized in the R32 Space Group Have a New Conformation for Switch II that is not distorted by crystal contacts ………58
ABSTRACT ………58
INTRODUCTION… ………..58
RESULTS ………..………60
Calcium Ion Binding Sites ………69
Switch I ……….70
Switch II conformation ………..72
Q61L Ras-GMPPNP mutant solved in R32 space group …………..76
DISCUSSION ………79
CHAPTER V. MSCS Analysis of H-Ras Identifies Known Protein Binding Sites and Reveals New Putative Protein Binding Sites ………82
ABSTRACT ………..82
INTRODUCTION ……….82
RESULTS ……….84
Global effects of organic solvent soaking ……….85
Solvent Binding Sites ………87
Affinity Hotspot One, Switch II-Helix 3 ………..……….89
Affinity Hotspot Two ……..………..93
Switch I Solvent Binding Site ………94
R,S,R bisfuranol and glycerol ………97
Organic solvent molecules in P3(2)21 vs. R32 Space Group ……...102
DISCUSSION ……….103
Trends Based on Solvent Polarity ………..……103
Comparing MSCS with Known Ras Protein Complexes …..……106
Comparison of MSCS with ProMate and CastP ………110
CHAPTER VI. Two enantiomers bound to Ras and Hen Egg White
Lysozyme protein ………..115
ABSTRACT ………115
INTRODUCTION ………..…115
RESULTS ………..…119
Ras soaked in S,R,S and R,S,R bisfuranol ……….119
Non selective solvent binding sites ……….120
Stereo selective solvent binding sites ……….121
Lysozyme Bisfuranol Binding Sites ………124
Subsite A ……….126
Subsite D ………128
Subsite F ……….128
DISCUSSION ……….130
Conclusions ……….134
APPENDIX CNS Topology and Parameter Files for residue types R,S,R-bisfuranol (BIR) and S,R,S-bisfuranol (BIS) ………..136
CHAPTER VII. Structural mechanism of oxidative regulation of the phosphatase Cdc25B via an intramolecular disulfide bond ………..140
ABSTRACT ……….141
INTRODUCTION ………141
METHODS ………..143
Data collection and model refinement……..………...144
Substrate Binding Experiments ………..………146
RESULTS ………146
The apo form of Cdc25B………..………..148
Chemistry and structure are coupled in the sulfenic intermediate……….………149
The disulfide bond sequesters the active site cysteine And prevents binding to substrate ………..………...150
DISCUSSION ……..……….……….152
Comparison with previously published structures Of Cdc25B ………..……….152
The mechanism of reversible inactivation in Cdc25B ………154
Comparison with PTP1B ………155
Concluding Remarks ………..158
REFERENCES ……….………..159
APPENDIX Crystal Structures of the Active Site Mutants C473S and C473D …………..………171
LIST OF TABLES CHAPTER 1.
Table 1.1 Chemical properties of organic solvent molecules used in
MSCS of Ras ……...……….…26 Table 1.2. Chemical Structure of organic solvents used in MSCS of Ras………27 CHAPTER 2.
Table 2.1. Data collection and refinement statistics. Ras structures solved at room temperature in aqueous mother liquor and in the presence
of organic solvents………..40 Table 2.2.Data collection and refinement statistics for Ras-GMPPNP soaked in organic solvents ………..…………..41 Table 2.3. Data collection and refinement statistics for Ras-GMPPNP crystals soaked in various concentrations of S,R,S-bisfuranol (BIS) and R,S,R-bisfuranol (BIR)……….42
Table 2.4 Data collection and refinement statistics for hen egg white Lysozyme, crosslinked and soaked in 50% S,R,S-bisfuranol (BIS)
And 50% R,S,R-bisfuranol (BIR)………..43 Table 2.5 Data collection and refinement statistics for Ras-GMPPNP
Q61L mutant ………44
Table 2.6 Data collection and refinement statistics for Oxidation and
Table 2.7 Data collection and refinement statistics for active site
Cdc25B mutants ……….46
Table 4.1. Ras bound to multiple GTP analogs ………..……….62 CHAPTER 5.
LIST OF FIGURES CHAPTER 1.
Figure 1.1. The Ras GTPase cycle………..3 Figure 1.2. Ras>Raf>MEK signal transduction cascade………6 Figure 1.3. The Ras superfamily, unrooted phylogenetic tree………8 Figure 1.4. Structure of the catalytic core of H-Ras, bound to GMPPNP...….11 Figure 1.5. Sequence alignment of the extended Ras effector binding region..17
CHAPTER 3.
Figure 3.1. Electron density for the Switch II residues 59-67 in Ras crystals under different conditions………..……….…52
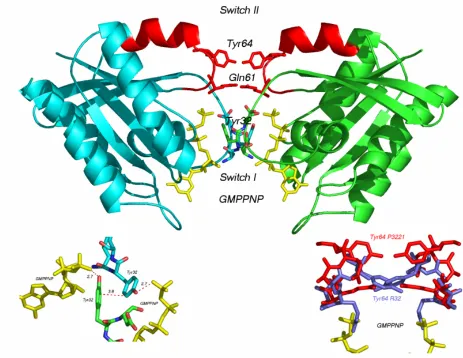
Figure 3.2. Organic solvents bound to Ras………….………53 Figure 3.3. Switch II region in Ras from five models superimposed: in the presence of TFE, 1,6-hexanediol and in complex with RalGDS, PI3Kinase and
RasGAP………..55 CHAPTER 4.
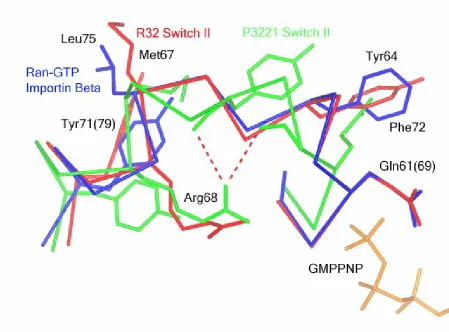
Figure 4.6. Switch II from R32 Ras-GMPPNP is similar to
Ran-GTP-Importin Β ...73 Figure 4.7 The R32 Switch is not in the proper conformation to
Interact with Ras-GAP ……..………75 Figure 4.8. The Q61L mutant forms a contiguous hydrophobic patch with
Switch I residues ………...………77 Figure 4.9. Electron density for Q61L mutant……….……….78 CHAPTER 5.
Figure 5.1 2Fo-Fc electron density contoured at 1.0 Sigma for selected
Solvent molecules ……….86 Figure 5.2. Organic solvent molecules superimposed on the structure
Of Ras-GMPPNP ……….88 Figure 5.3. Organic solvent molecules superimpose at affinity hotspots …...91 Figure 5.4. Conformational flexibility induced by organic solvent
Molecules binding at the Switch II-helix 3 affinity hotspot ….………..92 Figure 5.5. Switch I and extended Ras effector binding domain with
Interacting glycerol molecules ……….………95 Figure 5.6. Selected R,S,R-bisfuranol molecules make specific
Hydrogen bonds within the extended Ras effector binding domain……….…96 Figure 5.7. Surface residues of Ras-GMPPNP, buried by organic solvents .104 Figure 5.8. Comparison of protein binding site prediction methods ……….107 CHAPTER 6.
Figure 6.2. Non-selective and stereo-selective Ras solvent binding sites …122
Figure 6.3. Non-selective Ras solvent binding site 1213……….………..123
Figure 6.4. Lysozyme molecular surface ………...………..……….125
Figure 6.5. Non-selective site superimposes with a molecule of Tris……….…127
Figure 6.6. Subsite D……….129
Figure 6.7. The Ras protein surface buried by R,S,R-bisfuranol ……….131
CHAPTER 7. Figure 7.1. Active site P-loop of apo Cdc25B………..164
Figure 7.2. Active site P-loop of the oxidized forms of Cdc25B……….165
Figure 7.3 The disulfide form of the Cdc25B Active site ………166
Figure 7.4. Cdc25B binding experiments with substrate ……….167
Figure 7.5. Active site P-loop of Cdc25B, reduced to disulfide ………..168
Figure 7.6. Comparison of the P-loop in deactivated forms of Cdc25B And PTP1B………..169
Figure 7.7. Molecular surface of the disulfide form of Cdc25B ………170
CHAPTER ONE
The biological functions of many proteins depend on their ability to interact with other proteins to form complexes. Determining the region of a protein that participates in a protein-protein interface is an important first step to understanding how many proteins function. One common and informative approach is to solve the structure of the protein complex by NMR or X-ray crystallography. However, obtaining diffraction quality crystals of protein complexes is often a difficult task, even when diffraction quality crystals of the unbound proteins can be obtained. This is very often the case with transient protein hetero-complexes, which are made up of different proteins that can exist in both the bound and unbound state and have a range of binding affinities. Examples of transient protein hetero-complexes include enzyme-inhibitor hetero-complexes, protein-receptor hetero-complexes and signal transduction partners. The MSCS (Multiple Solvent Crystal Structures) method has already been used to successfully map the protein binding surface of several proteases which bind and cleave small, peptide substrates (Ringe & Mattos 1999). In this work, we extend the MSCS technique to mapping the protein binding surface of Ras, a protein which forms protein complexes with a variety of signal transduction partners.
I. History and Background of Ras Oncogenesis
protein from cells transformed with the viral ras gene from Harvey and Kirsten murine sarcoma viruses as well as protein encoded by a cellular Harvey-ras gene (Furth, Davis, et al. 1982). Also in 1982, Channing Der showed that cellular homologs to the viral H-ras and K-ras gene are found in human bladder and lung carcinoma cell lines and are responsible for transformation of these cell lines (Der, Krontiris, et al. 1982). In 1983, Shimizu et. al. found that a third isoform of the ras gene, N-ras, was responsible for transformation of
neuroblastoma cells (Shimizu, GLYdfarb, et al. 1983). These findings were consistent with the previous work of Harold Varmus and J. Michael Bishop, who demonstrated that the oncogene of Rous Sarcoma Virus (src) also has a cellular homolog. These cellular homologs of viral oncogenes are mutant forms of normal proteins involved in normal cellular growth and differentiation. Mutations at codons 12, 13 or 61 in Ras were identified as transforming mutations in the H, K and N – ras genes. These mutations are found in over 30% of cancers of the pancreas, colon, lung, thyroid and in leukemia, (reviewed in Bos 1989). This high incidence of mutant Ras in human cancer makes Ras a prime target for anti-cancer therapies, (reviewed by Cox & Der 2002).
II. The GTPase Cycle
GTP hydrolysis to GDP converts the protein to an inactive conformation that no longer interacts with downstream effector proteins, switching the signal pathway off. Oncogenic mutants of Ras have reduced GTPase activity which results in uncontrolled activation of the signaling pathways, leading to uncontrolled cellular growth and oncogenesis (Krengel, Schlichting, et al. 1990). The Ras GTPase cycle is a paradigm used to describe all small, monomeric GTPases (see Figure 1).
The structures of Ras and several other GTPases have been solved, in the GTP (using nonhydrolyzable GTP analogs) and GDP bound forms, (reviewed by Corbett & Alber 2001). These studies have shown that despite average sequence homology, the structural
conservation is very good. Because Ras was one of the first GTPases to be characterized structurally and functionally, Ras has served as a paradigm for characterizing all the GTPases and is considered the ‘canonical’ GTPase to which other GTPases are compared.
Acting alone, Ras would be an inefficient molecular switch. The intrinsic GTPase activity of Ras is relatively low (4.2 x 10 -4 s-1) (John, Schlichting, et al. 1989). The rate of GTP hydrolysis is accelerated by roughly 5 orders of magnitude by GTPase Activating Proteins (GAPs) (Gideon, John, et al. 1992). GAPs for Ras include the p120 GAP protein and neurofibromin (NF1). GAPs accelerate GTP hydrolysis by stabilizing the transition state of the hydrolysis reaction (Mittal, Ahmadian, et al. 1996). Converting the inactive GDP bound Ras to the active GTP bound form requires nucleotide release. Nucleotide
dissociation rates for GDP and GTP are very low for free Ras (3.4 x 10 -4 s-1)(John, Sohmen, et al. 1990). Nucleotide release is accelerated roughly six fold by Guanine Nucleotide Exchange Factors (GEFs). GEFs for Ras include SOS and RasGEF. GEFs accelerate nucleotide release by stabilizing an open conformation that does not bind nucleotide (Boriack-Sjodin, Margarit, et al. 1998). Nucleotide free Ras can then become activated by binding to GTP. GEFs are activated in response to activation of receptor tyrosine kinases and other signaling molecules.
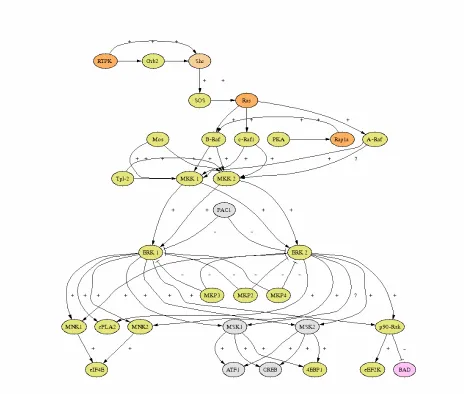
of Ras signaling. One pathway that has been characterized is the Ras>Raf>MEK signal transduction cascade, see Figure 2. In this pathway, Ras binds to Raf kinase and brings Raf to the plasma membrane where Raf is activated and in turn, activates a Mitogen Activated Protein (MAP) kinase cascade. This MAP kinase cascade activates nuclear transcription factors, such as Elk-1, by phosphorylation. Elk-1 activates the transcription of genes
responsible for cellular growth and differentiation. Other Ras activated downstream effector proteins include PI3Kinase, RalGDS (Guanine nucleotide Dissociation Stimulator), Byr2 ( a MEKK/Raf homolog in S. pombe), AF6 (drosophila), RIN1 (Ras INterference), MEKK1 (Mitogen activated protein kinase Kinase Kinase 1) , PKC zeta and KSR Raf-related kinase, (Kinase Suppressor of Ras, drosophila protein with murine and human homologs), reviewed in (Joneson & Bar-Sagi 1997), (Herrmann & Nassar 1996) and (Marshall 1995). Putative Ras effector proteins have been identified by a number of methods, including
coimmunoprecipitation, yeast two-hybrid experiments, genetic screens and sequence similarity with known Ras binding domains. Defining functional characteristics of Ras effector proteins include the ability to bind Ras in a GTP dependent manner, the ability to compete with known Ras binding proteins, inhibition or activation of known Ras signaling pathways, co-localization with Ras and an increase in activity concomitant with Ras
activation. Putative Ras effector proteins which have been identified by homology or in vitro experiments need to be characterized by in vivo experiments which demonstrate the
Several of the complexes between downstream effector proteins and Ras have been characterized structurally, reviewed by (Corbett & Alber 2001). This structural information indicates several key concepts. Most effector proteins interact with a subset of residues in and around the switch regions. Binding of effector proteins often result in a disorder to order transition in the switch regions (primarily switch II). NMR experiments have shown that the active form of Ras, bound to either GTP or a GTP analog, is a highly dynamic protein which oscillates between a number of stable conformations in solution (Geyer, Schweins, et al. 1996). Downstream effector proteins often bind to a subset of the conformations adopted by activated Ras protein. Downstream effector proteins interact with Ras protein via several different binding motifs. Binding and activation of effector proteins are separate functions which may be due to distinct Ras-effector interactions.
III. The Ras Superfamily
Ras is the canonical member of a larger superfamily of GTPases, which is
evolutionarily conserved in eukaryotes from yeast to man. The Ras superfamily includes over 100 human proteins, which can be sub-classified into the Ras, Rho, Rab, Arf, and GNA families, see Figure 3. The Ras subfamily alone includes at least 35 human proteins,
reviewed in (Colicelli 2004). Sequence analysis of the Ras superfamily has defined sequence motifs in several regions of conserved residues, referred to as ‘G boxes’. The G1 box
proteins. These proteins play roles in a number of diverse cellular functions. An important aspect of the Ras superfamily is the significant degree of crosstalk that exists between family members. One example of crosstalk is seen in the ERK signal transduction pathway shown in Figure 2. Activated forms of both Ras and Rap can bind and activate the beta isoform of Raf kinase, (reviewed by Stork 2003). In this example, cross talk occurs via competition between GTPases for a common downstream effector protein. Another example of complex
interactions between GTPases occurs between Ras and Ral. A number of Ral specific GEFs are downstream effector proteins which are activated by Ras. In this example,
communication between Ras and Ral occurs via a common protein (RalGEF) that acts as a GEF for Ral, but is activated by Ras, even though the structural similarity of Ras and Ral is fairly high (Nicely, Kosak, et al. 2004). Another example of this kind of interaction involves Tiam1, a Ras binding protein, which also functions as a GEF for Rac. This complex
behavior may be explained by the structure of the ternary complex of Ras-SOS-Ras-GTP, which illustrates what may be a common mechanism of GEF activation by active Ras (Margarit, Sondermann, et al. 2003).
IV. Structure and Function of Ras
structures of H-Ras and causes problems in bacterial over expression, purification and crystallization. Proteins with truncated C-termini are effective dominant negative inhibitors of the Ras>Raf>MEK>ERK signal pathway, binding efficiently to Raf kinase, but preventing membrane translocation and activation. Additionally, chimeric proteins of Raf plus the C-terminus CAAX motif of Ras are directed to the plasma membrane and activated in a Ras independent manner (Stokoe, Macdonald, et al. 1994). The C-terminus contributes to the interaction of H-Ras with the cysteine rich domain of Raf kinase, but does not result in any detectable conformational changes in H-Ras (Thapar, Williams, et al. 2004).
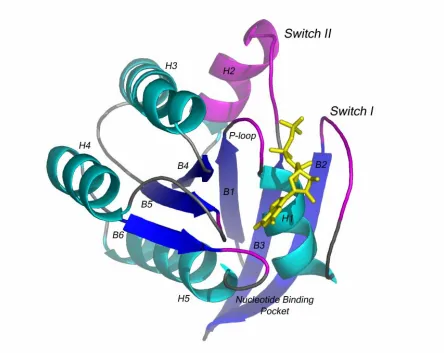
Figure 4. Structure of the catalytic domain of H-Ras bound to GMPPNP (a nonhydrolyzable GTP analog). The P-loop, Switch I, Switch II and Nucleotide binding pocket are colored magenta.
A. Switch I
with the core Ras effector binding region (32-40) and demonstrates how conformational changes from the active to inactive state change effector binding affinity. Switch I is an inherently flexible region that undergoes an order to disorder transition upon GTP hydrolysis. NMR experiments show that in the GTP bound state, Switch I residues oscillate between two stable conformations (Geyer, Schweins, et al. 1996). Molecular dynamic simulations of the GTP bound form of Ras also detect a large motion involving residues 27-37(Soares, Miller, et al. 2001). Recent studies indicate that the extent of conformational change that occurs upon GTP hydrolysis, and therefore the extent of Switch I, varies between GTPases. For example, the structures of both GDP and GTP forms of RalA shows that Switch I, when it is not stabilized by crystal contacts, is disordered in both the GDP and GTP forms (Nicely, Kosak, et al. 2004) . Because Switch I coincides with the core Ras effector binding region, changes in the conformational flexibility of different GTPases is likely to play an important role in determining differences in specificity and affinity between GTPases. Glu31
stimulated GTP hydrolysis but does not affect intrinsic GTP hydrolysis, demonstrating that Tyr32 plays a significant role in GAP catalyzed GTP hydrolysis (Fidyk & Cerione 2002). Pro34 may act to restrict the conformational changes that occur in switch I (Sprang 1997). Thr35 is a conserved residue that is linked directly to the gamma phosphate via its backbone amide group which hydrogen bonds to one of the gamma phosphate oxygens. GTP
hydrolysis results in the loss of this hydrogen bond in the GDP bound form of Ras, allowing the Switch I region more conformational freedom in the GDP bound state. NMR studies of T35S and T35A mutant Ras indicates the entire Switch I region is disordered in both mutants, emphasizing the crucial role Thr35 plays in Switch I stabilization (Spoerner, Herrmann, et al. 2001). Furthermore, Thr35 is glucosylated by Clostridiium sordelli lethal toxin, trapping Ras in an inactive conformation that does not bind to downstream effector proteins (Geyer, Wilde, et al. 2003). Ile36 forms part of a hydrophobic binding pocket that interacts with Leu902 in the Ras-RasGAP complex (Scheffzek, Ahmadian, et al. 1997).
B. Switch II
Switch II, defined as a region which undergoes a conformational change between the GTP and GDP bound forms, comprises loop4 (58-64) and helix a2 (65-74). Switch II overlaps with the G3 box (blbbDxxGl), where l is a hydrophilic residue and b is a
oncogenic. Tyr64 plays a role in binding to several downstream effector proteins and in binding RasGAP and RasSOS. Y64G/S65G or Y64G/Y71G double mutants show reduced binding to RasGAP NF1 and PI3Kinase (Moodie, Paris, et al. 1995). Mutation of A59, Q61 or E63 also inhibit interactions with RasGAP and NF-1 (Marshall 1993). Arg68 and Asp69 play important structural roles, stabilizing the backbone of Switch II by hydrogen bonding with backbone carbonyl oxygens. Met67 interacts with the Ras-GAP protein and other downstream effector proteins.
C. The P-loop
The diphosphate binding loop, or P-loop, which consists of residues 10-17 and lies
between strand β1 and helix α1 overlaps with the G1 box identified by sequence analysis [aaaaGxxxxGK (S or T)], where a is an aliphatic residue, and is also referred to as the Walker A motif found in all purine nucleotide binding proteins (Colicelli 2004). Backbone amide groups of the P-loop (residues 14-17) stabilize the negative charge of the phosphates. The backbone amides of Gly12 and Gly13 form hydrogen bonds with the gamma phosphate, and mutation of either of these residues is oncogenic. Experiments have shown that these oncogenic mutants act by lowering the pKa of the gamma phosphate, making hydrolysis prohibitive (Schweins, Geyer, et al. 1996).
D. The Guanine Nucleotide Binding Pocket
the P-loop, connecting all three nucleotide binding regions together via hydrogen bonds from the side chain amide of Asn116 to the side chain hydroxyl of Thr144 and the backbone oxygen of Val14 (Soares, Miller, et al. 2001).
E. Magnesium Ion Coordination
The negatively charged phosphate groups are partially stabilized by a positively charged magnesium ion. The magnesium ion is coordinated to the backbone phosphate oxygens of the beta and gamma phosphate groups as well as the side chain hydroxyls of Thr35 from Switch I and Ser17 from the P-loop. Two conserved water molecules also participate in Mg ion coordination. One water molecule makes a hydrogen bond with the backbone carbonyl of Thr58 and the side chain oxygen of a conserved Asp57. The other structurally conserved water molecule makes an additional hydrogen bond with the backbone carbonyl of Asp33 from Switch I. This magnesium ion is found in both GTP and GDP structures and is well conserved across the Ras superfamily.
F. GTP Hydrolysis Mechanism
pentavalent phospho intermediate and GDP(Schweins, Geyer, et al. 1996). GAPs catalyze GTP hydrolysis by stabilizing the transition state of the hydrolysis mechanism. Mutations at codons 12, 13 or 61 lower the rate of both intrinsic and GAP catalyzed GTP hydrolysis, although they work in different ways. In GAP catalyzed hydrolysis, mutations at codons 12 or 13 result in steric hindrance of the ‘arginine finger’, Arg789 (Scheffzek, Ahmadian, et al. 1997) . In intrinsic hydrolysis, mutations at codons 12 or 13 reduce the pKa of the gamma phosphate, making generation of the pentavalent phospho intermediate less favorable (Schweins, Geyer, et al. 1996). A recent computational study suggests that mutation at codon 61 disrupts the ability of Ras to adopt a catalytic conformation (Shurki & Warshel 2004). One of the difficulties in elucidating the role of Q61 stems from the conformational flexibility of this region. Our structures of the wild type and Q61L mutant of H-Ras lend support to the notion that Q61L preferentially adopts a non-catalytic conformation.
G. Ras Effector Binding Domain
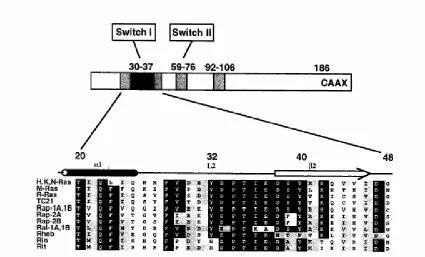
Figure 5. Sequence alignment of the extended Ras effector binding region. Figure reprinted with premission from (Campbell, Khosravi-Far, et al. 1998).
Available crystal structures of Ras-effector complexes provide structural details about some Ras effector residues. However many of the available crystal structures are of
minimum Ras binding domains that do not extend to interact with regions outside the core Ras effector domain. The studies with minimum Ras binding domains do not account for all interactions that are important in understanding the physiological interactions between Ras and effector proteins. For instance, mutations of residues 41 and 43 from the extended Ras effector domain, don’t affect binding to the minimum Raf binding domain, but do interfere with binding to full length Raf-1 (Winkler, Johnson, et al. 1997). In an effort to probe the entire surface of Ras for potential protein: protein interactions that can guide future
biochemical and genetic experiments, we use the multiple solvent crystal structures method (MSCS) to characterize the surface of active Ras bound to GMPPNP.
V. Characterizing Protein Binding Sites by Solvent Mapping
A. Multiple Solvent Crystal Structures (MSCS)
MSCS involves solving the structure of a protein crystal soaked in several, distinct organic solvents. The multiple structures are then superimposed for analysis. The organic solvents used vary in a number of properties (size, shape, charge polarity, dielectric,
surface (Mattos & Ringe 2001) . MSCS analysis of Elastase with the organic solvents acetonitrile, acetone, dimethylformamide, ethanol, isopropanol, 1-2 hexenediol and
trifluoroethanol show that organic solvent molecules cluster in the active site at the P and P’ subsites . With few exceptions, organic solvent molecules that don’t cluster are found at regions of crystal contacts and are considered to be experimental artifacts due to non-biological binding pockets that form as a consequence of crystallization. MSCS of Thermolysin with the organic solvents isopropanol, acetone and acetonitrile found similar trends (English, Groom, et al. 2001)(English, Done, et al. 1999). The results of these studies led us to believe that sites of protein: protein interaction can be experimentally mapped by this method. Thus the MSCS method is used here to further characterize the binding surface of Ras. Because the surface properties of Ras differ significantly from those of proteases, this study also served to test and expand the limits of the MSCS method.
Ras protein is very different from the few proteins that have been characterized by soaking the protein crystal in organic solvents. With the exception of Lysozyme, all of the proteins soaked in organic solvents are proteases. This includes Thermolysin, Subtilisin Carlsberg, Elastase and Chymotrypsin (reviewed by Mattos & Ringe 2001). These proteins are very stable, extracellular proteins. The protein recognition site consists of a pre-formed active site that binds the protein substrate via a lock and key mechanism. The protein binding site for the proteases is situated within large, protected active site clefts on the protein surface. Ras, on the other hand is an intracellular signaling protein involved in transient protein: protein interactions with multiple partners. The known effector sites are conformationally flexible and many effector residues undergo a disorder - to - order
we could not assume that the protein structure would remain unaffected by the organic solvent molecules. Therefore, initial room temperature studies of Ras soaked in a small number of organic solvents were carried out to test this assumption. The results of these studies led us to conclude that the overall structure of protein: protein interaction sites on Ras was relatively stable in organic solvents, even in the case of the conformationally flexible switch regions (Buhrman, de, et al. 2003).
MSCS has also been used to assess the relative affinity of solvent binding sites. English et. al. solvent mapped Thermolysin in increasing concentrations of isopropanol (2,5,10,25,60,80,90 and 100 percent). These experiments found two sets of solvent binding sites. One smaller set of sites was identified at low concentrations of isopropanol (2-25 percent) and a larger set of sites was identified at higher concentrations of isopropanol (60-neat) (English, Done, et al. 1999). Interestingly, only one of the four active-site subsites of Thermolysin was occupied by isopropanol at low concentration, whereas all four subsites were occupied by isopropanol soaked at high concentrations.
B. General Characteristics of Protein Binding Sites
Protein binding sites can be structurally classified in a number of ways. They can be classified based on size, shape, charge, specificity, affinity, flexibility, persistence, and shape complementarity. Specific measurements include: solvation potential, residue interface propensity, hydrophobicity, concave / convex shape and accessible surface area. Transient protein: protein interactions occur in signal transduction pathways, protein inhibitor
ribosome or proteosome. Interfaces in transient hetero complexes tend to be more hydrophilic than permanent complexes or protein inhibitor complexes. Ras protein is an example of a protein which forms transient protein interactions with a high degree of hydrophilicity. For example, the Raps - Raf complex (PDB code: 1gua), in which Rap was mutated to resemble Ras, buries 2.5 charges over 17 residues, or 0.15 charges per residue. The average charge per residue distribution in protein interfaces is 2.87 charges over 32 residues, or 0.09 charges per residue. (Protein interface statistics are taken from the Surface Properties of INterfaces (SPIN) database found at: http://trantor.bioc.columbia.edu/cgi-bin/SPIN/ ) The Raps - Raf interface includes more hydrogen bonds and salt bridge interactions than average. The large degree of polarity at this protein interface is expected, since Ras is a monomeric protein that remains stable when its protein interaction surface is exposed to aqueous solvent. Because of the polar nature of the Ras binding site, a wide range of polar solvents were used in solvent mapping Ras.
few residues that form a hydrophobic core, which is surrounded by hydrophilic residues at the center of the protein: protein interface (Clackson & Wells 1995). These crucial residues describe the functional epitope within the overall protein interface. MSCS with Elastase and Thermolysin not only correctly identify the protein interface, but the hotspots in which organic solvent molecules clustered identify known functional epitopes within the protein interface. Protein interface analysis shows that Ras interacts with effector proteins via a number of distinct binding modes (Corbett & Alber 2001). Functional epitopes within these binding interfaces have been characterized by genetic, biochemical and computational methods. Kiel and Herrmann have carried out an extensive alanine mutagenesis study of the binding interfaces of Raps-Raf and Ras-RalGDS (Kiel, Serrano, et al. 2004). Like the Clackson and Wells study, Kiel and Herrmann define a minimum functional epitope within the larger protein interface. Unlike the hydrophobic residues that make up the functional epitope for hGH : hGHb, the functional epitope for the Ras protein interface consists of mainly charged residues (Kiel, Serrano, et al. 2004). Our MSCS work with Ras identifies functional epitopes within known protein binding sites and also predicts new binding site epitopes in a region distal to the effector region of Ras.
The common characteristics of protein-protein binding sites have been exploited by computational methods used to predict protein binding sites. ProMate is a program used to predict protein: protein binding sites specifically in transiently formed complexes like Ras: effector protein complexes, as opposed to more permanent protein-protein interactions, of the type found in structural protein complexes. ProMate uses a prediction algorithm that
hydrophobic patches, secondary structure, amino acid type and whether or not a multiple alignment shows evolutionarily conserved positions (Neuvirth, Raz R., et al. 2004). ProMate roughly predicts the known effector binding domain of Ras. CastP predicts protein: ligand binding sites on the basis of binding pocket geometry(Binkowski, Naghibzadeh, et al. 2003). CastP correctly identifies some of the known protein binding sites on Ras.
C. Functional Epitopes within Ras Protein Binding Modes
Of the nine Ras superfamily protein binding modes identified by Alber et al., there is structural data from x-ray crystallography of Ras - protein complexes for three major binding modes (Corbett & Alber 2001). The six binding modes with no Ras structural data include (Ran-Importin Beta, Arf-ArfGAP, Rab-Rabphilin-3A, Rho-PKN/PRK1, Ran-RanBP2, Rac-p67) (Corbett & Alber 2001). Several are represented by only a single protein complex in the protein interface analysis. More data on Ras-related complexes is required to determine whether or not these complexes represent major binding modes for Ras, or are unique outliers. The three binding modes utilized by Ras include complexes of the Ras - Ras Binding Domain (RBD), Ras-GEF and Ras-GAP. PI3 kinase, Raf kinase and RalGDS all interact with Ras via a conserved Ras Binding Domain. The Ras Binding Domain consists of
percent burial are from the SPIN database ). Residues that are 30 % or more buried in the interface than in the monomer are designated as critical buried residues and include: Gln25, Ile36, Glu37 and Arg41. Interface residues identified by Kiel and Herrmann as having a large positive effect on binding affinity, (>1.0 kcal/mol) as measured by isothermal
calorimetry, include: ( Asp33, Ile36, Gln37 and Asp38). Gln25 was not measured and Arg41 had a negative effect on binding affinity due to changes in entropy. Overall, residues that are well buried correlate with residues that define the functional binding epitope in the Raps : Raf complex. A second binding mode utilized by Ras-GEFs is seen in the Ras-SOS complex (PDB code: 1BKD) (Boriack-Sjodin, Margarit, et al. 1998). This interface consists of Ras residues: Arg102 (59.2% solvent accessible in monomer /21 % solvent accessible in
critically buried residues are located in Switch II / helix 3. The Ras-GAP critically buried residues overlap with both the Ras-GEF binding mode and the Ras-RBD binding mode. These three binding modes stabilize different structures of Ras as shown by root mean square deviation (RMSD) comparisons of Ras bound to these Ras binding proteins. Most of the critical interacting residues are polar, in contrast to the proteases, whose nonpolar binding surface was previously mapped by organic solvents. Solvent mapping of the Ras binding surface required the use of a variety of organic solvents, with a wide range of polarities.
D. Organic Solvent Molecules
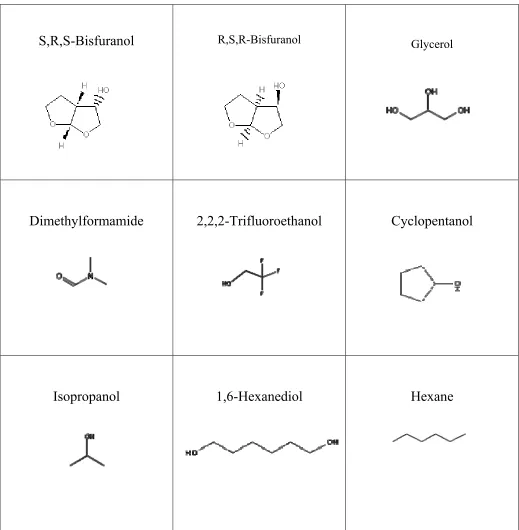
The organic solvent molecules used to solvent map Ras include 2,2,2 trifluoroethanol (TFE), N,N dimethylformamide (DMF), 1,6-hexanediol (HXD), hexane (HXN), glycerol (GLY), isopropanol (ISO), cyclopentanol (PEN) , R,S,R bisfuranol (BIR) and S,R,S
Table 1. Chemical properties of organic solvents used in MSCS of Ras.
Solvent
Chemical Formula
relative polarity
dielectric Solubility in water logP
2,2,2,Trifluroethanol F3CCH2OH n/a 26.5 Miscible (M) 0.652
dimethylformamide C3H7NO 0.404 37 M -1
hexane C6H14 0.009 1.9 Not miscible 3.5
isopropanol C3H8O 0.546 19.9 M 0.55
cyclopentanol C5H10O n/a 17 Slightly 0.71
glycerol C3H8O3 0.812 43 M -1.76
1,6 hexanediol C6H14O2 n/a n/a M n/a
Table 2. Chemical Structure of organic solvents used in MSCS of Ras.
S,R,S-Bisfuranol
R,S,R-Bisfuranol GlycerolDimethylformamide
2,2,2-Trifluoroethanol
Cyclopentanol
Because the Ras protein binding interface involves charged residues, we used a panel of organic solvents with a wide range of polarities, as measured by relative polarity,
dielectric constant, Total Polar Surface Area (TPSA) and logP measurements of the octanol / water partition coefficient. The dielectric constants of the organic solvents used range from a low of 1.9 for hexane to a high of 43 for glycerol, with the relative order being: HXN < PEN < ISO < TFE < DMF < GLY. All of the organic solvents have a dielectric constant lower than water. TPSA measures the percentage of the molecular surface occupied by polar atoms (Ertl, Rohde, et al. 2000). The relative order of TPSA values for the organic solvents used is similar to the order of dielectric constant values for the organic solvents. Glycerol and bisfuranol have a large amount of electronegative surface area and hexane has no polar surface area. LogP measures the partition coefficient of a molecule between octanol and water(Eros, Kovesdi, et al. 2002). The partition coefficient is used as a standard measure of hydrophobicity. Hydrophobic molecules partition more in the octanol phase, while
hydrophilic molecules tend to partition more in the water phase. Amino acids have a wide range of hydrophobicities, ranging from hydrophobic phenylalanine to hydrophilic arginine and glutamate. We used organic solvents with a similar range of hydrophobicities. LogP values range from a low of -1.76 for glycerol, which partitions primarily in the water phase, to a high of 3.5 for hexane which partitions almost exclusively in the octanol phase, with the relative order being: GLY < DMF < BIR < TFE < ISO < PEN < HXN.
that could be achieved without damaging the crystal. Interestingly, similar maximum concentrations were found for organic solvents used in solvent mapping experiments with Elastase, Ras and Lysozyme (unpublished data). Prior to soaking the crystals in organic solvents, the crystals were crosslinked with glutaraldehyde to increase their stability in the organic solvents and prevent unwanted crystal damage. Crosslinking crystals with
glutaraldehyde is commonly used in solvent mapping experiments, although the
glutaraldehyde concentration and reaction time need to be optimized for different protein crystals. In solvent mapping experiments with Subtilisin Carlsberg, Fitzpatrick et. al. found a very narrow window for optimal crosslinking (Fitzpatrick, Steinmetz, et al. 1993).
Crosslinking at 1% glutaraldehyde resulted in crystal damage during solvent soaks, while crosslinking at 2% resulted in crystals that did not diffract x-rays.
Trifluoroethanol (TFE) is widely used in protein biochemistry as a membrane mimetic and to stabilize protein structures (reviewed extensively in Buck 1998). TFE is particularly adept at stabilizing alpha helical structures in small peptides (Mishraa, Palgunachari, et al. 2001). The ability of small peptides to form alpha helices in TFE correlates with the helical propensity of the amino acids within the peptide sequences. TFE
effects a β-sheet to α-helix transition in β-lactoglobulin protein (Kumar, Modig, et al. 2003)
protein structure. Melnikova et. al. found that soaking two monoclonal antibodies in a range of DMF concentrations (5-40%) resulted in conformational changes around the antigen binding site. Interestingly, this effect was specific for DMF and was not seen with methanol, dimethyl sulfoxide or TFE (Melnikova, Odintsov, et al. 2000). DMF is very polar and has planar character, so it is used as a peptide bond mimic (Ringe & Mattos 1999). Hexane is a nonpolar organic molecule, with no alcohol moiety and has been used in previous solvent mapping experiments (Gao, Maldonado, et al. 1999), (Yennawar, Yennawar, et al. 1994). Hexane is used in computational biology, where computational hexane / water partitions are used to mimic the cytoplasm / membrane interface to examine protein structural changes at the interface. Hexane was used to mimic the non-polar, non-aromatic side chain residues. Cyclopentanol was chosen because its cyclic shape could mimic the non-polar, cyclic protein side chains. Cyclopentanol is an antagonist of ethanol induced disruption of L1 mediated cell-cell adhesion and may act by binding within a hydrophobic protein pocket (Wilkemeyer, Menkari, et al. 2002). Glycerol is widely used as a protein stabilizing agent in
cryo-protection buffers, protein crystallization buffers and protein re-folding buffers and is known to stabilize protein structure in general (Sousa 1995). Refolding experiments with denatured Lysozyme have shown that soaking in neat glycerol allowed regeneration of the native state of the protein (Dong, Huang, et al. 2004). Glycerol is polar, effectively replacing water molecules that interact with protein structure. Two enantiomers,
drug design, and is being used as the major substituent in a new class of HIV protease inhibitors (Koh, Nakata, et al.).
VI. Summary of Dissertation Work
In this dissertation, the following topics will be examined:
Chapter 2 contains the details of all experimental procedures used in the Ras work discussed in Chapters 3-6.
Chapter 3 will examine the bulk effects of three organic solvents, 2,2,2
trifluoroethanol, 1,6 hexanediol and isopropanol, on protein structure, in the context of room temperature studies of Ras crystals which form with the symmetry of space group P3(2)21.
Chapter 4 will discuss the structure of wild type and the Q61L oncogenic mutant of Ras bound to GMPPNP, which was solved from crystals which form with the symmetry of space group R32. This crystal form provided us with a Switch I in the conformation found in the Raps-Raf complex and gives a unique view of the Switch II region undistorted by crystal contacts.
Chapter 5 will discuss the results of MSCS applied to Ras-GMPPNP crystals which form with the symmetry of space group R32. The panel of organic solvents used in this study included: 2,2,2 - trifluoroethanol, isopropanol, glycerol, cyclopentanol,
dimethylformamide, 1,6 - hexanediol, hexane and R,S,R bisfuranol. The high resolution data sets for these studies were collected at 100 K, using synchrotron radiation at a wavelength of 1.0 Angstrom.
Chapter 6 will examine the interactions of two enantiomers, R,S,R and S,R,S
Chapter 7 will examine the structural rearrangements in the active site P-loop of Cdc25B phosphatase that occur in response to oxidation of the active site cysteine residue. This project was unrelated to the main topic of this thesis and therefore was not discussed in this background chapter. An introduction to this work is given at the beginning of Chapter 7. We have obtained a crystallographic time course, as the enzyme goes from its apo state, through the sulfenic (Cys-SO-) intermediate to the stable disulfide. We have also obtained the structures of the irreversibly oxidized sulfinic (Cys-SO2-) and sulfonic (Cys-SO3-) Cdc25B in
CHAPTER TWO
EXPERIMENTAL PROCEDURES Protein expression and purification
Plasmids containing the wt and Q61L mutant H-Ras 1-166 gene are over expressed in E. coli cells. Cells are grown in LB containing 50mg/mL ampicillin and over expression is induced with 0.2 mM IPTG. Cells are grown at 32 OC and induced for 5-6 hours from an OD600 of 0.5-0.7. Cells are pelleted by centrifugation and processed
immediately or stored at -80 OC. Pellets are resuspended in resuspension buffer (9mL/ g cell
paste). Resuspension Buffer: Buffer A + protease inhibitor cocktail. Buffer A: 20mM Tris pH 8.0, 50mM NaCl, 5 mM MgCl2 , 1mM DTT, 5 % glycerol, 20uM GDP. Protease inhibitor
cocktail: 2ug/mL antipain, 1 ug/mL leupeptin, 1ug/mL pepstatin, 1ug/mL E-64, 1mM Pefabloc, 5 mM benzamidine. Cells are lysed by sonication and the insoluble fraction is pelleted by centrifugation. DNA is precipitated from the soluble fraction by slow addition of polyethylenimide to 0.02 %, while stirring at 4 OC and pelleted by centrifugation. Anion exchange chromatography is performed by FPLC with a HiLoad 26/10 Q Sepharose Fast Flow ion exchange column (Amersham Pharmacia). H-Ras elutes as a broad peak between 220 and 280 mM NaCl. Protein pooled from anion exchange is concentrated to 2 mLs and loaded onto a HiPrep 26/60 Sephacryl S-100 High Resolution gel filtration column at a flow rate of 1 ml/min in Buffer A. H-Ras elutes as a single peak centered at 150 mLs. Protein purity is assessed by SDS-PAGE. The GDP nucleotide bound to Ras was exchanged for GMPPNP using published procedures (John, Sohmen, et al. 1990). Protein from the
5mM MgCL2 , 1mM DTT, 20 uM GMPPNP) concentrated to 15-20 mg/mL and used
immediately for crystallization trials or stored as 50 ul aliquots at -80 OC.
Experimental Procedures for Room Temperature Studies
Crystals of H-Ras 166/ GMPPNP which were solved in the space group P3(2)21 were obtained by the hanging drop vapor diffusion method using published conditions (Scherer et al., 1989).
Crosslinking and transfer to organic solvents
Ras crystals were transferred to sitting drop plates containing a solution of 1% gluteraldehyde in the crystallization buffer: 64mM Hepes (pH 7.6), 25 % PEG 1450, 5 mM MgCl2. The crosslinking reaction was allowed to proceed at room temperature for 30
minutes. Crystals were washed with 3 mL of the crystallization buffer without
gluteraldehyde. This solution was exchanged with one containing buffer and an organic solvent: 64 mM Hepes pH 7.6 and either 50% isopropanol, 50% 2,2,2-TFE or 60% 1,6 hexanediol. The exchange was done in a stepwise fashion, increasing the solvent
concentration by 10 % every five minutes until the final concentration is reached, and the crystals were soaked for two hours in the final solutions containing organic solvents at the concentrations specified above, before being mounted in quartz capillaries for data collection at room temperature.
Data Collection, Processing and Structure Refinement
170 mm for all crystals. The data were processed using the HKL package (Otwinowski and Minor, 1997). Initial electron density maps were calculated using a published model of Ras (PDB code 121P) with the Switch II residues, the nucleotide, the Mg2+ and all water
molecules removed (Pai, Krengel, et al. 1990) . The models were refined with CNS (Brunger et al., 1998) using a maximum likelihood target function and all data. Water and organic
solvent molecules were identified using Fo-Fc electron density maps contoured at the 3σ
level and added during the course of refinement.
Experimental Procedures for Cryo Studies of wt and Q61L Ras Crystallization conditions
Crystals solved in the space group R32 were grown by hanging drop vapor diffusion at 18 OC. Crystals of wt H-Ras 166 –GMPPNP form in 5-10 days and grew to an average size of 0.5 mm3. The protein concentration in the drop was 8-10 mg/ml after addition of the reservoir solution. The reservoir consisted of 0.2 M CaCl2, 20% PEG 3350
(PEG Ion Screen condition #7 from Hampton Research). Crystals of the Q61L mutant protein also form in 5-10 days. The protein concentration in the drop was 6-7 mg/ml after addition of the reservoir solution. The reservoir consisted of 800 ul (0.2 M CaCl2. 24-26 %
PEG3350) and 200 ul stabilization buffer with fresh DTT. Crystals of the Q61L mutant often grew from drops containing precipitated protein.
Data Collection and Processing
system mounted on a GX-13 rotating copper anode running at 40kV and 50mA. Final data collection at a wavelength of 1.0 Angstrom was done at Ser-CAT ID-22 beamline at APS (Argonne, IL). Exposure time was from 1 -3 seconds with an oscillation angle of 1 degree and a crystal to detector distance of 120 mm. Frames were indexed and scaled with HKL2000 (Otwinowski and Minor, 1997).
Structure Refinement of aqueous control structure
A protein only model of H-Ras 166 (PDB code 1CTQ), with B-factors set at 30, was used as an initial search model for molecular replacement using the program
Crystallography and NMR System (CNS) (Brunger, Adams, et al. 1998). The program CNS was also used for all reciprocal space refinement with 10% of the unique reflections set aside for the calculation of Rfree (Brunger 1993). A fast direct rotation search gave a unique
solution with a RF-function of 0.0877. The next best solution had a RF-function score of 0.0596. A translation search of the top five rotation peaks also gave a unique solution with a monitor value of 0.35 and a packing score of 0.5283. The next best solution had a monitor score of 0.158 and a packing score of 0.4480. The best solution was applied to generate a model used for 30 rounds of rigid body refinement at 2.5 Angstrom, followed by 30 rounds of rigid body refinement at 2.0 Angstrom. This was followed by a round of simulated annealing, energy minimization and group B-factor minimization in CNS prior to generation of 2Fo-Fc and Fo-Fc electron density maps. Manual rebuilding was done in O and
manual rebuilding. The final wt model was used to phase the Q61L mutant.
Crosslinking and soaking in organic solvents
Crystals were transferred to sitting drop plates containing 50 ul of stabilization buffer. Crystals were washed with stabilization buffer, with at least 3 buffer changes in the sitting drop. Stabilization buffer was exchanged with crosslinking buffer, which consisted of stabilization buffer + 1% glutaraldehyde and crystals were allowed to crosslink for 30 minutes to 1 hour, depending upon the size of the crystal. Crosslinking buffer was
exchanged with stabilization buffer to remove unreacted glutaraldehyde prior to soaking in organic solvents. Organic solvents were added to the concentrations specified and crystals were allowed to soak from 90-180 minutes. For volatile solvents like hexane, cyclopentanol and isopropanol, drops were refreshed frequently to prevent crystal drying. After soaking, crystals were flash frozen in liquid nitrogen for data collection. In the case of cyclopentanol, crystals were transferred to stabilization buffer prior to freezing because of freezing and mounting problems that occurred with the neat solvent.
Structure Refinement of solvent soaked structures
The program Crystallography and NMR System (CNS) was also used for all reciprocal space refinement with 10% of the unique reflections set aside for the calculation of Rfree. (Brunger, Adams, et al. 1998). (Brunger 1993). A protein only model of wt H-Ras 166
B-factor refinement was done in CNS (Jones, Zou, et al. 1991). Residues 61-71 were removed from the initial model and rebuilt in O, along with the waters, ions, GMPPNP and solvent molecules in successive rounds of manual rebuilding. Solvent molecules were not added until the latter stages of refinement. Except for the two bisfuranol molecules, coordinate files for the solvent molecules were taken from previously published structures found in the Protein Data Bank. Coordinate files for the two enantiomers of bisfuranol were generated and energy minimized using Nano-CAD. The Hiccup server was used to generate topology and
parameter files used for energy minimization in CNS from the coordinate files. The topology and parameter files were checked by energy minimization in X-plor, to make sure that no serious distortions would occur during CNS energy minimization runs.
Solvent Site Validation
Organic solvent molecules are small and can be mistaken for water molecules, alternate side chain conformations or spurious electron density artifacts. Often, the organic solvent molecules are not distinguishable until later rounds of solvent refinement. They were
added into Fo-Fc electron density contoured at 3 σ during the last stages of refinement after
several rounds of solvent refinement in which only water and ion molecules were added. Solvent molecules were kept only if the R-factor stayed the same or improved after solvent addition and if the 2Fo-Fc electron density stayed the same or improved after solvent
justifies addition of a solvent molecule, some solvent molecules are not resolved enough to be precisely oriented. In these cases, while it is clear that a solvent molecule is bound, specific interactions at the atomic level cannot be determined. Table 5.1 ranks each solvent by B-factor and fits to 2Fo-Fc electron density. Electron density fits are calculated in CNS as the real space correlation coefficient of each molecule. In general, solvent molecules with B-factors higher than 55 and electron density correlation coefficients less than 0.80 are
DATA COLLECTION, REFINEMENT AND VALIDATION STATISTICS
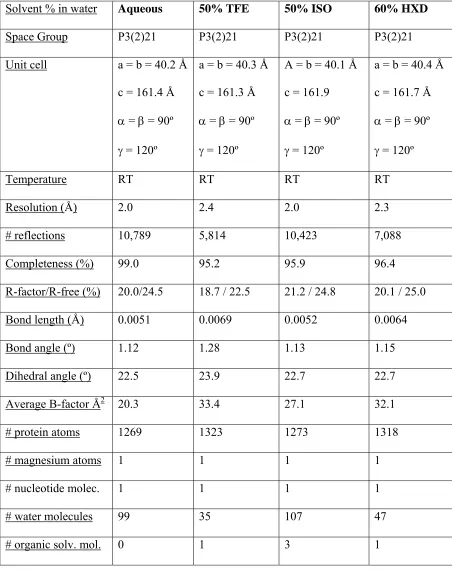
Table 1. Data collection and refinement statistics. Ras structures solved at room temperature in aqueous mother liquor and in the presence of organic solvents.
Solvent % in water Aqueous 50% TFE 50% ISO 60% HXD
Space Group P3(2)21 P3(2)21 P3(2)21 P3(2)21
Unit cell a = b = 40.2 Å c = 161.4 Å
α = β = 90º
γ = 120º
a = b = 40.3 Å c = 161.3 Å
α = β = 90º
γ = 120º
A = b = 40.1 Å c = 161.9
α = β = 90º
γ = 120º
a = b = 40.4 Å c = 161.7 Å
α = β = 90º
γ = 120º
Temperature RT RT RT RT
Resolution (Å) 2.0 2.4 2.0 2.3
# reflections 10,789 5,814 10,423 7,088
Completeness (%) 99.0 95.2 95.9 96.4
R-factor/R-free (%) 20.0/24.5 18.7 / 22.5 21.2 / 24.8 20.1 / 25.0
Bond length (Å) 0.0051 0.0069 0.0052 0.0064
Bond angle (º) 1.12 1.28 1.13 1.15
Dihedral angle (º) 22.5 23.9 22.7 22.7
Average B-factor Å2 20.3 33.4 27.1 32.1
# protein atoms 1269 1323 1273 1318
# magnesium atoms 1 1 1 1
# nucleotide molec. 1 1 1 1
Table 2. Data collection and refinement statistics for Ras/GMPPNP soaked in organic solvents. Solvent (concen.) Crosslinked aqueous soak GLY (70%) PEN (Neat) TFE (50%) HXN (Neat) HXD (60%) BIS (20%) DMF (55%) BIR (90%) Space Group
R32 R32 R32 R32 R32 R32 R32 R32 R32
Unit cell a = 88.73 b= 88.73 c = 135.05 Å
a = b = 90º g = 120º
a = 89.28 b= 89.28 c = 134.70 Å a = b = 90º g = 120º a = 87.63 b= 87.63 c = 134.24 Å a = b = 90º g = 120º a = 88.32 b= 88.32 c = 133.91 Å a = b = 90º g = 120º a = 88.33 b= 88.33 c = 135.13 Å a = b = 90º g = 120º a = 88.79 b= 88.79 c = 135.09 Å a = b = 90º g = 120º
a=88.5 0 b=88.5 0 c=134. 09 a = b = 90º g = 120º a=88.53 b = 88.53 c = 133.09 Å a = b = 90º g = 120º
a =89.14 b = 89.14 c = 133.09 Å a = b = 90º g = 120º
Temperature 100 K 100 K 100 K 100 K 100 K 100 K 100 K 100 K 100 K Resolution
(Å)
1.7 1.6 1.4 1.9 1.52 1.7 1.6 1.7 1.7
# reflections 21,280 26,775 37,214 15,482 30,118 22,253 26,482 22,462 21,657 Completene
ss (%)
93.5 97.4 94.8 95.8 95.8 97.6 98.4 99.2 95.7
R-factor/R-free (%) 18.6/20.2 20.0/21.5 18.8/20.1 18.1/21.0 0.6 18.8/2 18.1/20.8 19.0/21.1 19.6/20.5 20.6/22.8 Bond length
(Å)
0.01 0.004 0.0045 0.009 0.01 0.012 0.01 0.005 0.01
Bond angle (º)
1.44 1.1 1.13 1.43 1.5 2.1 1.5 1.12 1.5
# protein
atoms 1307 1295 1320 1315 1292 1298 1296 1241 1223
# nucleotide atoms
32 32 32 32 32 32 32 32 32
#
Magnesium molecules
1 1 1 1 1 1 1 1 1
# Calcium molecules
3 3 3 3 3 3 3 3 3
# water molecules
136 93 153 119 106 111 119 116 46
Table 3. Data collection and refinement statistics for Ras/GMPPNP crystals soaked in various concentrations of S,R,S bisfuranol (BIS) and R,S,R bisfuranol (BIR).
Solvent (concen.)
BIS (20%) BIR (20%) BIR (50%) BIR (90%) Space
Group
R32 R32 R32 R32
Unit cell a=88.50 b=88.50 c=134.09 a = b = 90º g = 120º
a = 88.02 b= 88.02 c = 133.68 Å a = b = 90º g = 120º
a = 88.04 b= 88.04 c = 133.56 Å a = b = 90º g = 120º
a =89.14 b = 89.14 c = 133.09 Å a = b = 90º g = 120º
Temperature 100 K 100 K 100 K 100 K
Resolution (Å)
1.6 1.6 1.5 1.7
# reflections 26,482 25,886 31,662 21,657
Completene ss (%)
98.4 97.6 98.5 95.7
R-factor/R-free (%) 19.0/21.1 19.0/20.2 19.3/20.6 20.6/22.8 Bond length
(Å)
0.01 0.004 0.004 0.01
Bond angle (º)
1.5 1.1 1.1 1.5
# protein
atoms 1296 1308 1288 1223
# nucleotide atoms
32 32 32 32
#
Magnesium molecules
1 1 1 1
# Calcium molecules
3 3 3 3
# water molecules
119 96 117 46
# solvent
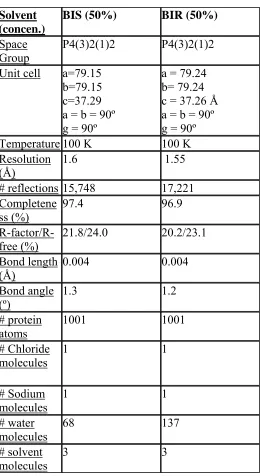
Table 4. Data collection and refinement statistics for hen egg white Lysozyme, crosslinked and soaked in 50% S,R,S bisfuranol (BIS) and 50% R,S,R bisfuranol (BIR).
Solvent (concen.)
BIS (50%) BIR (50%)
Space Group
P4(3)2(1)2 P4(3)2(1)2
Unit cell a=79.15 b=79.15 c=37.29 a = b = 90º g = 90º
a = 79.24 b= 79.24 c = 37.26 Å a = b = 90º g = 90º Temperature 100 K 100 K Resolution
(Å)
1.6 1.55
# reflections 15,748 17,221 Completene
ss (%) 97.4 96.9
R-factor/R-free (%) 21.8/24.0 20.2/23.1 Bond length (Å) 0.004 0.004 Bond angle
(º) 1.3 1.2
# protein atoms 1001 1001 # Chloride molecules 1 1 # Sodium molecules 1 1 # water molecules 68 137 # solvent
Table 5. Data collection and refinement statistics for Ras/GMPPNP Q61L Oncogenic mutant.
Solvent (concen.)
Aqueous Hexane Neat Space
Group
R32 R32
Unit cell a=88.953 b=88.953 c=134.022 a = b = 90º g = 120º
a = 88.23 b= 88.23 c = 134.38 Å a = b = 90º g = 120º Temperature 100 K 100 K Resolution
(Å) 2.0 1.4
# reflections 13,810 38,311 Completene ss (%) 98.3 96.2 R-factor/R-free (%) 19.7/23.4 20.0/20.5 Bond length
(Å) 0.005 0.004
Bond angle (º) 1.1 1.1 # protein atoms 1303 1,291 # nucleotide
atoms 32 32
#
Magnesium molecules
1 1
# Calcium
molecules 3 3
# water molecules 128 100 # solvent molecules 0 2
Rwork = Σ||Fobs| - |Fcalc||/Σ|Fobs|, crystallographic R-factor calculated using 90% of the
reflections against which the model was refined.
Table 6. Data collection and refinement statistics for Oxidation and reduction of Cdc25B
Time soaked in 50um H2O2
C473 state
O minutes
reduced
20 minutes & 90 minute back-soak disulfide 20 minutes Cys-SO1 sulfenic 30 minutes Cys-SO2 sulfinic 80 minutes Cys-SO3 sulfonic
Space Group P212121 P212121 P212121 P212121 P212121 Unit cell a = 50.23 Å
b = 70.99 Å c = 73.90 Å α = β = γ = 90º
a = 50.20 Å b = 71.16 Å c = 73.69 Å α = β = γ = 90º
a = 49.86 b = 71.08 c = 74.30 Å α = β = γ = 90º
A = 49.27 Å b = 70.63 Å c = 73.76 Å α = β = γ = 90º
a = 49.70 Å b = 71.15 Å c = 74.43 Å α = β = γ = 90º
Temperature of data collection
100 K 100 K 100 K 100 K 100 K
Resolution (Å) 1.7 2.0 1.7 2.0 1.7
# reflections 29,364 17,645 29,267 16,387 28,852
Redundancy 7.0 (4.5) 6.7 (6.3) 6.9 (4.4) 3.1 (2.8) 7.2 (6.2) Rsym (%) 6.7 (17.7) 9.0 (46.9) 7.6 (21.8) 8.0 (40.2) 6.2 (38.0)
Completeness (%) 98.6 95.8 98.4 91.1 97.1
Average I/σ 28.3 (7.5) 21.6 (4.5) 23.6 (6.5) 13.5 (2.1) 31.2 (3.8) Rwork/Rfree (%) 17.6 / 19.4 20.8 / 24.5 18.7 / 20.7 20.7 / 23.1 18.6 / 21.0
RMS Bond length deviation from ideal geometry (Å)
0.009 0.005 0.012 0.013 0.012
RMS Bond angle deviation from ideal geometry(º)
1.5 1.3 1.5 1.5 1.5
Ramachandran statistics
97% in favored regions
100% in allowed regions 96% in favored regions 100% in allowed regions 96% in favored regions 100% in allowed regions 97% in favored regions 100% in allowed regions 97% in favored regions 100% in allowed regions
# protein atoms 1,427 1,427 1,428 1,429 1,430
# water molecules
186 110 171 137 198
Table 7. Data Collection and refinement statistics for active site Cdc25B mutants
CDC25B Active Site Mutants
C473D C473S
Space Group P212121 P212121
Unit cell a = 49.89 Å
b = 71.19 Å c = 73.87 Å α = β = γ = 90º
a = 50.25 Å b = 70.93 Å c = 74.06 Å α = β = γ = 90º
Temperature of data collection 100 K 100 K
Resolution (Å) 1.6 1.5
# reflections 34,010 37,967
Redundancy 7.1 (5.9) 4.6(3.5)
Rsym (%) 8 (35) 7 (24.4)
Completeness (%) 96.0 91.0
Average I/σ 32.8 (4.3) 17 (4)
Rwork/Rfree (%) 18.0 / 19.6 19.5/20.7
RMS Bond length deviation from ideal geometry (Å)
0.005 0.005
RMS Bond angle deviation from ideal geometry(º)
1.3 1.2
Ramachandran statistics 97% in favored regions
100% in allowed regions
97% in favored regions
100% in allowed regions
# protein atoms 1,429 1,427
# water molecules
216 183
# Sulfate molecules 0 1
The numbers in parenthesis describe the relevant value for the highest resolution shell.
CHAPTER THREE
Organic solvents order the dynamic Switch II in Ras crystals
Greg K Buhrman, Vesna deSerrano and Carla Mattos
Department of Molecular and Structural Biochemistry, North Carolina State University Raleigh, North Carolina
ABSTRACT
Room temperature crystal structures of crosslinked H-Ras bound to GMPPNP were solved in 50% 2,2,2-trifluoroethanol, 60% 1,6-hexanediol and 50% isopropanol. The disordered Switch II region of Ras is ordered in the presence of 2,2,2-trifluoroethanol or 1,6-hexanediol. The overall backbone conformation of Switch II in these organic solvents is the same as in the Ras-GMPPNP complexes with RalGDS, PI3 Kinase and RasGAP, indicating a
biologically relevant form. Key polar interactions that stabilize the ordered switch are enhanced in the presence of hydrophobic co-solvents. These results suggest that
hydrophobic solvents can be used in general to order short biologically relevant segments of disordered regions in protein crystals by favoring H-bonding interactions between atoms that are highly solvated and mobile in aqueous solution.
INTRODUCTION