A
NEW
METHODFOR
CHARACTERIZING AQUATIC ORGANIC MATTERRussell F. Chnstman, Jian Shi, David Wagoner, Charles Sharpless, Eric Fischer and Jason Schupbach
Department of Environmental Sciences and Engmeering University of North Carolina at Chapel Hill
Chapel fill, North Carolina 27599
"The research on whtch thls report is based was financed by the Water Resources Research Institute of The University of North Carolina. "
"Contents of this publication do not necessarily reflect the views and policies of the Water Resources Research Institute, nor does the mention of any trade names or commercial products constitute their endorsement or recommendations by the Institute or the State of North Carolina."
Acknowledgments
The principal investigator wishes to acknowledge the generous cooperation of Professor F.H. Frimmel's
laboratory at Karlsruhe University, Karlsruhe, Germany, and Professor L.B. McGown's laboratory at
Duke University, Durham, N.C., in providing specialized analytical services to this research project. He
also thanks Dr. Gudrun Abbt-Braun of Karlsruhe University for overseeing the analyses performed in
Karlsruhe, and Celine Gallon for her assistance with the development of the size exlcusion
chromatographic procedures.
Abstract
Natural organic matter (NOM) was isolated from four North Carolina water supplies using a reverse
osmosis technique and subjected to a variety of physico-chemical measurements to evaluate the
hypothesis that NOM produced within a surface body of water (autochthonous NOM) would be
distinguishable from NOM transferred into a surface water body from a surrounding watershed
(allochthonous NOM). Measurements included chromatographic behavior using size exclusion
membranes (medium and high pressure) and in reverse phase high performance liquid chromatography;
ultraviolet-visible absorption spectroscopy; fluorescence spectroscopy including estimation of
fluorescence lifetimes; elemental analysis; amino acid content; disinfection by-product (DBP) production
when exposed to chlorine; and molecular weight and radius by multiple angle laser light scattering.
With the exception of DBP production, the four NOM samples exhibited remarkably similar behavior
with respect to the properties measured. It could not be proven whether this similarity was genuine or
resulted from the properties of the cellulose acetate membrane used in the reverse osmosis isolation.
However, a significant difference was observed between the allochthonous and autochthonous NOM
samples with respect to DBP production. NOM from the two allochthonous sources produced greater
tbtal trihalornethane, total haloacetic acid and total halogenated compound production (per unit C) than
NOM from the two authochthonous sources. The same was true for total haloacetonitrile production and
total hydrolyzable amino acid (as % of total NOM carbon) except the relative production among the two
autochthonous sources was reversed in both cases. The data neither prove nor disprove that NOM from
allocthonous sources has a higher nitrogen content, owing to that seasonal influences were not
investigated in this study.
Multiple angle laser light scattering measurements established that NOM samples isolated via reverse
osmosis were extremely polydisperse with respect to size. Acid digestion of the samples to liberate metal
contaminants greatly reduced polydispersity and yielded weight-average molecular weight values of
TABLE OF CONTENTS
Page
...
Acknowledgments
...
illAbstract
...
vList of Figures
...
ixList of Tables
...
xi...
Summary and Conclusions...
xi11Z Recommendations
...
xv1
.
0 Introduction...
11
.
1 Research Objectives and Approach...
11.2 Characteristics of Natural Organic Matter (NOM)
...
1...
Isolation of Aquatic NOM 2...
Elemental and Structural Composition of NOM Fractions 4...
Molecular Size and Weight of NOM Fractions 5 High Performance Size Exclusion Chromatography (HPSEC)...
6Light Scattering Properties
...
7Fluorescence Emission
...
8Amino Acid Content
...
91.3 Reactivity of NOM
...
10THM Formation
...
10HAA Formation
...
112.0 Sampling and Experimental Procedures
...
132.1 Interlaboratory Cooperation
...
13... 2.2 Selection of Water Supply Sources 13 2.3 Preparation of Glassware
...
13...
2.4 Concentration of Aquatic NOM with Reverse Osmosis 14 2.5 Elemental Analysis...
152.6 Demineralization of Isolated NOM by Digestion
...
162.7 Analytical Methods
...
16Chlorination and DBP Analysis
...
16...
HPSEC Analysis 19...
Light Scattering (MALLS) 20 Spectral Analyses (UV, Fluorescence), HPSEC. TOX-FP. AOX-FP. Amino Acids...
21...
Fluorescence 22...
3.0 Results and Discussion 25 3.1 Carbon Recovery by Reverse Osmosis...
253.2 UV Absorption Behavior
...
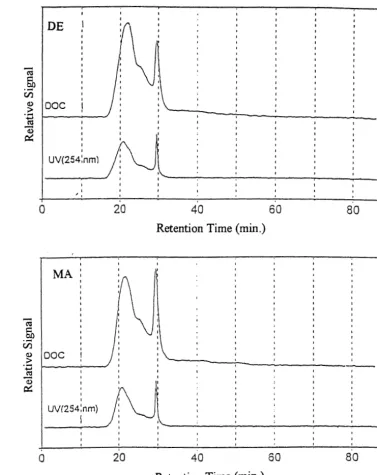
263.3 Chromatographic Behavior
...
26Gel Permeation Chromatography
...
26RP-HPLC (Reverse Phase High Performance Liquid Chromatography)
...
29 3.4 Light Scattering (MALLS) Determination of Molecular Weight and rrns Radius...
32 3.5 Disinfection By-product (DBP) Analysis...
35...
.
36 Amino Acids 37
...
3.7 Fluorescence Behavior 39
...
Undigested NOM Samples 39
...
Digested NOM Samples 41
...
4.0 References 53
5.0 Publications
...
59...
6.0 Abbreviations and Symbols 61
7.0 Appendix
...
637,
List of Figures
Page
1
.
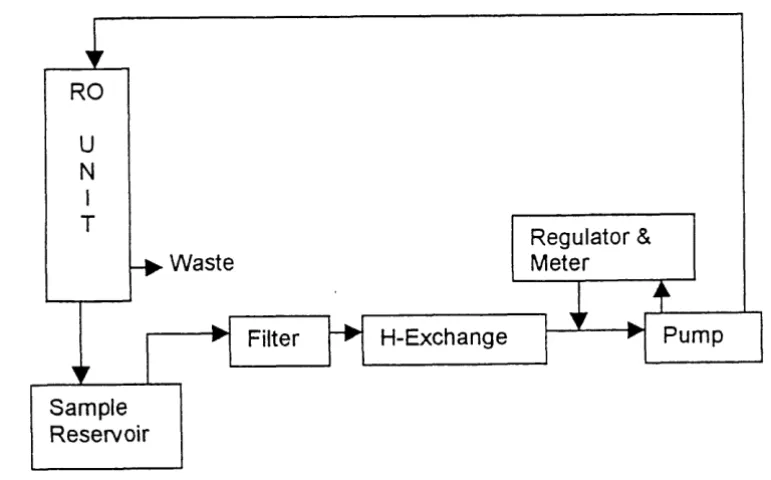
Reverse Osmosis Flow Diagram...
142
.
Gel Permeation Chromatography (Medium Pressure) Lakes DE and MA...
273
.
Gel Permeation Chromatography (Medium Pressure) Lakes HP and UL...
284
.
Gel Permeation Chromatography (High Pressure) Lake DE...
295
.
HPSEC of University Lake (UL) NOM with Light Scattering and Refractive Index Detection 3 1...
6.
Fluorescence Emission of NOM Samples 40...
7.
Fluorescence Lifetimes and Distribution Analysis for Digested DE NOM 42...
8a.
Excitation-Emission Matrices at pH 4 and 6 for Lakes HP and MA 43...
8b.
Excitation-Emission Matrices at pH 4 and 6 for Lakes DE and UL 44...
9a.
Difference Excitation-Emission Matrices for Digested NOM at pH 4 47...
9b.
Difference Excitation-Emission Matrices for Digested NOM at pH 6 48 10a.
Fluorescence Lifetime Distribution for NOM Samples at pH 4...
49List of Tables
Page
Percentage of Carbon Recovery for Reverse Osmosis Unit
...
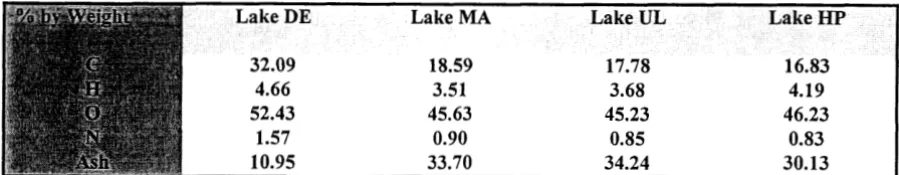
15Elemental Analyses of Isolated NOM
...
16Gas Chromatography Conditions for THM and HAN Analyses
...
18Gas Chromatrography Conditions for HAA Analysis
...
19Elemental Analysis (Ash Free Basis)
...
25Indices of Aromaticity: UV Absorbance Ratios [A254/DOC and A4,&0C]
...
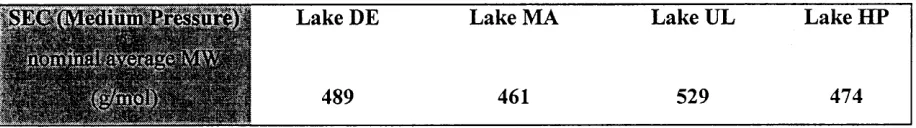
26NOM Molecular Weights by Size Exclusion Chromatography (Medium Pressure) and Relative Elution by Fraction in Normal and Reverse Phase HPL
...
30... Relative Elution Quantities by Fraction for Normal and Reverse Phase HPLC 32 Number.. Weight.. and z-Average Molar Masses and rms Radii for Undigested Aquatic NOM
...
33Number-, Weight-, and z-Average Molar Masses and rms Radii for Digested
...
NOM Samples 34...
THM Formatioo for Aquatic NOM Samples 36 HAA Formation for Aquatic NOM Samples...
36HAN Formation for Aquatic NOM Samples ... 36
Total Halogenated Compound Formation
...
3715 . Amino-acid Content from Acid Hydrolysis
...
38... Amino Acid Carbon and Nitrogen Content in MON by Acid Hydrolysis 39 Time Resolved Measurements of Fluorescence of NOM Samples (Trimodal Discrete Component Approach ... 41
UMC Values for Comparison at pH 4 ... 45
UMC Values for Comparison at pH 6 ... 46
...
Summary and Conclusions
The general physical and chemical properties of isolated NOM from the four lake samples examined in
this study were remarkably similar. It is an open question whether this similarity is genuine or an
artifactual result of the isolation procedure. The data in Table 1 show that approximately one-half of the
carbon was recovered in all samples by the cellulose acetate RO membrane. These values are low owing
to the fact that the high ash values (Table 2) contributed extraneous oxygen to the elemental analyses.
Examination of the data in Tables 1 and 2 demonstrates the effect of ash content upon carbon recovery,
i.e., lower ash content led to higher carbon recovery values. The more ideal membrane employed by Sun
and Perdue (1 995) recovered 70-90% of NOM carbon, with higher recoveries occurring under conditions
of low mineral content. Therefore, it is reasonable to assume that not all of the carbon in our four lake
samples was recovered, raising the possibility that the fraction of NOM recovered was precisely that
fraction which displayed uniform properties.
Other reasoning suggests that the similarity of NOM properties reported in this study is real. For
example, the chromatographic behavior, UV absorptivities and equilibrium fluorescence intensities
measured on the undigested NOM samples is typical of other results gathered by the Karlsruhe group for
NOM samples from fresh water sources. In addition, the chromatographic behavior (gel permeation and
reversed phase C-18) of all samples was quite similar, in our experience, to Suwannee River NOM
isolated with an aromatic polyamide membrane. The fluorescence behavior of the digested NOM
samples was also similar to that of the undigested samples, suggesting that the extensive acid hydrolysis
did not affect the fluorophore content (aromatic content).
The limited number of samples did not permit a detailed evaluation of correlations between water supply
sources and their NOM properties. It was, however, possible to assess the results qualitatively in an effort
to distinguish allochthonous and autochthonous sources. First, for the undigested NOM samples a clear
difference between allochthonous (HP and UL) and autochthonous (MA and DE) sources was evident in
disinfection by-product analyses. For total trihalomethanes (THM), total haloacetic acids (HAA) and
total halogenated compounds, allochthonous sources were higher than authochthonous sources in the
relative order HP>UL>MA>DE. The same was true for total haloacetonitriles, except the order of the
authochthonous sources was reversed, i.e., HP>UL>DE>MA. A similar order was evident in total amino
acid carbon content expressed as percent of total NOM carbon, and total amino acid nitrogen content
expressed as percent of total NOM carbon, i.e., HP>UL>DE (MA not determined). It is evident,
therefore, that total haloacetonitriles corresponds with total amino acid nitrogen expressed as percent of
total NOM carbon (HP>UL>DE), although this association is weakened by the omission of the MA data.
Thus, these data suggest that the HAN disinfection by-product group originates largely from the attack of
chlorine on amino acid moieties in the NOM macromolecular complex. The data neither prove nor
disprove that autochthonous sources exhibit NOM of higher nitrogen content, owing to the uninvestigated
influence of seasonal variation on NOM properties.
The measurement of molar mass and radii findings for NOM samples by multiple angle laser light
scattering is an original contribution of this research. The marked difference in molar mass between the
chromatographically determined values (approximately 500) and MALLS determined values
(approximately 100,000) is intriguing, and suggests that molecules comprising the NOM complex in
aqueous solution may be extensively associated. If this hypothesis is correct, then each discrete
molecular component of NOM is associated with approximately 200 other NOM components in aqueous
solution into aggregates capable of scattering laser light.
Recommendations
The question of whether natural organic matter (uncontaminated with manufactured chemicals) from one
terrestrial surface water source can be distinguished from another remains an open question. Certainly,
NOM from marine sources can be distinguished from fresh water sources, and soil, peat or coal organic
matter can be distinguished from either of these. Such cross-source distinction requires sophisticated
techniques such as nuclear magnetic resonance spectroscopy, and it is not established that even this
technique would permit distinction of samples within the fresh water source category. Present physical
and chemical methods are, as revealed in this research, relatively insensitive to differences in NOM
properties within a category of source. This fact is as much comment on the extensive complexity and
normalization of the humification process as it is a comment on limitations of methods.
Nevertheless, the research described in this report suggests that it may be possible to distinguish NOM
that is predominantly autochthonous from NOM imported into a water body from a watershed
<
(allochthonous). The microbial processes responsible for the production of autochthonous NOM are
likely to leave a mark on the organic nitrogen and carbohydrate content of the NOM produced. A
difference was detected in this study, and difference was also reflected in the DBP production studies.
The methods need expansion, however, and seasonal influences must be evaluated. Specifically, we
recommend:
Comparison of acid hydrolyzable amino acids from NOM isolated from a single source on a monthly
sampling basis. This should be coupled with C, H, N, and 0 elemental analysis of the whole NOM,
and comprehensive analysis of metals in the ash fraction.
Comparison of enzyme hydrolyzable carbohydrates from NOM isolated from a single source on a
monthly sampling basis. This should be coupled with C, H, N, and 0 elemental analysis of the whole
NOM, and comprehensive metal analysis of the ash fraction.
Given the sensitivity of the foregoing methods, it should be possible to concentrate much smaller
samples of water to obtain the required carbon substrate. NOM isolated for the above studies should
be isolated by several techniques simulaneously, avoiding the use of XAD resins: reverse osmosis
with aromatic polyamide membranes, low-temperature vacuum evaporation, and freeze
concentration.
The effect of solution metal composition (from the above metal analyses) on the yield of each isolation
method, amino acid and carbohydrate results, and molar mass and radii by laser light scattering should be
1.0 INTRODUCTION
1.1 Research Objectives and Approach
The primary objective of this research was to evaluate differences in selected fundamental properties of
aquatic natural organic material isolated from North Carolina water supplies of autochthonous and
allochthonous origins, with respect to the organic content. Fundamental properties investigated included
average size, shape and polydispersity of the natural organic molecular mixture by size exclusion
chromatography and by laser light scattering. It was hypothesized that the latter technique might yield
information regarding the actual average molar masses present in aqueous NOM mixtures and that these
values would be larger than those obtained by chromatographic methods. It was also hypothesized that
autochthonous sources might be distinguished from allochthonous sources on the basis of amino acid
content and that this might be reflected in disinfection by-product composition when these waters were
chlorinated.
Several aspects of the research project reported herein changed during the conduct of the research. The
!
overall objective of exploring new methods for characterizing aquatic natural organic matter did not
change, but a combination of early experimental difficulties with capillary electrophoresis and the
unexpected emergence of new instrumental techniques for the determination of molar mass of large
molecules forced a change in the experimental directions. More specifically, this research focused more
on the size and shape of aquatic natural organic matter and not on size and charge as originally proposed.
1.2 Characteristics of Natural Organic Matter (NOM)
Natural organic matter (NOM) is ubiquitous on the earth's surface, and is distributed among reservoirs of
soil, terrestrial surface and ground water and associated riverine and lake sediments (Stevenson 1994).
Except for near shore environments, marine NOM is not derived from terrestrial sources and is,
therefore, not a subject of this research. Globally, terrestrial NOM accounts for variable percentages of
surface soil (generally 0.1 to 5 wt %) and for up to 90% of dissolved organic carbon (DOC) in aquatic
systems (Thurman 1985). Terrestrial NOM also has the significant biogeochemical role of stabilizing the
oxidative portion of the carbon cycle by constituting a pool of reduced carbon that binds nutrients and
influences the effectiveness of numerous drinking water treatment processes and produces, when
chlorinated, by-products of worrisome health concern (Christman et al. 1983).
The degree to which the physico-chemical character of NOM from different water sources may vary is
not known with a desirable level of understanding. Theoretically, the nature of NOM within a specific
water source is dependent on numerous factors, including the type of vegetation and soil geochemistry
in the watershed, as well as biological activity within the water source itself. Aquatic NOM consists of a
complex array of organic structures in various stages of biogeochemical degradation, which includes
amino acids, simple and complex polysaccharides, aliphatic and atomatic acids and a large component of
recalcitrant organio structures generally referred to as humic substances. Owing to the fact that they are
the largest component, and have generally resisted analytical efforts at identification, aquatic humic
substances have received the largest amount of attention. Humic substances have been ambiguously
defined as a general category of naturally occurring, biogenic, heterogeneous organic substances that can
be characterized as being yellow to black in color, of high molecular weight, and refractory (Aiken et al.
1985). As they are largely undefined at the molecular level, humic substances are defined operationally,
e g . , in terms of their solubilities in aqueous acids and bases.
Isolation of Aquatic NOM. Procedures for the isolation of aquatic NOM are not standardized and are the
subject of current research. The one exception is the portion of aquatic NOM (typically 50 wt%) referred
to as humic substances, which can be separated by classical soil methods producing soil-like humus
fractions: humic acids, and fulvic acids. Humic acids are defined as that fraction of humic substances
that is precipitated from aqueous solution when the pH is decreased below 2. Fulvic acids are the
fraction of humic substances that is soluble under all conditions of pH. The classical soil fraction that is
not soluble in basic solution, humin, is of questionable relevance for aqueous solutions. Thus, two
fractions of aquatic NOM may be isolated from any natural water sample; a solid precipitate (at pH 2)
which may be centrifuged or filtered and dried (humic acid) and the remaining water soluble material
(fulvic acid). Unfortunately, large volumes of water must be processed to obtain useful quantities of
these fractions and the fulvic acid fraction must be obtained by tedious freeze concentration or
evaporation. As non-humic carbon is not separated from these fractions, this tiresome procedure is
applicable only to swamp water samples in which 90% of the NOM is humic in nature. Material isolated
in this manner would be expected to be very heterogeneous with respect to chemical composition and
average molecular size. The International Humic Substances Society (IHSS) has recommended the use
humic substances are defined as those water borne organic materials which pass through a 0.45 pm filter
at ambient pH, adsorb to the surface of XAD-8 resin (an aliphatic, nonionic, macroporous,
polymethylmethacrylate resin) at pH 2 and desorb from that surface in 0.1 N sodium hydroxide
(Thurman and Malcolm 1981). Materials which adsorb on XAD-8 are hydrophobic, and those materials
rendered hydrophobic at high proton concentrations must contain acidic functional groups. Basic elution
of the resin thus removes a mixture of hydrophobic acids (humic and fulvic acids). Lower molecular
weight (less hydrophobic) hydrophobic acids and hydrophilic acids may be sorbed by passing the XAD-8
effluent over XAD-4 resin (larger surface area, smaller pore size than XAD-8) after further acidification
to pH 1. A base elution of the XAD-4 column removes any smaller hydrophobic acids that may be
present and the hydrophilic acids. Actually, the latter two groups may be indistinguishable. The effluent
from the XAD-4 column will also contain any hydrophobic or hydrophilic base material.
The most comprehensive fractionation scheme has been proposed by Leenheer (1981). In this
fractionation, water flows through a 0.45 pm filter at ambient pH prior to sorption on XAD and ion-
exchange resins. XAD-8 resin at ambient pH collects a NOM fraction called hydrophobic bases and a
pprtion of NOM fraction referred as hydrophobic neutrals. Hydrophobic bases are eluted from the resin
with 0.1 N hydrochloric acid (HCI). Hydrophobic neutrals are those organics which are not desorbed
with 0.1 N HCI and are eluted from the resin with methanol. The aqueous effluent from the foregoing
XAD sorption is then passed through XAD-8 resin at pH 2 to sorb hydrophobic acids and the remainder
of the hydrophobic neutrals. Hydrophobic acids are then eluted from the resin with 0.1 N NaOH.
Hydrophobic neutrals are those organics which are not desorbed with 0.1 N NaOH and are eluted from
the resin with methanol. The aqueous effluent from the first two XAD sorptions is then passed through
AG-MP-50 cation exchange resin (strong-acid, macroporous, polystyrenesulfonate resin) at pH 2 to
collect a NOM fraction referred to as hydrophilic bases. The hydrophilic bases are removed from this
resin with 1 N ammonium hydroxide (NH40H). Finally, the aqueous effluent from the cation exchange
column is passed through Duolite A-7 anion exchange resin (weak-base, macroporous, polyphenolic
resin) at pH 2 to collect a NOM fraction specified as hydrophilic acids. The hydrophilic acids are
removed from this resin with 3 N ammonium hydroxide. The remaining aqueous solution is defined as
the hydrophilic neutral fraction. It is the fraction of NOM which is removed by none of the above resins.
Resin-based methods have the advantage of providing sample concentration as well as the formation of
more chemically meaningful fractions. They have the significant disadvantage of subjecting the NOM to
several phase changes and to extreme conditions of basicity during extraction as well as to incomplete
More recently, reverse osmosis (RO) has been used to isolate large quantities of NOM from a variety of
more typical surface and ground waters (Sun et al. 1995). Reverse osmosis has the potential advantage
of isolating the majority of NOM without phase changes or exposure to extremely alkaline conditions. If
the membrane can be kept free of fouling caused by the presence of polyvalent cations, this sampling
procedure can achieve a range from 74-96 wt % recovery of NOM. Recovery values are not influenced
by the DOC (dissolved organic carbon) concentration in the source water, the volume of sample
processed
,
or the cation used to replace polyvalent cations. The in-line use of a H+ saturated cationexchange resin will accomplish both cation exchange and partial demineralization since C1- and ~ 0 ~ ~ 2
will be lost as volatile HCl and H2SO4 during the subsequent freeze drying process. For samples high in
silica, Si(OH)4 will cause a serious RO membrane clogging problem. Owing to the different
exclusivities for minerals among the various isolation methods, it is important to know the ash content of
samples submitted for elemental analysis. If ash exceeds 5 wt. %, considerable error will exist in the
measurement of the sample oxygen content because of the oxygen contribution of metal oxides. If the
mineral accumulation problem can be overcome, reverse osmosis isolation has the additional advantage
of concentrating the entire NOM component in a relatively rapid and convenient manner.
3
Elemental and Structural Composition of NOM Fractions
.
The most abundant elements in aquatic humicsubstances in decreasing abundance are carbon, oxygen and hydrogen (Thurman,1985; Reckhow et al.
1990; Aiken et al. 1992; McKnight et al. 1992). with lesser amounts of nitrogen, sulfur, and
phosphorous. For aquatic humic acids, the carbon content varies from 52 to 62 percent, while the
oxygen content varies from 23 to 40 percent. For aquatic fulvic acids, the carbon content varies from 52
to 63 percent, while the oxygen content varies form 29 to 39 percent. Aquatic humic materials contain
more carbon and less oxygen than their soil counterparts, probably because carbohydrates are included in
soil humic isolation procedures (Thurman 1985). The hydrogen-to-carbon ratio (WC) is indicative of the
degree of saturation of carbon atoms and typically increases for aquatic humic materials isolated
increasingly anaerobic environments, e.g., ground water humic substances have higher WC ratios than
stream water humic substances. Aquatic humic materials typically have higher C M ratios than soil
humic materials or sedimentary humic materials, and thus are depleted in nitrogen compared to their soil
or sedimentary counterparts. Although elemental ratios may be useful in distinguishing soil, stream
water, and ground water sources of humic materials, they are generally not regarded as useful for
Aquatic humic substances are highly oxidized organic materials, and the distribution of elemental
oxygen among functional group content has important implications with respect to water chemistry and
drinking water treatment. Studies on the structural composition of aquatic NOM substances, including
functional group content, have been conducted with carbon- 13 nuclear magnetic resonance ( 1 3 ~ NMR)
spectroscopy (Thurman and Malcolm 1983; Leenheer et al. 1987; Norwood et al. 1987; Thorn 1987;
Vassallo et al. 1987; Malcolm 1987, 1989; Reckhow et al. 1990; Aiken et al. 1992; Mcknight et al.
1992; Chin et al. 1994). They have, for example, been used to estimate the percentage of aromatic
carbon in NOM, and the distribution of oxygen among hydroxyl, carboxyl, phenolic and carbonyl
functional groups. The distribution of oxygen content has important implications for chlorination and
coagulation processes in drinking water treatment.
Other research suggests that molar absorbance of ultraviolet light at wavelengths such as 254 nm and 280
nm can be used asca surrogate measure of aromatic carbon content. The molar absorbance (on a carbon
basis) at 280 nm for aquatic fulvic acids varies from 120 to 400 L/cm-mol C (Chin et al. 1994); while
molar absorbance at 254 nm varies from 340 to 520 L/cm.mol C (Reckhow et al. 1990). For aquatic
humic acids, molar absorbance at 254 nm varies from 580 to 890 L/cm-mol C (Reckhow et al. 1990)
,
and 150 to 770 L/cm.mol C for untreated waters. (Edzwald et al. 1985; Collins et al. 1986; Chadik and
Amy 1987; Malley and Edzwald ,1991 ; Amy et al. 1992).
Molecular Size and Weight of NOM Fractions. Biological macromolecules, such as proteins,
polysaccharides, nucleic acids, lignin and humic substances are ubiquitous components of natural
systems. Some of these natural products have well-defined structures and single, or at least closely
grouped, molecular weight values. Others have regular structure but vary in chain length. This results in
a single substance with a range of molecular weights. Even other groups have irregular structures plus a
range of molecular weight values. In addition, many of these macromolecules possess sites of electrical
charge and are therefore referred to as polyelectrolytes. Humic substances are polyelectrolytic, irregular
in structure, and exhibit a range of molecular weights, according to the methods of molecular weight
estimation that have been employed.
Macromolecules which exhibit a single value for molecular weight are said to be monodisperse, with
respect to this property, whereas those which exhibit a range of molecular weights are referred to as
molecular weight value effectively, it is necessary to know the nature of the molecular weight
distribution and/or the related degree of polydispersity.
The molecular size and weight of NOM fractions can be estimated by numerous methods, such as, small-
angle X-ray scattering (Wershaw and Aiken 1985) vapor pressure osmometry (Malcolm 1990; Aiken
and Gillam l989), ultracentrifugation (Visser l985), gel chromatography (or size exclusion
chromatography) (Gjessing 1965; Ghassemi and Christman 1968; Stuermer and Harvey 1974; Davis and
Gloor 1989). Each of these methods depends upon different properties of NOM; employs different
standards for calibration and have often been applied to NOM samples from different sources. As a
consequence, the literature is not clear whether variation in the results has been due to natural
polydispersity or to method-dependent variables.
High Performance Size Exclusion Chromato~raphv (HPSEC). Gel chromatography (gel permeation
chromatography or gel filtration) is a separation technique in with solute molecules are separated
according to their molecular dimensions (Determann 1968; Fisher 197 1). As with other liquid
chromatographic techniques, better separation can often be obtained under pressure, and the advent of
molecular sieve gels that are stable under pressure, has permitted the use of HPSEC. The exclusion
theory is based on the hypothesis that a solute molecule cannot enter all the regions of the solid phase if
it is larger than a certain size. Owing to their less extensive diffusion in the gel phase, larger molecules
are therefore eluted earlier from the column, while the smaller ones are trapped in the pores between the
packing material. The largest molecules are forced to remain in the solvent outside the packing material
or in the outer volume. This volume is therefore called the excluded volume and a solute confined to this
space is said to be excluded. The largest molecules are transported by the mobile phase (solvent flowing
outside of the packings) and pass through the column faster than the medium-sized molecules which
spend more time in the stationary phase (the immobile solvent is inside the hydrated polymer chains).
Very small molecules, which are not hindered in their diffusion, having a small radius compared with the
dimensions of the pores, are the last to elute from the column. The components are eluted in a order of
decreasing molecular size when samples are applied to a HPSEC column.
For molecules with the same shape and similar structures, a relationship exists between size and
molecular weight. For a fixed column configuration, the elution volume is linearly related to the
logarithm of the molecular weight (MW). A calibration curve can be obtained by plotting the elution
unknown can be determined. (Nobili et al. 1989). The foregoing theory neglects confounding factors
(e.g., sorption of the analyte on the stationary phase) and owing to the general unavailability of the
appropriate standards of the same composition and conformation, none of the methods mentioned above
give definitive data on the range of MW characteristics of complex natural products such as NOM.
Nevertheless, the information available shows that aquatic humic acids are 2 to 3 times larger than
aquatic fulvic acids, and both are smaller than their soil organic matter counterparts. The number-
average molecular weight estimates ( colligative property measurements ) of soil and aquatic humic
substances appear to be smaller than weight-average estimates (transport property measurements).
Although aquatic humic substances have lower polydispersity values than soil humic materials, the
inherent polydispersity of aquatic humic materials tends to render average molecular weight values
meaningless unless the polydispersity is reduced by prior size separation.
Light Scattering Properties. Light scattering is one of the few techniques that can determine the absolute
molecular weight of macromolecules. In combination with HPSEC, a light scattering detector can
pr,ovide information on the size and mass of macromolecules, which includes distribution of molecular
weights and mean square radii. For the modem light scattering instrument, a laser is the preferred light
source because it is highly reliable; has supercollimation, focus and a relatively long lifetime; and can
produce light at a single wavelength.
The interaction of light with matter will cause incident light to be scattered, reflected and refracted.
When light interacts with matter, it induces the molecules to a higher energy state. The molecules will
reemit light in different directions upon return to the ground state. If the frequency of the emitted light is
the same as that of the incident light, the process is called elastic scattering; and the following discussion
is limited to this type of light scattering.
Light scattering instruments equipped with multiple detectors at various angles to the incident light beam
are capable of the simultaneous measurement of scattered light intensity as a function of scattering angle.
The technique is referred to as multiple angle laser light scattering (MALLS). The ability to detect
angular dependence is important since the size of a molecule will affect the angular distribution of light
intensity scattered from its surfaces. The weight of a macromolecule can also be determined from the
which is the excess light scattered by the solution at an angle 0, comparing with the light that is scattered
by the pure solvent:
(Equation 1)
Where 10 is the scattered intensity of the solution, 10,solvent is the scattered intensity of the solvent, 10 is
the intensity of the incident beam, V is the volume of the scattering medium, and r is the distance
between the scattering volume and the detector. Note: for the mini-DAWN instruments used in this
research (Wyatt Technology Corporation, CA), the light source is always vertical to the sample.
9
Using theory from the physics of light scattering, it is possible to derive Equation 2 from Equation 1
(Zimm 1948). Equation 2 connects data collected by the mini-DAWN instrument system and the
molecular parameters derived from these data:
In which R(0) is the excess Rayleigh ratio shown above; c is the molecular concentration; M is the
weight-averaged molecular weight; A2 is the second virial coefficient; K t is an optical constant equal to
4n2n02(dn/dc)2/[hO4~~], where no is the refractive index of the solvent, dnldc is the specific refractive
index increment of the dissolved molecules at the same wavelength of light as the light scattering
measurement; NA is the Avogadro's number; and ho is the vacuum wavelength of the incident light. P(0)
is a theoretically derived form factor, approximately equal to 1
-
2p2<r2>/3!+
...
,
where p. =(4n/h)sin(0/2), and <r2> is the mean square radius. P(0) is a function of the molecules7 z-average size,
shape, and structure, from which the mean square radius of the molecules may be determined.
Fluorescence Emission. Electrons excited by the absorption of W or visible light return to the ground
state by non-radiative or radiative pathways. Fluorescence is one of the radiative pathways, and
measurement of such emitted radiation is often a sensitive indication of the chemical of solvolytic
environment of the responsible electronic centers in fluorescing molecules. Ghosh and Schnitzer (1 977)
observed that for soil humic solutions, W radiation in the 370-380 nm range is most effective at
intense fluorescence emission than aqueous soil humus samples as well as a maximum emission at lower
wavelengths. The excitation and emission spectra of purified aquatic humic and fulvic acid fractions
were investigated by Visser (1983). Lower-molecular-weight fractions obtained by ultrafiltration
normally had higher excitation and emission wavelengths and intensities than fractions of higher
molecular weight. Visser observed that fluorescence intensity was more determined by the basic
aromatic structure of the molecules than by functional group content. There was, however, a positive
correlation between the aromatic hydroxyl group content of isolated humic matter and the wavelength of
the main extraction peak. The fluorescence spectra of soil humic fractions of different soil horizons and
their metal complexes have also been examined (Provenzano and Sposito, 1994). Significant differences
observed were attributed by these authors to the formation of more intensely fluorescing Al-complexes,
as well as to increasing degrees of humification with sampling depth in the soil column.
Amino Acid Content. Nitrogen is a major plant nutrient, and is to some degree preserved in aquatic
NOM. Thus, nitrogenous chemical transformation reactions, such as decomposition and
remineralization, are of geochemical concern. Organic nitrogen components are dominated by only a
fe,w classes of compounds, e.g., amino acids, ammonium ion, amino sugars and nucleic acid derivatives.
It is not surprising that amino acids, the building blocks of proteins, make up the largest known reservoir
of organic nitrogen in most living organisms.
Nitrogen is a trace constituent of aquatic humic substances and comprises only 0.5 to 2% of the
elemental analysis. (Thurman and Malcolm 1989). Furthermore, amino acids and simple sugars are
known to condense via the Maillard reaction into brown polymeric substances (Maillard 19 13). This
reaction has been suggested as an important mechanism for the production of autochthonous humic
substances in aquatic environments.
Although amino acid residues are a significant component of the terrestrial nitrogen pool, they appear to
be a minor component of the carbon pool in natural aquatic organic matter (Thurman and Malcolm
1989). The study of amount and distribution of amino acid in humic substances has, therefore, the
potential of yielding information about the organic nitrogen value and hence the characterization of
1.3 Reactivity of NOM
Aquatic NOM has important influences on drinking water treatment processes. These organic materials
consume chlorine, decreasing the disinfection power of the chlorine dose for control of pathogenic
microorganisms or for oxidation of reduced metals such as ferrous iron. In the same time, it reacts with
chlorine and produces a large number of halogenated and non-halogenated organic compounds known as
disinfection-by-products. (Rook 1977; Christman et al. 1983; Stevens et al. 1989). Major DBPs that
under investigation included trihalomethanes (THMs); haloacetonitriles (HANS) and haloacetic acids
(HAAs). Several of these DBPs have been implicated as animal carcinogens and also as human
carcinogens (Bull and Kopfler 199 1).
The nature and extent of interaction between NOM components and aqueous chlorine species such as
hypochlorous acid (HOCl) and hypochlorite (OC1-) depend on numerous factors. The aqueous chlorine
species are electrophiles and tend to react with electron-rich sites in organic structures. Because of this,
the nature of the NOM species present in solution is an important factor in determining the influence of
NOM on the chlorination process. The pH value will also influence not only the electron distribution
within NOM structures but the distribution of aqueous chlorine species. In addition, kinetic competition
between hydrolysis, oxidation and substitution (halogenation ) reactions also establishes that pH is
important in determining the distribution of DBP species. Since some NOM components react with
aqueous chlorine species very slowly at ordinary temperatures, chlorine dose and contact time are also
important variables in determining the rate and extent of reaction between NOM and aqueous chlorine
species. If bromide and iodide are present, aqueous chlorine species can oxidize these halides to reactive
halogen which will then react with NOM.
THM Formation. Many studies have been performed on the influence of organic structure on chloroform
(CHC13) production
.
Based on the amount of chloroform produced per mole of known organic solute,these studies have shown that phenol-activated aromatic solutes are generally the most reactive toward
chlorine (Rook, 1976; Rook 1977; Larson and Rockwell 1979; Nonvood et al. 1987; Boyce and Hornig
1983; Reckhow and Singer 1990; Scully et al. 1988). Significant amounts of chloroform are also
produced by aromatic structures which are activated by amino substituents. Aliphatic compounds
produce less chloroform per mole of solute than activated aromatic compounds, but chloroform
Chloroform formation by untreated aquatic fulvic acids varies from 30 to 130 pg CHC13lmg C (Reckhow
and Singer 1990; Reckhow et al. 1990; Malley and Edzwald 1991). For untreated aquatic humic acids,
chloroform formation varies form 50 to 80 pg CHC13 I mg C (Scully et al. 1988; Reckhow et al. 1990).
Phenolic structures in untreated aquatic fulvic acid appear to be significant precursors for the formation
of organic halides such as chloroform, but other aromatic and aliphatic structures may also be precursors
( Nonvood et al. 1983).
Total THM yield in untreated natural waters varies form 10 to 130 pg CHC13lmg C (Rook 1976;
Collins,et al. 1986; Amy et al. 1987; Reckhow and Singer 1990; Malley and Edzwald 1991; Amy, et al.
1992; Owen, et a1.,1995). Some researchers have evaluated the dependence of THM yield on molecular
weight by using ultrafiltration or size exclusion chromatography to separate bulk water NOM into
different molecular size fractions prior to chlorination. Some of these studies have shown an inverse
dependence between THM yield and molecular weight (Scully et al. 1988; Amy et al. 1992; Owen et al.
1995), while others have shown that THM yield increases with increasing molecular weight (Amy et al.
1987). In some cases, intermediate molecular weight fractions have been shown to have the highest
THM yields (Schnoor et al. 1979; Collins et al. 1985; Semmens and Staples 1986; Sinsabaugh et al.
1986; Chadik and Amy 1987; Amy et al. 1992). This discrepancy in results with regard to the effect of
molecular weight on DBP yield may be due to variations in the chromatographic conditions or to
membrane efficiencies of the various methods.
HAA Formation. In addition to THMs, haloacetic acids (HAA) are also byproducts of chlorination and
chloramination of drinking water. Dichloroacetic acid and trichloroacetic acid are the mostly studied
species and have also been identified as major halogenated species both in laboratory chlorinations of
aquatic humic substances ( Johnson et. al. 1982; Nonvood et al. 1983; Reckhow and Singer 1984) and in
chlorinated drinking water (Uden et al. 1983; Krasner et al. 1989; Reckhow et al. 1990). The
toxicological properties of these compounds are not well understood, but they are of concern to public
health because of their suspected carcinogenicity as well as developmental, reproductive, and hepatic
toxicity (Bull 1992). Five of the HAAs (MCAA, DCAA, TCAA, MBAA, and DBAA) are regulated
under the U.S. Environmental Protect Agency's proposed
Disinfectants/Disinfection
By-products Rule.All the nine species of HAAs have been identified by Pourmoghaddas et al. (1993) as products of
laboratory chlorination of commercial humic acid in the presence of bromide ion. The effect of bromide
2.0 SAMPLING AND EXPERIMENTAL PROCEDURES
2.1 Interlaboratory Cooperation
This research project benefited from analytical cooperation with Professor F.H. Frimmel's laboratories at
the Institute of Water Chemistry, University of Karlsruhe, Karlsruhe, Germany, and with Professor
Gowman's laboratory in the Department of Chemistry at Duke University, Durham, N.C. The
procedures pertinent to each cooperating laboratory are indicated below and the authors express their
appreciation to Dr. Gudrun Abbt-Braun (Karlsruhe) and Charles Sharpless (Duke) for the resulting data.
Professor Christman was able to review the procedures and to coordinate sample preparation and 9
analysis with Dr. Abbt-Braun during his visiting lectures at the University of Karlsruhe in June of 1996.
2.2 Selection of Water c Supply Sources
Four water supply sources (Appendix 1) were selected from a list provided by the Water Quality Section
of the Division of Environmental Management, North Carolina Department of Environment, Health and
*
Natural Resourses. Two water supplies are believed to contain allochthonous NOM, High Point Lake
(HP), High Point, N.C., and University Lake (UL), Chapel Hill, N.C. Two additional water supplies
were sampled which are believed to contain autochthonous NOM, Lake Mackintosh (MA), Burlington,
N.C., and Lake Devin (DE), Oxford, N.C. Each lake was visited with the portable reverse osmosis unit
described below on the following dates; UL, June 20, 1996; HP, June 26, 1996; MA, July 2, 1996; DE,
July 5, 1996.
2.3 Preparation of glassware
Glassware for general laboratory use was soaked in Alconox detergent overnight, rinsed with tap water,
soaked in 10% nitric acid overnight, soaked in distilled, deionized water, then oven dried at 85OC. After
drying, the glassware was either glass stoppered or covered with aluminum foil. This procedure was
repeated every 2 to 3 months. In the time between these rigorous cleanings, glassware that had been used
was rinsed copiously with distilled, carbon-filtered water and oven-dried.
All 40-mL vials used for sample collection, storage and extraction were soaked in detergent overnight,
and oven-dried at 85OC. All plastics (caps, septa, etc. ) were soaked in detergent overnight, soaked in
distilled, deionized water, then oven dried at 52°C.
2.4 Concentration of Aquatic NOM with Reverse Osmosis
Reverse osmosis (RO) can be used to isolate NOM from a large quantity of water very quickly. High
NOM concentration and low inorganic solute concentration have been reported by Serkiz and Perdue
(1990), and Sun et al. (1 995), when applied to typical surface and ground waters. These authors
recommend use of an aromatic polyamide membrane, but owing to the high costs of these membranes, a
membrane already available in our laboratory (cellulose acetate) was employed in this study.
,.
The RO unit employed was obtained from the Hydro Company, Durham, N.C., and was assembled onto
a frame suitable for portable transit. The main components of this unit include a high pressure pump, in-
line filters (0.45 and 0.2 pm), a cellulose acetate membrane, ion-exchange unit, valves and pressure
regulator. The ion-exchanger is a normal filter housing packed with appoximately 500 mL of cation
exchange resin (Dowex 50WX4 50, Aldrich) on the
H+
cycle (Figure 1).+
WasteRegulator &
Meter
I I
I
Filter H-ExchangeFigure 1. Reverse Osmosis Flow Diagram
In normal operation, lake water was pumped through the prefilter and cation exchanger prior to entering
module was discarded, and the retentate solution was continuously recycled into the sample reservoir and
mixed with untreated lake water. The process was continued until any desired concentration level was
achieved. The water level in the sample reservoir was maintained by periodic addition of filtered lake
water. Typically, approximately 5 liters of concentrate was obtained from 200 liters of lake water with
an average flow of 12 L/min of which approximately 30% was permeate. The total volume sampled was
calculated from the flow rate and processing time. The final concentrate was transferred to storage
bottles and returned to the laboratory. Total organic carbon measurements were performed on each
concentrate with a Shimadzu organic carbon analyzer. Concentrates were then freeze dried to obtain the
final solid NOM samples which were weighed, and then sealed in glass vials prior to storage in the dark
at 25°C. All subsequent analyses of isolated NOM were performed on these solids or aqueous solutions
?
prepared from them.
The overall percent recovery of original lake water DOC (Table , 1) in each concentrated sample was
calculated with knowledge of the total volume of lake water processed, the TOC of the concentrate, the
freeze-dried weight yield and the %C of the freeze dried product (from elemental analysis, see below).
t
Table 1. Percentage of Carbon Recovery for Reverse Osmosis Unit
I
Autochthonous Sources Allochthonous SourcesI
2.5 Elemental Analysis
A sample of each freeze-dried NOM sample was sent to Huffman Laboratories, Denver, CO for
Table 2. Elemental Analyses of Isolated NOM
2.6 Demineralization of Isolated NOM by Digestion
9
The freeze-dried NOM samples isolated with the cellulose acetate membrane were subjected to the
following digestion procedure to remove mineral material contributing to ash content. A dry sample of
each was placed in a 40 mL plastic centrifuge tube and 10 mL of HEHCl(3: 1 stock) was added to each.
Tubes were immediately degassed with N2, capped, covered with aluminum foil and placed on a wrist
shaker at 33OC in the dark for 24 hours. Each tube was then centrifuged at 7000 rpm for 10 minutes.
The acid supernatant was decanted and the remaining material was covered with 10 mL of deionized
water and shaken vigorously. The pH of each vial was adjusted to approximately 7 with NaOH and HCl.
The neutralized solutions were filtered (0.45 micron millipore) and dialyzed in 100 MWCO (Spectrum)
dialysis tubing against deionized, carbon filtered water until chloride free. The resulting solutions were
fast frozen (dry ice/ isopropanol) and lyophilized. The final dry material was of similar texture for each
lake sample, a fine light brown powder that was extremely water soluble. Samples of NOM digested in
this manner were submitted to light scattering (MALLS) and fluorescence analysis (Duke University).
2.7 Analytical Methods
Some of the analytical procedures employed in this study were developed and conducted at the
cooperating laboratories of the University of Karlsruhe and Duke University. These are noted where
appropriate. If no notation appears, the procedure was conducted in the laboratories of the principal
investigator.
Chlorination and DBP analysis: Stock chlorine solutions were prepared by dilution of 4-5% NaOCl
concentration was determined by sodium thiosulfate titration according to Method 4500-Cl B ( Standard
Methods 1992)
Raw lake water samples (250 mL) were brought to room temperature prior to chlorination. The sample
was transferred to a 250mL bottle and filled about 3/4 full. A small volume (mL) of the appropriate
amount of NaOCl ( ClIC 2: 1 wt/wt) solution was added to the samples along with 5 mL of 0.05 M
Na2HP04 buffer solution. The 250 mL bottle was then filled to overflowing with additional water
sample, capped and mixed. Bottles were stored headspace-free in the dark at 20°C for 24 hours.
After 24 hours, samples were transferred to separate 40 mL vials with PTFE-faced silicone septa and
I.
screw caps for subsequent THM, HAN and HAA analysis and quenched with sodium sulfite or
ammonium sulfate (HAA). All vials contained preservatives appropriate for the DBPs to be analyzed.
I
The method used in this research for the analysis of trihalomethanes (THM) and Haloacetonitriles
(HAN) is a modification of the method of McGuire et al. (1989). Species of THMs measured were
CHC13, CHBrC12, CHBr2C1, CHBr3 and species of HANS measured were DCAN (Dichloroacetonitrile),
I
TCAN (Trichloroacetonitrile), BCAN (Bromochloroacetonitrile), DBAN (Dibromoacetonitrile), TBAN
(Tribromoacetonitrile).
Standard solutions containing 2 g/L of each THM and 2 g/L of each HAN were purchased from Supelco
mixtures and stored at
-
15°C for no longer than 3 months before use. A stock solution of internalstandard (l,2 - dibromopropane, 5 g/L) was prepared in 10 mL methanol and stored at
-
15OC for no morethan six months.
Two stock solutions of THM were prepared from the 2 g L Supelco standard as were 2 stock solutions of
HAN. Stock solution I was prepared by diluting 25pL of the Supelco mixture into 10 mL MeOH to yield
a target concentration of approximately 5 m g L of each DBP. Stock solution I1 was prepared by diluting
125pL of the Supelco mixture into 5mL MeOH to yield a target concentration of approximately 50 m g L
of each DBP. The pentane extraction solvent was spiked with 50 pglL internal standard.
Dracor water ( deionized, distilled and chlorine demand free) was used to prepare analytical standards.
The appropriate amount of THM and HAN stock solution was added to 100 mL Dracor water to prepare
In the extraction process, 4 mL pentane ( containing intemal standard ) and 6 g of sodium sulfate
(previously baked at 500°C for 24 hrs) were added to each vial. All vials were vortexed for at least 1
minute. The solvent layer was then carefully transferred to a 2 mL autovial and analyzed for THM and
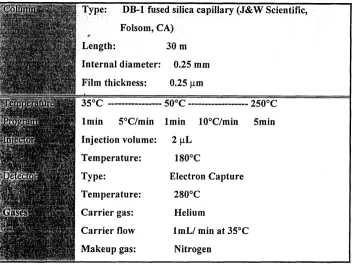
HAN on an HP-5890 Series I1 gas chromatography with an electron capture detector (Table 3).
Table 3. Gas Chromatography Conditions for THM and HAN Analyses
Internal diameter: 0.25 rnm
ilm thickness: 0.25 pm
lmin S°C/min lmin 10°C/min Smin
Injection volume: 2 pL
Electron Capture
lmL/ min at 3S°C
The analytical method for the analysis of Haloacetic Acids (HAAs) was also a modification method of
McGuire et. a1 (1989). The species of HAAs measured were; MCAA, DCAA, TCAA, MBAA, DBAA,
TBAA,BrCIAA, BrC12AA, Br2ClAA.
A stock solution of HAA standards was prepared by gravimetrically measuring 1- 10 g/L solutions of
HAAs in 2 mL MtBE followed by storage at -15OC for no longer than 2 weeks. Stock solutions of
surrogate ( 2,3
-
dibromopropionic acid ) and intemal standard (1,2-
dibromopropane) were preparedgravimetrically to 5- 15 g/L solutions in 10 mL methanol and stored at
-
15OC indefinitely. HAAcalibration solutions (0-200pg/L) were prepared from these stock solutions in methanol. Diazomethane
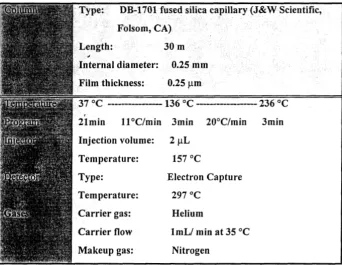
Extraction of methyl esters of HAA was carried out in the vials in acid solution with 5 mL MtBE (containing internal standard) in each vile. Analyses were performed on a HP-5 890 Series I1 gas
chromatography with electron capture detector (see Table 4).
Table 4. Gas Chromatography Conditions for HAA Analysis:
HPSEC Analysis : High-performance size exclusion chromatography (HPSEC) was used to determine
the relative molecular size distributions of NOM in aqueous solution. The HPSEC system consisted of a
Waters 71 7 autosampler, a Waters 600E HPLC system controller (Millipore, Marlborough, Mass), an
Alltech 330 column heater, a Spectroflow 757 UV-VIS detector, and a Waters 470 scanning fluorescence
detector. The two columns employed were a Shodex and a TSK Gel 2000 SWXL (Supelco, length: 30
cm, Diameter, 5 mm). All measurements are made at 30°C.
Preliminary measurements convinced us that distilled water was an unacceptable solvent system for the
solid NOM samples owing to variable elution times when running the phosphate buffer eluent.
Consequently, all HPSEC samples are run at NOM concentration of 20 mg/L dissolved in eluent buffer
[KH2P04 and Na2HPO4 (2.5 mM)]. Freeze-dried NOM samples were dissolved in low organic distilled
sample. Then samples were filtered through a 0.45 pm filter. Residues were discarded, and the clear,
filtered solutions were put in sample vials prior to HPLC analysis. Elution was performed in isocratic
mode with a flow rate of 1 mL1min. The chromatogram is given by the simultaneous monitoring of the
UV absorbance (254 nm) and fluorescence (excitation at 237 nml emission at 440 nm) spectra.
Light Scattering (MALLS): Undigested NOM samples, and digested NOM samples were submitted for
light scattering analysis. For each lake, approximately 100 mg of solid NOM was added to a 40 mL
centrifuge tube to which 10 mL of 0.05 M aqueous phosphate buffer (preparation described below) was
added. The samples were then vortexed and placed in a refrigerator for at least 50 hours to dissolve. The
samples were then vacuum filtered through weighed 47 mm, 0.45 pm supor@ (Gelman Sciences, Ann
Arbor, MI) membrane filters. The filters were dried in a dessicator overnight and weighed again to
determine the amount of retained mass. The concentrations of the stock solutions were corrected by
these amounts. Portions of the stock solutions for each lake were used for the HPSEC-MALLS analyses.
The HPSEC mobile phase consisted of isocratic aqueous 0.05 M phosphate buffer (pH 6.9), prepared
with Na2HP04 and KH2P04. The mobile phase was vacuum-filtered before use through a 0.02 pm
f
Whatman (Maidstone, England) Anodisc 47 mm filter in an all-glass filtration apparatus, and also
filtered on-line through a 25 mm, 0.1 pm Whatman (Maidstone, England) Anodisc filter in a Millipore
(Bedford, MA) stainless-steel in-line filter holder positioned between the pump and injector. The flow
rate was 1 .O mL1min.
The HPLC instrumentation consisted of a Waters Corp. (Milford, MA) 6 16 HPLC pump and 600s
system controller, 717 autosampler with 200 pL injection loop, and temperature control module with
column heater. The silica-packed HPSEC column set consisted of ProgelTM-TSK 4000 SWXL, ProgelTM-
TSK 3000 SWXL, ProgelTM-TSK 2000 SWXL, columns connected in series and mounted in the column
heater box at 30°C. Each of the three columns were 300 mm x 7.8 mm and were obtained from Supelco
(Bellefonte, PA). The measured Ve for this column set was around 14 mL, using aqueous polystyrene
sulfonate (Mw = 990,000 glmole), and the Vi was around 37 mL, using ethylene glycol (62 glmole) in
water. A Wyatt Technology mini-DAWN laser light scattering photometer, using a 690 nm laser, and
o p t i ~ a b @ DSP interferometric refractometer with 690 nm light source operated at 40°C were used for
on-line detection during HPSEC analyses. The data were collected at 1 Hz and processed with Astra v.
4.2 (Wyatt Technology). Normalization of the mini-DAWN detectors at 41 So and 138S0, relative to the
MO) in 0.05 M aqueous phosphate buffer. Triplicate HPSEC injections consisted of 250 pL of the stock
solutions.
Serial dilutions were made using the stock solutions and 0.05 M phosphate buffer to obtain 5
concentrations (ranging from around 1 mgImL to 0.1 mg/mL) for each lake to measure d d d c values.
These measurements were made off-line using the Wyatt Technology Optilab DSP@ interferometric
refractometer operating at 40°C and 690 nm, DNDC@ v. 5.10 (Wyatt Technology) software, Beckman
and Dickinson 10 mL plastic syringes, and a Cole Parmer 74900 series syringe pump, with a flow rate of
0.3 mL/min.
+
Spectral Analyses IUV. Fluorescence), HPSEC. TOX-FP, AOX-FP. Amino Acids These measurements
were obtained at Karlsruhe University (see Section 2.1) and the analytical methods were applied to
aqueous solutions of the undigested freeze-dried NOM samples. The freeze-dried NOM samples were
dissolved in doubly distilled water (ca. 100 mg in 100 mL water), stirred at room temperature and
membrane filtered (cellulose nitrate 0.45pm).
t
i). DOC: Dissolved organic carbon (DOC) was determined after membrane filtration (cellulose nitrate
0.45pm) using a Dohrmann UV-DOC analyzer. The relative standard deviation was
+
3.8%.ii). Spectral Absorbance: The spectral absorbances at h =254 nm and h = 436 nm were measured on a Lambda 5 Perkin-Elmer spectrophotometer using 1 cm quartz cells and doubly distilled water as a
reference. The DOC-concentration was in the range of 4 to 5 mgL. Absorbance at each wavelength is
expressed per unit of DOC, or in ( ~ ) ( m ~ ) - l ( m ) - 1 .
iii). Fluorescence: Fluorescence emission was measured with a fluorescence spectrometer (Perkin Elmer
LSSB) using 1 cm quartz cells. The DOC of the solution was 5 mg/L at a pH of 6.8.
iv). Liquid Chromatography-UV/DOC-detection: The molecular weight distribution was determined
according to Huber and Frimmel (1991); [column: length = 30 cm, radius = 0.8 cm; eluent: 0.025 m o l L
phosphate buffer at a pH of 6.8; flow rate: 1 mL/min; injection: 0.5 mL] using a TSK-HW-40(S) gel and
v). Gel HPLC: A TSK-resin (GI2000 SWXL) was used as stationary phase and a phosphate buffer (2.5
mmol/L, pH 7 ) was used as mobile phase with a flux of 1 mL1min.
vi). C- 18 HPLC: Experiments were carried out using C- 18 resin according to Gremm et al. (1 99 1).
[0.01% HAc (A); CH3CN (B); 0.3 mLImin; gradient: 0 min 99% A; 2 min 70% A; 16 min 15% A and B
= 100% -A].
vii). Chlorination: Laboratory chlorination was done in 0.1 M phosphate buffer at a pH of 7 using
sodium hypochlorite. The dosage of chlorine was 10 mg/L C12 for a DOC-solution of 3 mg/L. After 48 h
the excess sodium hypochlorite was destroyed. The solution was divided in preparation for the THM and
<
AOX analyses.
viii). THM-FP: The THM were analyzed using a GCIECD-system with purge and trap injection
(Chrompack, CP9000). Injection: 10 mL solution; t = 10 min purging; resin: CPSiL 13CP; 25 m x 0.32
mm (d = 1.2 pm), temperature program: 40°C (3 min), 1 "Clmin to 52OC, 1 O°C/min to l62OC; standard deviation:
+
5%.ix). AOX-FP: The determination of the AOX was done using a pyrolysis-unit at 950°C in combination
with a micro-coulometer (Euroglas). Standard deviation
+
8%.x). Amino Acids: Acid Hydrolysis: For the hydrolysis procedure, 2 mL 6 M hydrochloric acid were
added to 2 mL of the sample. The hydrolysis was carried out at 1 10°C for 16 hours. The resulting
solution was thrice evaporated to dryness and then dissolved in water. The residue was dissolved in 0.5
mL water. After a filtration step (0.45 pm cellulose-acetate) the sample was applied for amino acid
analysis.
Fluorescence All fluorescence determinations made at Duke University were performed on digested
samples of isolated NOM. Water used in these experiments was distilled and deionized to achieve a
resistance
of
at least 16 ~ w * c m - ' . Stock solutions of the samples were prepared by placing the driedsolid material in a 25 mL volumetric flask of known mass, weighing to assess the amount added, and
diluting with 0.01 M KC1 (Fluka). These solutions were adjusted to pH 9 (pH meter from Orion
concentrations as determined from the amount added to the volumetric flasks were High Point Lake
(HP),
22 mg/L, Lake Mackintosh (MA), 32 mg/L, University Lake (UL), 20 mg/L, Lake Devin (DE), 40mg/L. These solutions were stored in the dark at 4 0 ~ . Experimental solutions were prepared by diluting
an appropriate amount of the stock solution with 0.01 M KC1 to obtain 7 mL of a 10 m g L solution. The
pH of these solutions was then adjusted to either 4 or 6 with dilute (- 0.01 M) HC1 (Mallinckrodt) and
allowed to sit for one hour before checking and readjusting the pH as necessary. The solutions were then
stored in the dark, overnight (approximately 12 h), until used for experiments the next day.
Steady-state fluorescence spectra were collected on an SLM-Aminco 48000s Phase-Modulation
~~ectrofluorometer.'~xcitation-emission matrices were collected as a series of emission spectra with 4
nm intervals for excitation and emission using entrance and exit slitwidths of 4 and 4 nm for both the
excitation and emission monochromators. Each point in the spectra is the average of 10 measurements.
Data acquisition was performed using an IBM PC-XT with software provided by SLM Instruments.
Analysis of steady-state data was performed using MATLAB software.
Fluorescence lifetime measurements were taken on an SLM model 48000 multi-harmonic frequency
fourier-transform spectrofluorometer equipped with a He-Cd laser (Omnichrome) operated at 325 nm in
continuous wave mode with a power of approximately 29 mW. The theory of frequency domain
fluorescence lifetime measurements is described elsewhere (Lakowicz 1983), but in short, one measures
the emission from a fluorophore under the influence of excitation light whose intensity is modulated
sinusoidally. The emission is then phase shifted and demodulated with respect to the excitation signal,
and these parameters are related to the fluorescence lifetime which may be determined by solving a set of
non-linear equations, with the modulation frequency being the independent variable. Emission was
collected using a combination of long-pass and short-pass filters to achieve a window of 380-560 nm.
Data acquisition was performed on a generic 386 PC with software from SLM Instruments. The scatter
signal from a kaolin solution was used as a lifetime reference. Analysis of phase and modulation data
was carried out using commercially available maximum entropy method (MEM) software run on a SUN
station. Details of this method for determining lifetime distributions have been previously described in
3.0 RESULTS AND DISCUSSION
3.1 Carbon Recovery by Reverse Osmosis
It is clear from the elemental analysis data in Table 2 that the freeze dried aquatic NOM samples
obtained with the cellulose acetate membrane contained large amounts of ash. As mentioned earlier, the
oxides present in amounts of mineral ash over approximately 5% render the oxygen values meaningless.
Oxygen values in the literature (Thurman 1985) for aquatic humic material should be around 40%.
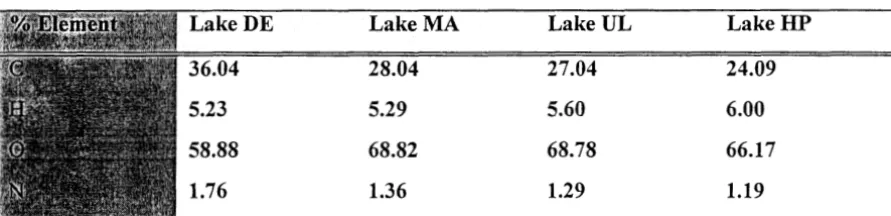
Recalculation of the data in Table 2 on an ash-free basis shows the erroneously high values for oxygen,
and corresponding!y low values for carbon (Table 5).
Table 5. Elemental Analysis (Ash Free Basis: Calculated from data in Table 2)
Lake DE Lake MA Lake UL Lake HP
Physically, the freeze-dried aquatic NOM material was of a dark amorphous character and was not
readily soluble in water. This undoubtedly is the result of mineral contamination. We decided to forego
further elemental analyses on isolated material since the RO unit was operated correctly and these results
are most likely directly attributable to the cellulose acetate membrane. Two alternative experimental
paths were considered, (a) submission of the isolated material to spectroscopic, chromatographic,
sizelshape, amino acid analysis, and DBP formation (undigested), and (b) acid digestion of the isolated
material to solubilize the mineral contaminants followed by dialysis of the digestate mixture to remove
soluble minerals (digested). The first path would yield information regarding the influence of bound
minerals on standard NOM properties with the second path serving as a comparison for the mineral free
organic fraction. Both paths were followed in this research. Unfortunately, it is not possible to calculate
exactly what fraction of original sample carbon was recovered by the cellulose acetate membrane owing
to the uncertainty in the elemental analysis. The data in Table 1 suggest that 43%
-
65% of original3.2 UV Absorption Behavior
Complex organic solutions such as aquatic humic material typically show only end absorption of UV-
VIS radiation. The ratios shown in Table 6 are typical of aquatic humic material which generally
decrease with increasing pH value. Although the A254/A436 values for the autochthonous sources are
higher than those for the allochthonous sources, the differences are within the analytical precision of the
method.
Table 6. Indices of Aromaticity: UV Absorbance Ratios [A254/
![Table 6. Indices of Aromaticity: UV Absorbance Ratios [A254/DOC and A436/DOC]](https://thumb-us.123doks.com/thumbv2/123dok_us/1183719.1148770/42.619.61.501.251.397/table-indices-aromaticity-uv-absorbance-ratios-doc-doc.webp)