ABSTRACT
LUCAS, BRADLEY EARLE. Behavior of Adhesive Materials in Screening Devices for Paper Recycling. (Under the direction of Richard A. Venditti and Hasan Jameel.)
BEHAVIOR OF ADHESIVE MATERIALS IN SCREENING DEVICES FOR
PAPER RECYCLING
by
BRADLEY EARLE LUCAS
A dissertation submitted to the Graduate Faculty of
North Carolina State University
in partial fulfillment of the
requirements for the Degree of
Doctor of Philosophy
DEPARTMENT OF WOOD AND PAPER SCIENCE
Raleigh
2003
APPROVED BY:
_________________________ _________________________
_________________________ _________________________
DEDICATION
I would like to dedicate this dissertation to my parents Dr. Leon T. Lucas and Joy
BIOGRAPHY
Bradley Earle Lucas was born October 4, 1974, in Raleigh, NC. He grew up in
Raleigh and graduated from Athens Drive High School in the Spring of 1993. He started
his education at North Carolina State University in the Fall of 1993. He graduated from
North Carolina State University in December of 1997 with a B.S. degree in Pulp and
Paper Technology and a B.S. degree in Chemical Engineering. He began his graduate
studies in January of 1998 in the Department of Wood & Paper Science at North Carolina
ACKNOWLEDGEMENTS
The author would like to thank his advisors Dr. Richard A Venditti and Dr. Hasan
Jameel for their advice and guidance during his research. Special thanks are also
extended to Dr. Saad Khan and Dr. Martin Hubbe for their advice and support as
members of the advisory committee. The author would also like to thank Dr. Hou-min
Chang, Dr. John Heitmann, Dr. Medwick Byrd, Dr. John Kadla, and Dr. Joel Pawlak for
their assistance. The economic support of Ecosynthetix for this research is greatly
appreciated. Lastly, the author would like to thank the departmental staff and his fellow
TABLE OF CONTENTS
Page
LIST OF TABLES………ix
LIST OF FIGURES………..xi
LIST OF PUBLICATIONS ARISING FROM THIS RESEARCH………..xvi
CHAPTER 1 INTRODUCTION……….1
CHAPTER 2 RESEARCH OBJECTIVES………...31
CHAPTER 3 BEHAVIOR OF PRESSURE SENSITIVE ADHESIVE MATERIAL IN INDUSTRIAL PRESSURE SCREENS AND LABORATORY SCREENS……….33
Abstract………..33
Background……….…...34
Experimental………..36
Results and Discussion………..43
Conclusions……….…...52
Acknowledgements……….…...53
References……….…….53
CHAPTER 4 THE BREAKAGE OF PRESSURE SENSITIVE ADHESIVE CONTAMINANTS IN PAPER RECYCLING OPERATIONS……….56
Abstract………..56
Introduction……….…...57
Experimental………..59
Results and Discussion………..64
Conclusions……….…...77
References………..78
Acknowledgements……….…...80
CHAPTER 5 BREAKAGE AND EXTRUSION OF PRESSURE SENSITIVE ADHESIVES IN INDUSTRIAL AND LABORATORY SCREENING PROCESSES……….…...81
Abstract………..81
Introduction……….…...82
TABLE OF CONTENTS (cont.)
Page
Results and Discussion………..84
Conclusions……….…...94
References………..95
Acknowledgements……….…...96
CHAPTER 6 PASSAGE OF PRESSURE SENSITIVE ADHESIVE PARTICLES THROUGH A FINE SLOT………..…..97
Abstract………..97
Introduction……….…...98
Experimental……….…...100
Results and Discussion……….…...102
Recommendations……….…...112
Conclusions………..112
Acknowledgements……….….113
References……….…...113
CHAPTER 7 FACTORS IN THE PASSAGE OF PRESSURE SENSITIVE ADHESIVE PARTICLES THROUGH A SLOT………...116
Abstract……….…...116
Introduction………..117
Experimental……….…...118
Results and Discussion……….…...121
Conclusions………..134
Acknowledgements………..134
References……….…...134
CHAPTER 8 THE EFFECTS OF ADHESIVE PROPERTIES ON ADHESIVE PARTICLE BREAKAGE AND PASSAGE DURING PAPER RECYCLING OPERATIONS………..….136
Abstract……….…...136
Introduction………..137
Experimental……….…...140
Results and Discussion……….…...146
Conclusions………..159
References……….…...160
TABLE OF CONTENTS (cont.)
Page
CHAPTER 10
FUTURE RESEARCH………..164
APPENDIX……….166
APPENDIX 1
FOURIER TRANSFORM INFRARED ANALYSIS OF ADHESIVE
FILMS.………167
APPENDIX 2
DYEING METHODS FOR THE ANALYSIS OF ADHESIVE
CONTAMINANTS IN PULP…...………175
APPENDIX 3
EXAMPLE OF IMAGE ANALYSIS OUTPUT……….177
APPENDIX 4
STATISTICAL ANALYSIS USING SAS SYSTEMS………179
APPENDIX 5
UCAR LATEX 9165 MATERIAL SAFETY DATA SHEET………191
APPENDIX 6
UCAR LATEX 9175 MATERIAL SAFETY DATA SHEET………203
APPENDIX 7
RHEOMETRICS SOLIDS ANALYZER II (RSA II)………216
APPENDIX 8
TACK OF ACRYLIC AND SIS ADHESIVE FILMS………...217
APPENDIX 9
MICROSCOPIC IMAGES OF ACRYLIC ADHESIVE PARTICLES…………...218
APPENDIX 10
MICROSCOPIC IMAGES OF SIS ADHESIVE PARTICLES………….………...221
APPENDIX 11
DIFFERENTIAL SCANNING CALORIMETRY OUTPUT FOR UCAR
FILMS……….224
TABLE OF CONTENTS (cont.)
Page
APPENDIX 13
ADHESIVE FORMULATION PARTICLE SIZE SAS VERSION 8
RESULTS………..……….230
APPENDIX 14
PRESSURE DIFFERENCE AT PASSAGE VERSUS PARTICLE
DIMENSIONS………....236
APPENDIX 15
ADHESIVE FORMULATION PARTICLE PASSAGE SAS VERSION 8
RESULTS………...……239
APPENDIX 16
PARTICLE PASSAGE THROUGH A SLOT BY PARTICLE
BENDING OR PARTICLE EXTRUSION……….249
APPENDIX 17
LIST OF TABLES
Table Page
1-1. Typical Formulations for a Block Copolymer PSA……….6
1-2. Typical Formulations for an Acrylic PSA………...7
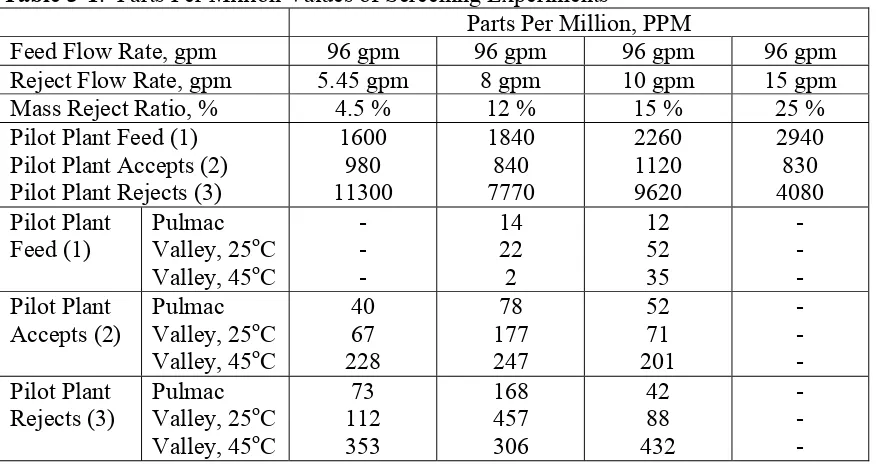
3-1. Parts Per Million Values of Screening Experiments……….44
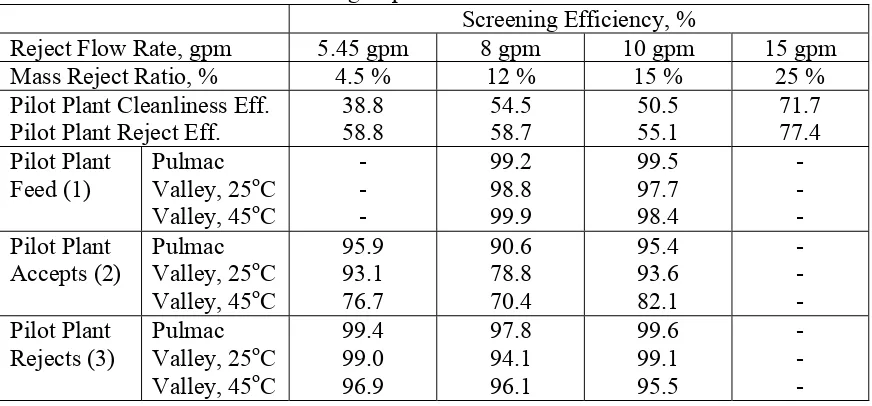
3-2. Efficiencies of Screening Experiments………..45
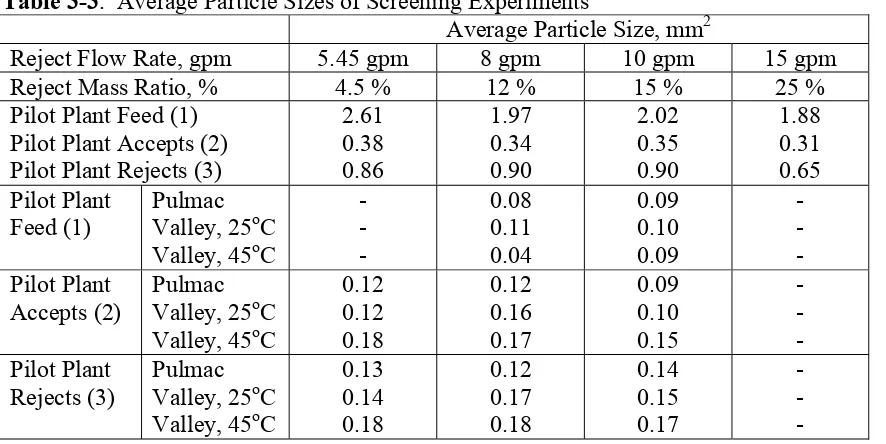
3-3. Average Particle Sizes of Screening Experiments……….…...47
3-4. Pump/Screen Experiment for Reject Rate of 15 gpm ………51
4-1. Statistically Designed Experiments………...67
4-2. SAS Modeling Results for Backward Elimination……….…...70
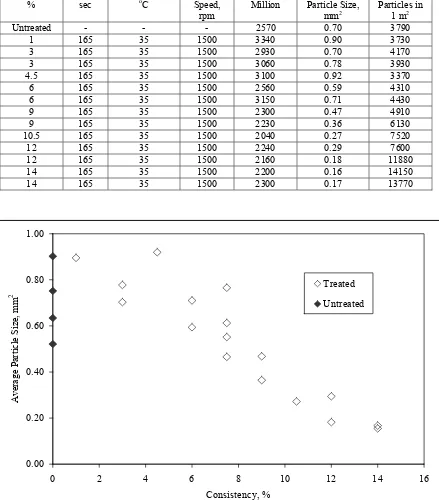
4-3. Consistency Experiments………...72
4-4. Contaminant Size Distributions for the Consistency Experiments………….…...74
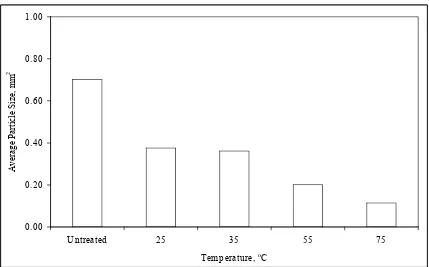
4-5. Temperature Experiments………..76
5-1. Industrial Screening Results………..85
5-2. Laboratory Results With Industrial Feed Pulp………...86
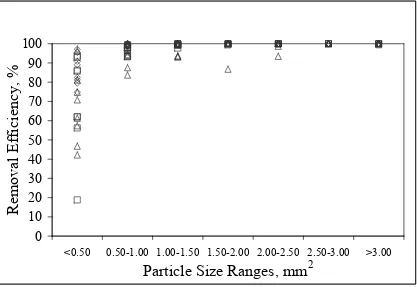
5-3. Removal Efficiencies of the Industrial and Laboratory Screens for Different Particle Size Ranges……….…...88
5-4. Breakage of Adhesive Particles in Various Equipment Combinations………….88
5-5. Average Particle Size for Different PSA Materials from the Laboratory Pulper and Mixer……….90
5-6. Industrial Screening Accepts as the Feed in the Laboratory Screens……….…...92
5-7. Removal Efficiency of the Valley Flat Screen at 25oC and 45oC for Two Different Adhesives……….…...93
LIST OF TABLES (cont.)
Table Page
8-1. Concentrations of Base Polymers and Tackifiers in Adhesive Solutions….…...141
8-2. Image Analysis Results for Eight Different PSA Materials………146
8-3. Properties for Eight Different PSA Materials………..149
8-4. Particle Passage and Average Particle Dimensions for Eight Different
Adhesive Formulations……….…...152
A16-1. Single Slotted Screening Results for Two Different Slot Orientations………...256
LIST OF FIGURES
Figure Page
1-1. Diagram of a Pressure Screen………12
1-2. Typical Rotor Shapes for Pressure Screens………...13
1-3. Flow Designs for Pressure Screens………13
1-4. A Pressure Pulse in a Pressure Screen………...14
3-1. Flow Diagram of the Pilot Plant Screening Experiment………37
3-2. Flow Diagram of the Pilot Plant Pump Experiment………..39
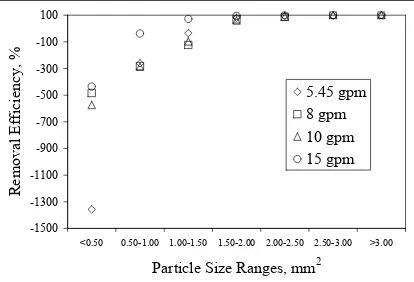
3-3. Removal Efficiency Versus Particle Size for the Pilot Plant Pressure Screen……….……49
3-4. Cleanliness Efficiency Versus Particle Size for the Laboratory Screens………..50
3-5. Particle Size Distribution Before and After the Pilot Plant Pump and Screen……….……52
4-1. Top View of the High Shear Laboratory Device………...60
4-2. PPM Versus Particle Size for Untreated Sample and Sample Treated at Low Conditions………..65
4-3. PPM Versus Particle Size for Untreated Sample and Sample Treated at High Conditions……….66
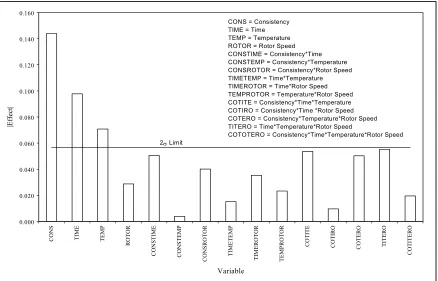
4-4. Pareto Chart for Average Particle Size………..68
4-5. Pareto Chart for Number of Particles in 1 m2 ………68
4-6. Average Particle Size Versus Consistency……….…...72
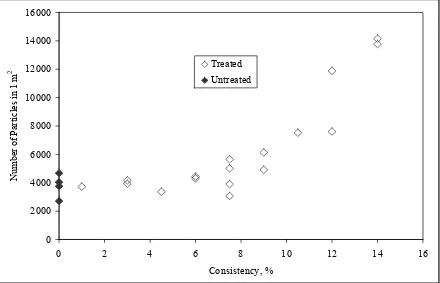
4-7. Number of Particles in 1 m2 Versus Consistency………..73
4-8. Average Particle Size Versus Initial Temperature……….76
4-9. Particle Size Distribution for Temperature Experiments………...77
LIST OF FIGURES (cont.)
Figure Page
5-2. Removal Efficiency Versus Average Particle Size of the Feed in the
Valley at 45oC………91
5-3. Flow Diagram of Industrial Screen Accepts as the Feed for the Laboratory Screens……….…...92
5-4. Removal Efficiency Versus Particle Size Ranges for Different Adhesive Samples………..94
6-1. Laboratory Single Slot Apparatus………..…..100
6-2. Cross-section View of the Slot Showing Important Dimensions in mm……….100
6-3. Average Fluid Velocity in the Slot Versus the Square Root of the Pressure Difference Across the Slot………103
6-4. Photo-micrograph of a “string-like” PSA Particle……….…..104
6-5. Photo-micrograph of a “ball-type” PSA Particle……….104
6-6. Percentage of PSA Particles that Passed Through the Slot Versus the Smallest Particle Dimension (Width) for Different Temperatures……..106
6-7. Pressure Needed to Force the PSA Particle Through the Slot Versus the Smallest Particle Dimension (Width)………108
6-8. Schematic Drawing of a Particle with a Non-constant Radius as the
Pressure Difference Increases Across the Slot…...………..109
6-9. Average Pressure Difference Versus Average Particle Width………110
6-10. Passing Pressure Versus Longest Particle Dimension (Length)………..111
7-1. Number of Particles in 1 m2 and Average Particle Size for Particles >0.04 mm2 Versus Pulping Time……….122
7-2. Particle Distribution Versus Particle Size (>0.04 mm2) from Image
Analysis Data……….…..122
LIST OF FIGURES (cont.)
Figure Page
7-4. Particle Distribution Versus Particle Area from Manual Particle Analysis Data……….…..124
7-5. Average Particle Dimensions Versus Pulping Time from Manual Particle Analysis………..125
7-6. Particle Passage Versus Particle Length at Different Operating Temperatures……….…..126
7-7. Particle Passage Versus Average Particle Width at Different Operating Temperatures………..127
7-8. Particle Passage Versus Average Particle Thickness at Different Operating Temperatures………..127
7-9. Particle Passage Versus Calculated Particle Area at Different Operating Temperatures………..128
7-10. Cumulative Particle Passage Versus Particle Area for Different Pulping Times………..129
7-11. Cumulative Particle Passage Versus Pressure Difference for Different Operating Temperatures………...130
7-12. Particle Length Before and After Particle Passage Through the Slot
(50oC).………..131
7-13. Particle Width Before and After Particle Passage Through the Slot (50oC).…...131
7-14. Particle Thickness Before and After Particle Passage Through the Slot
(50oC).………..132
7-15. Particle Area Before and After Particle Passage Through the Slot (50oC)……..132
8-1. Cumulative Number of Particles Versus Particle Size Based on Image
Analysis of Dyed Handsheets………..147
8-2. AC Adhesive Particle Image………148
LIST OF FIGURES (cont.)
Figure Page
8-4. Calculated Average Particle Size Versus Actual Average Particle Size…….….151
8-5. Cumulative Particle Size Distribution for Particle Area Measured Manually Using a Microscope……….153
8-6. Cumulative Particle Passage Versus Particle Area………..154
8-7. Particle Passage Versus Adhesive Material Yield Strain………...….155
8-8. Particle Passage Versus Adhesive Material Yield Stress………...……….155
8-9. Particle Passage Versus Adhesive Material Modulus………..156
8-10. Calculated Versus Actual Particle Passage Using Yield Stress………...157
8-11. Calculated Versus Actual Particle Passage Using Yield Stress and Area……...158
A1-1. FTIR Spectrum for Avery Dennison Product Number 5164...………168
A1-2. FTIR Spectrum for Avery Dennison Product Number 5263...………169
A1-3. FTIR Spectrum for Avery Dennison Product Number 5265...………170
A1-4. FTIR Spectrum for Avery Dennison Product Number 6465...………171
A1-5. FTIR Spectrum for Avery Dennison Product Number 8165...………172
A1-6. FTIR Spectrum for an Acrylate Based PSA Film…………....………173
A1-7. FTIR Spectrum for a SIS Based PSA Film………...………174
A7-1. Two RSA II Sample Holder Fixtures with an Adhesive Film in Between Them………....………216
A11-1. Differential Scanning Calorimetry Output for UCAR 9165………224
A11-2. Differential Scanning Calorimetry Output for UCAR 9165………225
A11-3. Differential Scanning Calorimetry Output for UCAR 9175………226
LIST OF FIGURES (cont.)
Figure Page
A12-2. Stress Versus Strain for Adhesive Films Containing BA-EA……….229
A12-3. Stress Versus Strain for AC and SIS Adhesive Films……….229
A14-1. Pressure Difference at Passage Versus Particle Length.……….237
A14-2. Pressure Difference at Passage Versus Average Particle Width……….237
A14-3. Pressure Difference at Passage Versus Average Particle Thickness..………….238
A14-4. Pressure Difference at Passage Versus Particle Area.……….238
A16-1.Particle Orientation with Respect to the Slot Length………..254
LIST OF PUBLICATIONS ARISING FROM THIS RESEARCH
CHAPTER 3
Lucas, B. E., Venditti, R. A., and Jameel, H., “Behavior of Pressure Sensitive Adhesive Material in Industrial Pressure Screens and Laboratory Screens”, Tappi Journal, 84(5):70, 2001.
CHAPTER 4
Lucas, B. E., Venditti, R. A., and Jameel, H., “The Breakage of Pressure Sensitive Adhesive Contaminants in Paper Recycling Operations”, 2000 Tappi Pulping/Process & Product Quality Conference Proceedings, Boston, MA, TAPPI Press, November 2000.
CHAPTER 5
Lucas, B. E., Venditti, R. A., and Jameel, H., “Breakage and Extrusion of Pressure Sensitive Adhesives in Industrial and Laboratory Screening Processes”, 2001 Tappi Pulping Conference Proceedings, Seattle, WA, TAPPI Press, November 2001.
CHAPTER 6
Flanagan, J., Venditti, R., Jameel, H., Wilson, N., Weaver, N., and Lucas, B., “Passage of Pressure Sensitive Adhesive Particles Through a Fine Slot”, Progress in Paper Recycling, 11(3):17-23, 2002.
CHAPTER 7
Lucas, B. E., Venditti, R. A., and Jameel, H., “Factors in the Passage of Pressure Sensitive Adhesive Particles Through a Slot”, 2002 Tappi Fall Conference & Trade Fair Proceedings, San Diego, CA, TAPPI Press, November 2002.
CHAPTER 8
Lucas, B. E., Venditti, R. A., and Jameel, H., “The Effects of Adhesive Properties on Adhesive Particle Breakage and Passage During Paper Recycling Operations”, Progress in Paper Recycling, accepted for publication, 2004.
ADDITIONAL PUBLICATIONS
CHAPTER 1
INTRODUCTION
Paper Recycling
In the early 1990’s, the disposal of solid waste material became a significant
problem that needed to be addressed by the United States [1]. Between the early 1980’s
and the early 1990’s, the landfill disposal capacity of the United States decreased,
causing the average cost of waste disposal to quadruple. More wastepaper was collected
in landfills than any other type of material, but wastepaper had the highest percentage of
material that was recycled. So, the demand for recycled paper increased in the United
States in order to decrease waste disposal and paper recycling became more significant
for the paper industry. Also, recovered wastepaper was exported to other countries where
the virgin fiber supply was limited, to further decrease the amount of waste material for
disposal in the United States [1,2].
Upon recovery of wastepaper, the material is processed so that the paper fibers
can be reused in papermaking [3]. The wastepaper is collected and then sorted at a
sorting facility, to improve the wastepaper quality before it is used at a recycle mill. The
sorted wastepaper is then processed at a recycle mill by pulping, screening, and cleaning.
Other equipment may be used in the process, depending on the wastepaper quality and
Contaminants in Recycled Paper
Wastepaper generally contains materials, other than paper fibers, that is not
desired in the final paper product, referred to as contaminants [2,3]. Removal of
contaminants is essential in the recycling of wastepaper for acceptable paper production.
Three sources of contaminants in wastepaper are paper mill additives, converting
additives, and consumer debris [3]. Paper mill additives are added to the paper furnish
during production and consist of fillers, dyes, and strength agents. Converting additives
are added to the paper during the converting of the paper mill product into the final
product and consist of inks, adhesives, and staples. Consumer debris consists of any
contaminant added to the paper by the consumer.
Methods for controlling contaminants in wastepaper consist of quality control,
mechanical removal, and mechanical dispersion [3]. Quality control of wastepaper
involves inspecting bales of wastepaper for cleanliness. Mechanical removal involves
centrifugal cleaners and fine screens to remove the contaminant particles from the paper
fibers. Mechanical dispersion involves kneaders breaking down contaminant particles to
sizes that can be removed by washing and flotation.
Adhesive Contaminants in Paper Recycling
One of the most troublesome contaminants in paper recycling is adhesive material
[3]. Wastepaper usually contains adhesive material in stamps, labels, and envelopes
[3-7]. When wastepaper is repulped, the adhesive material is broken down into small
particles called sticky contaminants or stickies [3,6,8-10]. Stickies cause problems in the
dirt in the final product and reclaimed pulp [3,5,11-15]. Reported methods for removing
stickies from recycled fiber are screening, cleaning, flotation, and washing, each with
their own levels of effectiveness [3,5,10,12,15-19].
Stickies have been reported to cost the paper industry almost $700 million per
year due to downgrading of the product, mill downtime, and waste disposal [20]. The
cost of downgrading is a result of customers refusing to pay the full cost of the product
due to the presence of stickies particles. The cost of mill downtime is due to stickies
causing breaks in production, decreasing the total amount of product that could be sold.
The cost of waste disposal is the cost of landfilling the material rejected during the
processing of recycled material.
The two size categories commonly used for stickies classification are “macro”
and “micro” [11,21-23]. Macro stickies are defined as the stickies that are retained on a
0.006 inches slotted laboratory screen, whereas micro stickies pass through the slots of a
0.006 inches slotted laboratory screen [11,24,25]. The macro stickies collect on the
screen and are analyzed, while the micro stickies flow through the screen and remain
with the accepted pulp [5,21-23]. By definition, laboratory screens remove 100% of the
macro stickies [21,22]. Micro stickies may agglomerate and deposit on the paper
machine, resulting in breaks and downtime [5,21]. In practice, optimizing the pulping
process to minimize the generation of micro stickies will improve the removal of
Pressure Sensitive Adhesives
One very difficult to remove class of adhesive is the pressure sensitive adhesive
(PSA) [6]. Pressure sensitive adhesives are commonly used in tapes, stamps, labels, and
envelopes [6,26]. Pressure sensitive adhesives are defined as “permanently tacky and
will adhere to a variety of dissimilar surfaces upon contact” [9].
During the pulping process, pressure sensitive adhesive materials break down into
a variety of shapes and sizes that require different types of removal equipment
[6,9,10,13,16]. Pressure sensitive adhesive particles commonly have a specific gravity
near 1.0, resulting in low removal efficiency by centrifugal cleaners [4,6,12,13,16,27].
The glass transition temperature (Tg) for pressure sensitive adhesives is usually below
room temperature [8,9]. Also, pressure sensitive adhesive particles are deformable and
elastic at high temperature and pressure [9,13,16]. It has been proposed that these
properties allow stickies to change shape and pass through screens, lowering the removal
efficiency [4,6,8,9].
United States Postal Service Program
In 1994, the United States Postal Service (USPS) implemented a program entitled
“Environmentally Benign Pressure Sensitive Adhesives (PSA) for Postal Applications” to
develop adhesives, that have little effect on the environment, for use on stamps [28]. An
environmentally benign pressure sensitive adhesive does not cause significant problems
during the recycling process. In the program, adhesive manufacturers submitted products
to be evaluated for performance on stamps and in laboratory and pilot plant recycling
and were approved for use by the United States Postal Service. Unfortunately, the
relationship between screenability and formulation was never reported, as the project kept
the adhesive manufacturers and their formulations confidential.
Pressure Sensitive Adhesive Formulation
Two common types of pressure sensitive adhesives are block copolymer
adhesives and acrylic adhesives [26,29]. The adhesive manufacturers sell the block
copolymer adhesives as solutions or hot melts and the acrylic adhesives as solutions or
emulsions [26].
The block copolymer adhesive chains consist of three blocks involving
polystyrene and polyisoprene or polybutadiene [26,29]. The three blocks in the
copolymer are in the form of polyisoprene-polystyrene (SIS) or
polystyrene-polybutadiene-polystyrene (SBS). The block copolymer formulation involves a base
block copolymer, two tackifiers, and other additives. Two tackifiers are used for block
copolymers because each of the polymers in the block copolymer requires a different
tackifier.
The SIS block copolymer is a “thermoplastic rubber”, or a copolymer containing
a polystyrene phase and a polyisoprene phase [30]. In SIS, the polystyrene phase is the
thermoplastic phase and the polyisoprene phase is the rubber phase. The polystyrene
phases of multiple chains produce crosslinks between each other by forming a sphere
containing only polystyrene phases. Varying the concentrations of the polystyrene and
polyisoprene phases affects the stress-strain behavior of the copolymer. At 20 to 30% by
modulus. Above 33% by weight polystyrene, the copolymer behaves more like a
thermoplastic and is hard with a high modulus.
Additives for the thermoplastic block copolymer interact with either the
thermoplastic phase or the rubber phase depending on the solubility parameter [30]. In
order for two materials to be miscible in each other, the solubility parameters must be
similar. Polystyrene and polyisoprene have different solubility parameters, so materials
are miscible in one phase or the other. The tackifiers needed for the block copolymers
are resins, miscible with either the thermoplastic phase or the rubber phase. In addition
to providing tackification, resins also improve the specific adhesion and control the
modulus of the miscible phase. Plasticizer is another additive used in block copolymers.
Plasticizers that are miscible in the polystyrene phase decrease the cohesive strength and
allow the fluid to flow by preventing strong crosslinks from forming.
Typical formulations for block copolymer, pressure sensitive adhesives are shown
in Table 1-1 [31]. The hydrocarbon resin is the isoprene plasticizer and the liquid
resin/plasticizer/oil is the styrene plasticizer. The major additive for rubber-based block
copolymer pressure sensitive adhesives is antioxidants.
Table 1-1. Typical Formulations for a Block Copolymer PSA [31]
Parts of a Block Copolymer Adhesive Percentage of Total Formulation, %
SIS or SBS block copolymer 25-40
Hydrocarbon resin 30-50
Liquid resin/plasticizer/oil 25-35
Additives <1
Acrylic pressure sensitive adhesives are less complex than rubber-based block
copolymer adhesives [32]. The major component in an acrylic pressure sensitive
Acrylic polymers are naturally tacky and can serve as pressure sensitive adhesives
without the addition of other materials, unlike the rubber-based block copolymer
adhesives. In order to provide more tack, other monomer units can be incorporated into
the polymer chain with butyl acrylate and 2-ethylhexyl acrylate. Also, tackifiers can be
added to acrylic adhesives to increase the tack, but tackifiers do not have to be added to
provide tack.
The major acrylic adhesives are butyl acrylate and 2-ethylhexyl acrylate [26,29].
Acrylic adhesive formulations involve a base polymer, tackifier, and other additives.
Typical formulations for acrylic pressure sensitive adhesives are shown in Table 1-2
[31]. The additives for acrylic pressure sensitive adhesives consist of defoamers and
biocides.
Table 1-2. Typical Formulations for an Acrylic PSA [31]
Parts of an Acrylic Adhesive Percentage of Total Formulation, %
Acrylic polymer 60-100
Tackifier resin 0-40
Additives 1-5
Properties of Adhesive Materials
Important properties for the performance of adhesives in stamps, labels, or
envelopes are the peel, tack, and shear of the adhesive. These properties are not
necessarily important for evaluating the removal of adhesive particles in paper recycling.
In recycling, where breakage and deformation can occur, the shear and elongation moduli
are important properties. All of the above properties depend on the glass transition
temperature (Tg), so it is key [30,32]. Above the glass transition temperature, materials
are rubbery or liquid-like; while below the glass transition temperature, materials are
Three important properties to adhesive manufacturers for the application of
pressure sensitive adhesives are peel, shear, and tack [29,32]. Peel is a measure of the
force needed to break the bond between the adhesive and the adherend. Shear is a
measure of the resistance of the adhesive to a constant shear force. Tack is the stickiness
of the adhesive and its ability to stick to the adherend. Peel and shear depend on the
adhesive and cohesive strength of the adhesive, respectively. The peel, tack, and shear all
depend on the amount of tackifier in the adhesive formulation.
The three mechanical forces affecting all materials are tensile, shear, and cleavage
[29]. To test the three different forces, a sample is subjected to forces in different
configurations. For tensile, forces are applied in opposite directions perpendicular to the
major plane of and at the center of the sample. For shear, forces are applied in opposite
directions parallel to the major plane of the sample. For cleavage, a sample with a crack
at the edge is subjected to forces in opposite directions perpendicular to and at the crack
in the sample.
The tensile and shear forces can be measured using different geometries in the
same device [29]. A sample with a measured cross sectional area is subjected to a force
perpendicular to the cross sectional area plane. The force divided by the cross sectional
area is the stress. The stress is measured versus the strain, which is the change in length
of the sample divided by the original length. In the elastic region of the stress versus
strain curve, the slope is the Young’s modulus or the shear modulus for the tensile and
shear curve, respectively. Therefore, a plot of stress versus strain can be generated for
both tensile and shear forces. From the curves, the stress at failure can be determined for
Pressure sensitive adhesives are viscoelastic polymers [29]. Viscoeleastic
materials behave like viscous liquids and elastic solids. By applying a time-dependent or
sinusoidal stress to a viscoelastic fluid, the dynamic mechanical properties of the fluid
can be determined. For a sinusoidal stress, the stress and the strain are each a function of
time and are out of phase with each other by a value of δ. If δ is not equal to 90o, then
the stress and strain are partially in phase and partially out of phase with each other.
There are two moduli relating the stress and strain out of phase by δ, one for the stress
and strain in phase with each other and one for the stress and strain out of phase. When
the stress and stain are in phase with each other, energy is stored during part of a cycle,
and when the stress and stain are out of phase with each other, energy is lost during a
cycle. The modulus for the stress and strain in phase with each other is the storage
modulus and the modulus for the stress and strain out of phase with each other is the loss
modulus.
The dynamic mechanical properties of a viscoelastic material are measured in a
dynamic mechanical spectrometer [29]. The sample is either placed in tension or in shear
between two plates. When in tension, the Young’s moduli are determined, and when in
shear, the shear moduli are determined. One plate is attached to a sinusoidal driver and
the other plate is attached to a force transducer. Both the frequency and amplitude of the
signals are measured. The storage and loss moduli are measured as functions of either
the temperature or the frequency. For measuring the moduli versus temperature, the
frequency is held constant, and for measuring the moduli versus frequency, the
An important characteristic of polymeric materials is the glass transition
temperature (Tg) [29]. At the glass transition temperature, a polymer changes from a
glassy material to a rubbery material. At temperatures less than the glass transition
temperature, the polymer behaves like a glass, and at temperatures greater than the glass
transition temperature, the polymer behaves like a rubber. For pressure sensitive
adhesives, the glass transition temperature is usually less than room temperature.
For a polymer containing thermally reversible crosslinks, another important
temperature is the terminal relaxation temperature (Tt) [29]. The terminal relaxation
temperature is greater than the glass transition temperature. At temperatures between the
glass transition temperature and the terminal relaxation temperature the polymer behaves
like a rubber. At temperatures greater than the terminal relaxation temperature, a
polymer with thermally reversible crosslinks flows like a viscous fluid.
The storage modulus and the loss modulus are both affected by temperature [29].
As the temperature increases, the storage modulus decreases. At the glass transition
temperature and the terminal relaxation temperature, the storage modulus decreases at a
faster rate than at other temperatures. At the glass transition temperature and the terminal
relaxation temperature, the loss modulus is greater than at other temperatures.
Crosslinking between polymer chains has a profound effect on its behavior [29].
By increasing the degree of crosslinking in a polymer, the mobility of the polymer chains
decreases. A polymer containing permanent crosslinks will not flow at any temperature
Screening of Adhesive Contaminants and Related Materials
Pressure screens are key to the removal of stickies in a recycling operation [33].
For efficient removal of stickies in a screen it is important that the stickies do not
disintegrate or extrude through the slots in the screens. It should be noted that screens
were originally designed to remove fibrous debris from the pulp slurry, and not elastic,
deformable material like stickies.
The most common method for removing stickies is a multistage system of
pressure screens [3]. The pressure screen is a cylindrical vessel containing a screen
basket and a rotor (see Figure 1-1) [3,7,15,34]. The cylindrical vessel has ports for the
feed, accept, and reject lines, allowing for continuous flow of material through the
pressure screen [15]. The screen basket has either holes or slots designed to allow the
acceptable material to pass through, while blocking the large contaminants [15,35]. The
size of the holes or slots is the most important screen parameter in the removal of stickies
[3,35]. For the removal of small stickies particles, fine screens are used because their
narrow slot sizes range from 0.006 to 0.012 inches [33]. To maximize production,
pressure screens utilize large pressure gradients and shear forces.
For commercial fine screens, typical stickies removal efficiencies range from 50
to 80% [33,36-38]. It has been proposed that the low removal efficiency in commercial
screens is due to the deformable and elastic stickies being able to change shape and pass
through the openings of the screen [4,6,8,9,39]. However, recent research has shown that
breakage of adhesive particles in pressure screens also contributes to the reported low
removal efficiency [38,40]. As a result, it is also important to understand the conditions
Figure 1-1. Diagram of a Pressure Screen [34]
Pressure Screen Operation
The ideal screen would remove all of the contaminants, while allowing all of the
acceptable material to pass through [41]. In order to remove all of the contaminants, a
perfect barrier would be required to block all of the contaminants. This is not practical,
so screen plates contain holes or slots, to allow acceptable material to pass through.
However, some contaminant particles also pass through the holes or slots with the
acceptable material. Due to the demand for high fiber processing rates, screens are
designed to compromise between production rate and screening efficiency. In this
system, a screen accepts some contaminants and rejects some acceptable material. The
removal efficiency of contaminants in a pressure screen depends on the rotor, the screen
plate, and the operating variables [15,33,42].
Important rotor parameters are the shape of the rotor and the rotor speed
surfaces (see Figure 1-2) [7,34]. Each rotor shape produces a different pressure pulse at
the screen basket [7,34]. Also, the rotor foils may be on the feed or accepts side of the
screen basket, or on the inside or the outside of the screen basket (see Figure 1-3) [7,34].
A slow rotor can provide a better removal efficiency than a fast rotor by providing fewer
pressure pulses [15,33,42].
Figure 1-2. Typical Rotor Shapes for Pressure Screens: (A) Foils, (B) Bumps, (C) Radial vanes, (D) Tapered surfaces [34]
Figure 1-3. Flow Designs for Pressure Screens with the Rotor on the Inside (A,C,D) or the Outside (B,C) of the Screen Basket [34]
As the rotor passes over the pressure screen basket, a pressure pulse is generated
[43]. The pressure pulse is a result of the rotor tip passing close to the screen basket,
followed by a wake to the rotor. The rotor forces material through the openings, while
the wake pulls material back through the openings. The rotor and the wake generate
pressure pulse. The pressure pulse prevents material from accumulating on the screen
basket surface and in the openings due to the material passing back and forth through the
openings.
Figure 1-4. A Pressure Pulse in a Pressure Screen [44]
Important screen plate parameters are the shape and size of the openings and the
degree of the surface contour [15,33,34,42]. Smaller holes or slots can improve the
removal efficiency of a pressure screen by blocking more particles, but plugging is more
likely to occur in smaller openings [15,42]. Currently, slot sizes as small as 0.004 to
0.006 inches are in use [39]. A screen basket with more of a contoured surface produces
turbulence in the screen, which allows more contaminants to align with and pass through
the openings [34].
The feed consistency, reject rate, pressure difference, slot velocity, and
temperature have been mentioned as the key operating parameters for pressure screens
[15,33,41,42]. The feed consistency affects the operation of a pressure screen by more -15
-12 -9 -6 -3 0 3 6
0 3 6 9 12 15 18
Time, ms
clogging of the holes or slots occurring as the consistency increases [41]. It has been
suggested that a higher consistency is better for contaminant removal [15,33]. The
removal efficiency of a pressure screen is better at higher reject rates, but for the same
amount of feed material, less material is accepted [15,42]. The pressure difference is the
difference between the pressure on the feed side and the pressure on the accept side of the
screen. An increase in the pressure difference across the screen basket is suggested to
force more material through the openings and decrease the removal efficiency [15]. The
slot velocity is a ratio between the volumetric flow rate of material through the screen
openings and the total area of the screen openings, reported in velocity units. There is
some data showing that as the slot velocity increases, the removal efficiency decreases
[33]. Lower stock temperature has been mentioned to provide a better removal
efficiency, but no data was offered to support this claim [15]. However, research has
been conducted at this facility using a laboratory screen that does support this claim [38].
Two general mechanisms for particle removal are positive size separation and
particle alignment with the rotor [7,15,34]. For “pure” positive size separation, rigid
particles with all three dimensions larger than the hole or slot size are rejected. For
particle alignment with the rotor, the largest dimension of a particle aligns with the rotor
so that the largest dimension is parallel to the screen basket surface. Also, the largest
dimension faces the hole or is perpendicular to the width of the slot. The particle cannot
pass through the hole or slot and is rejected. Real pressure screens use both size
separation and particle alignment for the removal of contaminant particles.
Proposed mechanisms for particles with at least one dimension larger than the slot
particle extrusion [15,34]. Particle alignment with the slot as a mechanism for particle
passage involves turbulence due to the surface contour, allowing the smallest dimension
of the particles to align with the width of the slot so that the particles can pass through the
slot [15]. Particle bending involves particles, with the smallest dimension less than half
the width of the slot, bending in half to pass through the slot [15,34]. Particle extrusion
involves particles with a low yield stress and larger size than the slot deforming and
passing through the slot [15,34].
Forces in the Pressure Screen
Shear forces and tensile forces exist within a pressure screen [24,40,45]. Shear
stresses occur in the wake of the rotor foil moving over the contoured screen basket and
within the openings of the screen basket [40,45]. Tensile stresses occur at the entrances
of the screen basket openings [24].
The rotor creates shear forces by pulp movement and mechanical action [40,45].
Of special importance is that the rotor breaks up a pulp mat that is formed on the surface
of the basket. The pulp mat is at a higher consistency than the feed due to dewatering at
the screen openings. As the rotor passes over the mat, the rotor fluidizes the pulp layer so
that the fibers can pass through the screen openings. Shear forces in the screen basket
openings are due to pulp flowing through the openings.
At the screen basket openings, tensile forces pull the particles into the openings
[24,45]. The tensile forces are a result of the fluid velocity being greater in the openings
stretch and deform upon entering screen basket openings. Also, particles can break at the
screen basket openings if the tensile forces are large enough.
In an analysis of paper fibers in the pressure screen, the two locations for shear
stress were compared [45]. The wake of the rotor foil was reported to have a higher shear
stress on the fiber wall than the openings of the screen basket. The maximum shear stress
on the fiber wall was estimated to be 104 Pa for the wake of the rotor foil in the pressure
screen, which was second only to the fan pump for wet-end papermaking equipment.
In another analysis of pressure screens, shear stress was calculated for the rotor
foil and for the screen basket slots [40]. The shear stress was calculated to be in the 105
Pa range for the slots and in the 102 Pa range for the rotor foil. To calculate the shear
stress for the rotor foil, an equation similar to the shear stress equation for a Newtonian
fluid between parallel plates was used, with an apparent viscosity as a function of
consistency. However, pulp is not a Newtonian fluid, but a Bingham plastic. To
calculate the shear stress for the slots of the screen basket, the Hagen-Poiseuille equation
was used, which is for Newtonian fluid flow in pipes.
Kerekes [24] analyzed pulp flocs in pipe constrictions, which could be
representative of pulp flocs entering pressure screen slots. It was found that pulp flocs
entering pipe constrictions stretched and then ruptured. The fibers in the pulp flocs were
not sheared apart, but pulled apart as they entered the pipe constrictions. Due to
elongation of the pulp flocs, the lengths increased and the diameters decreased for the
pulp flocs.
Shear affects the breakdown of particles by providing the force for fracture.
[46]. So by increasing the shear to levels greater than the yield stress, particles should
break down in a pulp suspension. The maximum shear stress on the surface of
papermaking fibers has been estimated for various pieces of equipment in the pulp and
paper industry [45]. The fiber wall shear stress, τw, can vary from 102 Pa for a paper
machine to 104 Pa for a pressure screen. With the use of high shear mixers and pumps
for medium consistency (>10%) pulp processing, the shear is even higher [47].
If an object, such as a fiber or a contaminant, is immersed in a fluid, such as
water, shear forces exist on the object. The shear forces resulting from fluid flow around
immersed objects are called drag [48]. The two types of drag are skin friction and form
drag. Skin friction occurs in flow over the surface of an object and form drag occurs in
flow past blunt objects. Skin friction is caused by the formation of a boundary layer at
the surface of an object. Form drag usually involves the formation of a wake in the fluid
flow beyond the object.
Shear Forces in Rotary Devices
Pulpers, mixers, and screens are all examples of recycling operations that are
rotary devices. It is important to understand how the breakage of particles in such
devices affects the screening of those particles.
In a stirred vessel, a zone of high energy occurs around the blades of the impeller
[25]. The zone of high energy consists of flow acceleration, vortexes, pressure gradients,
and variations in shear stress up to one hundred times the average. Aggregate breakup
occurs within the zone of high energy due to intense agitation. There is also a zone of
forming aggregates. For a stirred vessel involving turbulent flow, the average shear rate
can be calculated using the equation:
G = (P/Vµf)1/2
where G is the shear rate, P is the power input, V is the fluid volume, and µf is the fluid
viscosity [25]. G is an average value and the actual values can be significantly higher
within the zone of high energy.
Using a rotary shear tester, pulp samples have been analyzed to determine the
yield stress [46,49]. A relationship was found between the yield stress and the pulp
consistency. An equation for the curve fitted to the data was of the form:
τy = aCmb
where τy was the yield stress, a and b were constants, and Cm was the pulp consistency
[46,49]. The constants in the equation depended on the type of pulp. Also, apparent
viscosity, torque, and power dissipation were found to have relationships to consistency
similar to that for yield stress [49,50]. The level of power dissipation was the amount of
power required to fluidize a pulp suspension.
Particle Breakage
Dynamic and drag forces act on a particle in a turbulent flow vessel causing
breakage to occur [25]. The dynamic forces act across the particle and the drag forces act
on the particle surface. The dynamic forces are the local shear stress and the pressure
gradient across the particle. The drag forces are the shear forces on the particle surface.
Under high shear conditions, particles can break down into smaller particles by
particles involves splitting them into two smaller particles. Fragmenting of particles
involves splitting them into several smaller particles. Shedding of particles involves
erosion of small pieces from the surface. Stretching of particles involves tensile forces
causing the particles to change shape into strings or threads and then break.
Disintegrating of particles involves splitting the particles into many very small particles.
Based on the ways that particles break down, equations have been developed for particle
size and number of particles [51-54].
In a study of pulp flocs, different levels of shear stress were considered [51]. Pulp
flocs were analyzed for size changes over time. The equation for floc size versus time
that was fitted to the data was:
S = S0 exp[-Ks(t – t0)]
where S was the floc size, S0 was the initial floc size, t was the time, t0 was the initial
time, and Ks was the rate constant [51]. This equation is in the form of exponential
decay, suggesting that erosion caused the flocs to decrease in size. Fitting a curve to the
data for the rate constant and shear stress provided the equation:
Ks = 3.7(τ – 6)
where Ks was the rate constant in s-1 and τ was the shear stress in N/m2 [51]. The shear
stress depended only on the Reynolds number for the fluid flow and the distance across
the system. The equation for the rate constant versus the shear stress showed that there
was a minimum shear stress required for the floc size to change. According to the two
equations, in order for the flocs to disperse, the shear stress had to be greater than 6 N/m2.
In an analysis of toner deinking, the average diameter of toner particles was
shear rate, temperature, and time. The additives considered were pure oil and a mixture
of oil and surfactant. The additives provided different results for average diameter versus
shear rate and temperature. Temperature did not have any effect on average diameter
with pure oil, but there was a non-linear relationship between average diameter and
temperature with a mixture of oil and surfactant. For average diameter versus time, the
curve depended on the temperature.
In the same analysis of toner deinking, models for particle aggregation and
particle breakup were considered [54]. The breakup rate depended on the size of the
particle and the particle concentration. The parameters were dimensionless and consisted
of the ratio between the break up and aggregation rates, the exponent for the breakup rate,
and the ratio between the size of a particle before and after breakup. It was found that the
only parameter that affected the particle size distribution was the ratio between the
breakup and aggregation rates. The equation determined for average particle size was:
D = kρ-1/v
where D was the average diameter of the particles, ρ was the ratio between the breakup
and aggregation rates, v was the exponent for the breakup rate, and k was a constant [54].
The exponent for the breakup rate, v, depended on the particle size and the volume
fraction of particles. An equation for the ratio between the breakup and aggregation
rates, ρ, is:
ρ = B/αV
where B was the breakup rate constant, α was the aggregation efficiency, and V was the
of particles. The aggregation efficiency, α, was the ratio between the number of
aggregation collisions that occurred and the number of theoretical collisions.
Previous Research on Screening of Adhesives and Related Materials
Research has been conducted to understand the effect of operating parameters on
the behavior of stickies and related materials in pressure screens [33,40,43,55-57]. The
effects of operating parameters on removal efficiency and particle disintegration have
been investigated. Operating parameters that were analyzed consisted of consistency,
reject rate, rotor speed, slot velocity, and slot width.
In one study of stickies in slotted pressure screens, the effects of consistency, slot
velocity, and slot width on the removal efficiency were investigated [55,56]. The pulp
furnish consisted of newsprint and address labels. The pressure screen was operated at
two consistencies, 0.75% and 1.25%. Slot widths of 0.15, 0.20, and 0.25 mm were
considered. For each slot width, the slot velocity was varied from 1 to 5 m/s. The
removal efficiency was better at 1.25% consistency than at 0.75% consistency for each
slot width and slot velocity. The author did not explain the effect of consistency on
removal efficiency. (Presumably, this is due to the fiber matrix preventing contaminant
particles from entering the slots of the pressure screen.) Also, the removal efficiency was
higher for the 0.15 mm wide slots than for the 0.20 mm and 0.25 mm wide slots at both
consistencies and all of the slot velocities. The removal efficiency tended to decrease
linearly as the slot velocity increased for each consistency and slot width. The author
the fluid forces, which increase the extrusion of the pressure sensitive adhesive particles,
but this explanation is not justified by this work.
In another study of stickies in a slotted pressure screen, the effects of reject rate,
rotor speed, and slot velocity on the removal efficiency were investigated [33]. Slot
widths of 0.25 mm and 0.30 mm were used, but the slot widths were not compared.
Reject rates ranged from 10 to 40% by weight and slot velocities ranged from 0.5 to 3.0
m/s. The removal efficiency increased non-linearly as the reject rate increased. Also, the
curve of removal efficiency versus reject rate was lower for higher rotor speeds. The
author attributes this to increased kinetic stock energy, but again this is not justified. In
comparing removal efficiency to slot velocity, the removal efficiency decreased almost
linearly as the slot velocity increased. The decrease in removal efficiency versus slot
velocity was more for conformable particles than for non-conformable particles, but an
explanation was not provided.
In a study of rubber particles representing adhesive contaminants, removal
efficiency was evaluated versus consistency, reject rate, rotor speed, slot velocity, and
slot width [57]. For consistency, the optimum removal efficiency occurred at about 1.6%
consistency. It was theorized, but not proven, that very low consistency caused
turbulence and prevented the alignment of the particles with the rotor. The author
suggested that as the consistency increased, the turbulence decreased and higher removal
efficiencies were achieved. At very high consistencies, the removal efficiency decreased
again, but was not explained by the author. The removal efficiency increased as the
reject rate increased as expected. The removal efficiency decreased as the rotor speed
the turbulence, but this was not proven. As the slot velocity increased, the removal
efficiency decreased. The effect of slot velocity on the removal efficiency was attributed
to fluid drag forces pulling particles through the slot, although no evidence was provided.
The removal efficiency decreased as the slot width increased as expected. For the slot
width experiments, the accept flow rate was held constant, causing the slot velocity to
decrease as the slot width increased. However, the decrease in removal efficiency was
more pronounced versus the slot width than versus the slot velocity. This indicates that
slot width is more important than slot velocity.
In a study of polyethylene films as contaminants in pulp, the operating parameters
of consistency, rotor speed, slot velocity, and slot width were varied for a pressure screen
[43]. Three consistencies of 1, 2, and 3% were used. The rotor speed was 17, 20, or 23
m/s. The slot velocity ranged from 0.5 to 4 m/s. The slot width was 0.10, 0.15, 0.20, or
0.25 mm. In these experiments, the removal efficiency decreased as the slot velocity
increased. Also, the removal efficiency improved as the slot width decreased. The
author mentioned that increasing the slot velocity and the slot width changed the flow
pattern and the particle orientation around the entrance to the slot, allowing more
particles to flow through the slot, but no evidence was provided related to the flow
patterns or the particle orientation. Consistency did not have much of an effect and rotor
speed did not have any effect on the removal efficiency of the pressure screen.
In a study of stickies disintegration, three different pressure screens, with each
pressure screen operating at a different consistency, were considered [40]. The
consistencies at which the pressure screens operated were 2.5, 3.6, and 4.4%. The stickies
the pressure screens at 3.6 or 4.4% consistency. The author mentioned that each of the
pressure screens had a different rotor design, but the rotor designs were not compared.
However, the author claimed that for higher consistency pulps the rotors provided higher
shear forces in order to fluidize the pulp, and the higher shear forces increased the
particle disintegration, but the shear forces were not measured for the different screens.
SUMMARY
Adhesive materials are found as contaminants in recovered paper and are difficult
to remove in paper recycling. One especially troublesome type of adhesive contaminant
in paper recycling is the pressure sensitive adhesive. Pressure screens are the most
commonly accepted method for removing pressure sensitive adhesive particles from
recycled pulp, but show varied removal efficiencies from 50 to 80%. The removal
efficiency of the pressure screen depends on the screen rotor and the size and shape of the
openings in the screen plate, as well as the operating parameters of feed consistency,
reject rate, pressure difference, slot velocity, and operating temperature. Several
mechanisms have been suggested to explain the passage of pressure sensitive adhesive
materials through a screen, but further research is needed to verify the importance of
these mechanisms.
REFERENCES
1. Young, R., “Recovered Paper and the U.S. Solid Waste Dilemma”, Chapter 1 in
Secondary Fiber Recycling, Spangenberg, R. J., ed., TAPPI Press, Atlanta, GA, 1993.
3. McKinney, R. W. J., “ Wastepaper Preparation and Contaminant Removal”, Chapter 3 in Technology of Paper Recycling, McKinney, R. W. J., ed., Blackie Academic & Professional, London, 1995.
4. Pikulin, M. A., “Stickies and Their Impact on Recycled Fiber Content Fine Paper”,
Joint Conference to Address Pressure Sensitive Adhesive Issues Proceedings, United States Postal Service and American Forest & Paper Association, Washington, D.C., June 1996.
5. Doshi, M. R., “Overview-Stickies”, Paper Recycling Challenge, Vol. I- Stickies, M. R. Doshi and J. M. Dyer, eds., Doshi & Assoc., Inc., Appleton, WI, pp. 3-6, 1997.
6. Scholz, W. F., “Recyclable Pressure Sensitive Adhesives”, 1993 Tappi Pulping
Conference Proceedings, Atlanta, GA, TAPPI Press, pp. 501-505, 1993.
7. Bliss, T., “Screening”, Chapter 14 in Secondary Fiber Recycling, Spangenberg, R. J., ed., TAPPI Press, Atlanta, GA, 1993.
8. Chou, C. S., “Repulpability of Adhesives”, Paper Recycling Challenge, Vol. I- Stickies, M. R. Doshi and J. M. Dyer, eds., Doshi & Assoc., Inc., Appleton, WI, pp. 304-309, 1997.
9. Scholz, W. F., “Pressure Sensitive Adhesives”, Progress in Paper Recycling, 4(1):71-73, 1994.
10. Crossley, B. R., Abubakr, S., Grimes, D. B., and Kumar, R., “A Pilot Plant Study of the Recyclability of Pressure Sensitive Adhesives (PSA)”, 1998 Tappi Recycling Symposium Proceedings, New Orleans, LA, TAPPI Press, pp. 469-473, March 1998.
11. Doshi, M. R., “Quantification of Stickies”, Paper Recycling Challenge, Vol. I- Stickies, M. R. Doshi and J. M. Dyer, eds., Doshi & Assoc., Inc., Appleton, WI, p. 193, 1997.
12. Doshi, M. R., “Properties and Control of Stickies”, Paper Recycling Challenge, Vol. I- Stickies, M. R. Doshi and J. M. Dyer, eds., Doshi & Assoc., Inc., Appleton, WI, pp. 227-236, 1997.
13. Smith, S. E., “Stickies Properties and the Relationship to Their Removal”, Paper Recycling Challenge, Vol. I- Stickies, M. R. Doshi and J. M. Dyer, eds., Doshi & Assoc., Inc., Appleton, WI, pp. 237-239, 1997.
15. Bliss, T., and Ostoja-Starzewski, M., “Debris Characteristics and Removal Techniques”, 1997 Tappi Korea Recycling Symposium Proceedings, Seoul, Korea, TAPPI Press, pp. 1-17, October 1997.
16. Landa, M. R., “PSA Labels and Repulping Paper”, Joint Conference to Address
Pressure Sensitive Adhesive Issues Proceedings, United States Postal Service and American Forest & Paper Association, Washington, D.C., June 1996.
17. McCool, M. A., and Silveri, L., “Removal of Specks and Nondispersed Ink from a Deinking Furnish”, Tappi Journal, 70(11):75-79, 1987.
18. Moss, C. S., “Theory and Reality for Contaminant Removal Curves”, Tappi Journal, 80(4):69-74, 1997.
19. Moss, C. S., “The Contaminant Removal Curve – Theory vs Reality”, 1997 Tappi
Recycling Symposium Proceedings, Chicago, IL, TAPPI Press, pp. 1-6, April 1997.
20. Friberg, T., “Cost Impact of Stickies”, Progress in Paper Recycling, 6(1):70-72, 1996.
21. Doshi, M. R., “Quantification of Stickies”, Paper Recycling Challenge, Vol. I- Stickies, M. R. Doshi and J. M. Dyer, eds., Doshi & Assoc., Inc., Appleton, WI, pp. 176-179, 1997.
22. Dyer, J., “A Summary of Stickies Quantification Methods”, Paper Recycling
Challenge, Vol. I- Stickies, M. R. Doshi and J. M. Dyer, eds., Doshi & Assoc., Inc., Appleton, WI, pp. 44-51, 1997.
23. Staff, Progress in Paper Recycling, “Methods to Quantify Stickies-A Mill Survey”,
Paper Recycling Challenge, Vol. I- Stickies, M. R. Doshi and J. M. Dyer, eds., Doshi & Assoc., Inc., Appleton, WI, pp. 171-175, 1997.
24. Kerekes, R. J., “Pulp Floc Behavior in Entry Flow to Constrictions”, Tappi Journal, 66(1):88-91, 1983.
25. Shamlou, P. A., and Titchener-Hooker, N., “Turbulent Aggregation and Breakup of Particles in Liquids in Stirred Vessels”, Chapter 1 in Processing of Solid-Liquid Suspensions, Shamlou, P. A., ed., Butterworth-Heinemann Ltd., Oxford, 1993.
26. Temin, S. C., “Pressure-Sensitive Adhesives for Tapes and Labels”, Chapter 38 in
Handbook of Adhesives, 3rd edition, Skeist, I., ed., Van Nostrand Reinhold, New
York, 1990.
27. Hsu, N. N.-C., “Stickies-The Importance of Their Chemical and Physical Properties”,
28. Peng, J. Y., “United States Postal Service Efforts to Develop an Environmentally Benign Pressure-Sensitive Adhesive for Postage Stamp Applications”, 2000 Tappi Recycling Symposium Proceedings, Washington, D.C., TAPPI Press, pp. 3-20, March 2000.
29. Pocius, A. V., Adhesion and Adhesives Technology: An Introduction, Hanser/Gardner Publications, Inc., Cincinnati, OH, 1997.
30. Harlan, J. T., and Petershagen, L. A., “Thermoplastic Rubber (A-B-A Block Copolymers) in Adhesives”, Chapter 13 in Handbook of Adhesives, 3rd Edition, Skeist, I., ed., Van Nostrand Reinhold, New York, 1990.
31. Leppanen, A., “The Role of Pressure Sensitive Labels in Paper Recycling”, Adhesive and Sealant Council 1999 Spring Convention and Expo Proceedings, Toronto, ON, Canada, April 1999.
32. Gehman, D. R., “Acrylic Adhesives”, Chapter 25 in Handbook of Adhesives, 3rd
Edition, Skeist, I., ed., Van Nostrand Reinhold, New York, 1990.
33. Heise, O., “Screening Foreign Material and Stickies”, Tappi Journal, 75(2):78-81, 1992.
34. Bliss, T., “Screening in the Stock Preparation System”, 1998 Tappi Stock Preparation Short Course Proceedings, Atlanta, GA, TAPPI Press, pp. 151-174, April 1998.
35. Kelly, A. F., “Screening Secondary Fiber”, 1997 Tappi Improving Screening and Cleaning Efficiencies Short Course Proceedings, Minneapolis, MN, TAPPI Press, pp. 115-124, June 1997.
36. Heise, O., Kemper, M., Wiese, H., and Krauthauf, E., “Removal of Residual Stickies
Applying New Flotation Technology at Haindl Paper - Schongau”, 1999 Tappi
Conference Proceedings, Atlanta, GA, TAPPI Press, pp. 693-710, March 1999.
37. Veilleux, S., Chabot, B., and Daneault, C., “Quantification of Macro Stickies and Optimization of the Wastepaper Deinking Process”, 5th Research Forum on Recycling Proceedings, Ottawa, ON, Canada, pp. 241-247, September 1999.
38. Lucas, B. E., Venditti, R. A., and Jameel, H., “Behavior of Pressure Sensitive Adhesive Material in Industrial Pressure Screens and Laboratory Screens”, Tappi Journal, 84(5):70, 2001.
40. Heise, O., Schabel, S., Cao, B., and Lorenz, K., “Deformation and Disintegration
Physics of Stickies in Pressure Screens”, 5th Research Forum on Recycling
Proceedings, Ottawa, ON, Canada, pp.187-196, September 1999.
41. Steenberg, B., “Principles of Screening System Design: Studies in Screening Theory I”, Svensk Papperstidning, 56(20):771-778, 1953.
42. Sternby, A. J., and Lehman, D. F., “Groundwood Pulp Fractionation and Screening with Pressure Screens at High Consistency”, Tappi, 44(6):401-407, 1961.
43. Julien Saint Amand, F., and Perrin, B., “Screening: Experimental Approach and
Modelling”, 1998 Tappi Pulping Conference Proceedings, Montreal, QC, Canada,
TAPPI Press, pp. 1019-1031, October 1998.
44. Wikstrom, T., and Fredriksson, B., “Hydrodynamics in a Pressure Screen –
Consequences on the Separation Process”, 5th Research Forum on Recycling
Proceedings, Ottawa, ON, Canada, pp. 197-202, September 1999.
45. Tam Doo, P. A., Kerekes, J., and Pelton, R. H., “Estimates of Maximum Hydrodynamic Shear Stresses on Fibre Surfaces in Papermaking”, Journal of Pulp and Paper Science, 10(4):J80-J88, 1984.
46. Bennington, C. P. J., Kerekes, R. J., and Grace, J. R., “The Yield Stress of Fiber Suspensions”, Canadian Journal of Chemical Engineering, 68(10):748-757, 1990.
47. Gullichsen, J., and Harkonen, E., “Medium Consistency Technology: I. Fundamental Data”, Tappi Journal, 64(6):69-72, 1981.
48. Geankoplis, C. J., Transport Processes and Unit Operations, 3rd edition, Prentice Hall, Englewood Cliffs, NJ, 1993.
49. Bennington, C. P. J., Kerekes, R. J., and Grace, J. R., “Motion of Pulp Fibre
Suspensions in Rotary Devices”, Canadian Journal of Chemical Engineering,
69(2):251-258, 1991.
50. Bennington, C. P. J., and Kerekes, R. J., “Power Requirements for Pulp Suspension Fluidization”, Tappi Journal, 79(2):253-258, 1996.
51. Lee, C. W., and Brodkey, R. S., “A Visual Study of Pulp Floc Dispersion Mechanisms”, A.I.Ch.E. Journal, 33(2):297-302, 1987.
52. Brown, D. L., and Glatz, C. E., “Aggregate Breakage in Protein Precipitation”,
53. Grabenbauer, G. C., and Glatz, C. E., “Protein Precipitation-Analysis of Particle Size
Distribution and Kinetics”, Chemical Engineering Communications, 12:203-219,
1981.
54. Snyder, B. A., and Berg, J. C., “Oil-Assisted Agglomeration for Toner Deinking: Population Balance Model and Experiments”, A.I.Ch.E. Journal, 43(6):1480-1487, 1997.
55. Vitori, C. M., “Stock Velocity and Stickies Removal Efficiency in Slotted Pressure Screens”, 1st Research Forum on Recycling Proceedings, Toronto, ON, Canada, pp. 133-142, October 1991.
56. Vitori, C. M., “Stock Velocity and Stickies Removal Efficiency in Slotted Pressure Screens”, Pulp & Paper Canada, 94(12):109-112, 1993.
57. Seifert, P., Winkler, J., Vitori, C., Fields, B., and Maze, E., “Removal of Soft and Flexible Contaminants from Recycled Paper, in Screens”, 5th Research Forum on
![Figure 1-4. A Pressure Pulse in a Pressure Screen [44]](https://thumb-us.123doks.com/thumbv2/123dok_us/1242597.1156876/32.612.119.493.168.396/figure-a-pressure-pulse-in-a-pressure-screen.webp)