ABSTRACT
KIMBALL, JENNIFER ANN. Breeding for Cold Tolerance in St. Augustinegrass using Conventional and Molecular Methods. (Under the direction of Drs. Susana Milla-Lewis and Thomas G. Isleib).
St. Augustinegrass (Stenotaphrum secundatum[Walt.] Kuntz) is a warm-season grass species commonly utilized in the turfgrass industry for its superior shade tolerance, stoloniferous growth habit, and moderately low input requirements. However, winter survival is a major limiting factor for the species. Additionally, the most cold-tolerant cultivars often lack the aesthetic characteristics, such as a semi-dwarf growth habit and fine leaf texture that are desirable in the market. Therefore,new St. Augustinegrass cultivarswith improved cold tolerance and desirable turf quality are needed for the turfgrass industry, especially in the transitional climatic region of the United States.
In order to efficiently utilize sources of cold tolerance in a breeding program, an understanding of the genetic control of this trait and its relationship to important turf quality traits is required. Six diploid genotypes of St. Augustinegrass were selected as parents for a diallel mating design without reciprocals. Combining ability analysis revealed that both general and specific combining abilities were significant across years and locations. Specific combining ability was the largest source of genetic variation for winterkill, genetic color, turf density, and end-of-season cover indicating that non-additive gene effects play a key role in the inheritance of these traits. Lines identified as parental selfs generally showed lower winter survival and inferior turf quality than the original parental lines indicating that inbreeding depression can occur in St. Augustinegrass.
evaluate four freezing temperatures and two data collection systems in freeze tests of nine St. Augustinegrass genotypes. Results indicated -3°C and -4°C to be more suitable evaluation temperatures than -5°C and -6°C. Survival and regrowth were correlated with one another over a six week evaluation period post-freeze. Digital imaging techniques utilized in turfgrass field studies were shown to be useful in estimating survival and recovery in lab-based freeze tests. Additionally, the effects of cold acclimation and deacclimation on genotypes were evaluated. Accounting for all levels of acclimation provided excellent cultivar separation at -3 and -4°C freezing temperatures and supports the hypothesis that the inclusion of different acclimation responses offers the best overall assessment of freeze tolerance in St. Augustinegrass. Results also indicated that cold acclimation and deacclimation both play crucial roles in the winter survivability of St. Augustinegrass.
Breeding for Cold Tolerance in St. Augustinegrass using Conventional and Molecular Breeding Methods
by
Jennifer Ann Kimball
A dissertation submitted to the Graduate Faculty of North Carolina State University
in partial fulfillment of the requirements for the Degree of
Doctor of Philosophy
Crop Science
Raleigh, North Carolina 2015
APPROVED BY:
____________________________ ____________________________ David Livingston III, PhD Rongda Qu, PhD
____________________________ ____________________________ Consuelo Arellano, PhD Thomas Isleib, PhD
Co-Chair of Advisory Committee
ii BIOGRAPHY
iii ACKNOWLEDGMENTS
First, I need to thank my committee members for taking the time to advise me through my thesis. Every single one of you helped me in major ways. Dr. Rongda Qu, you have been a part of my entire graduate school education for which I am very grateful. Dr. Consuelo Arellano, thank you for your patience and time helping me better understand experimental designs and data analysis. Dr. David Livingston III, your help with the freeze testing portion of my thesis was amazing and also, you employ Tan who is definitely the man. Dr. Thomas Isleib, I am most thankful for all our random conversations about anything and everything, and of course, all that science stuff too. I really thank you for all your help with the diallel study.
Dr. Susana Milla-Lewis. Thank you for all your time, your energy, your patience, your effort, and your care. The course was a rough one at times filled with bunkers and water hazards that caused more than a few bogies and penalties. But I hope a few eagles and maybe even the occasional ace in the hole made me par for the course, and at the end of the day, I’m glad I stepped onto the green and played the game.
iv ever thank you enough for all your help. Sheri Kernoodle, I wasn’t even in your lab as some may have occasionally thought but I appreciate all your help over the last few years so much.
I also need to thank Dr. Aaron Patton at Purdue University for his amazing review of my freeze test papers; I learned a great deal from his reviews. I also need to thank Ramsey Lewis as well for review of a number of my papers.
v TABLE OF CONTENTS
Page
LIST OF TABLES ... viii
LIST OF FIGURES ... xi
CHAPTER I. Literature Review ... 01
St. Augustinegrass ... 02
Turfgrass Breeding ... 04
Linkage and QTL Mapping ... 09
Important Factors Affecting Cold Tolerance ... 15
Physiological Aspects of Cold Tolerance ... 20
Screening Methodologies for Freeze Tolerance ... 21
Heritability of Cold Tolerance ... 23
References... 26
CHAPTER II. Combining Ability of Winter Survival and Turf Quality Traits in St. Augustinegrass ... 33
Abstract ... 34
Introduction... 35
Materials and Methods ... 37
Results and Discussion ... 39
Winter Survival ... 39
Turf Quality ... 42
Establishment ... 43
Overall Cross Performance ... 44
Selfing Rates and Inbreeding Depression ... 44
Conclusions ... 46
References... 47
CHAPTER III. Freeze Testing in St. Augustinegrass I: A Methodological Approach .. 57
Abstract ... 58
Introduction... 59
Materials and Methods ... 62
Plant Materials ... 62
Freezing Tests ... 62
Data Collection ... 63
Data Analysis ... 64
Results and Discussion ... 64
Freeze Tests ... 64
Lethal Temperature ... 67
Post-Freeze Evaluation ... 68
vi
Digital Imaging Analysis ... 70
Conclusions ... 71
References... 72
CHAPTER III. Freeze Testing in St. Augustinegrass I: Evaluation of Acclimation Effects ... 83
Abstract ... 84
Introduction... 85
Materials and Methods ... 87
Plant Materials ... 87
Acclimation Treatments... 87
Freeze Tests ... 88
Data Collection ... 88
Data Analysis ... 88
Results and Discussion ... 89
Evaluation Time... 89
Freeze Temperatures ... 90
Genotype Response ... 91
Cold Acclimation ... 93
Deacclimation ... 94
Conclusions ... 96
References... 98
CHAPTER V. Linkage Analysis and Identification of Quantitative Trait Loci for Cold Tolerance and Turf Quality Traits in St. Augustinegrass ... 107
Abstract ... 108
Introduction... 109
Materials and Methods ... 112
Population Development ... 112
Genotypic Analysis ... 112
Linkage Mapping ... 112
Field Testing ... 113
Laboratory-based Freeze Testing ... 114
Phenotypic Data Analysis ... 114
QTL Mapping ... 115
Results ... 116
Genotypic Analysis and Linkage Mapping ... 116
Field Testing ... 116
Laboratory Freeze Testing ... 117
QTL Identification ... 117
Discussion ... 121
Conclusions ... 127
viii LIST OF TABLES
CHAPTER II. Combining Ability of Winterkill Tolerance and Turf Quality Traits in St. Augustinegrass
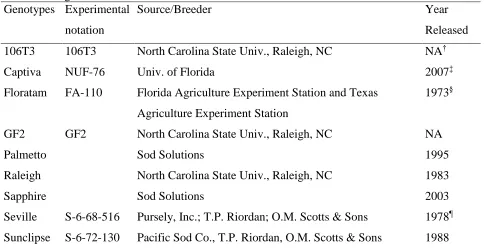
Table 2.1 List of St. Augustinegrass cultivars and experimental genotypes used in the U.S. and their breeding information and release date. ... 49 Table 2.2 Mean squares for winterkill, spring green-up, turf quality, green color,
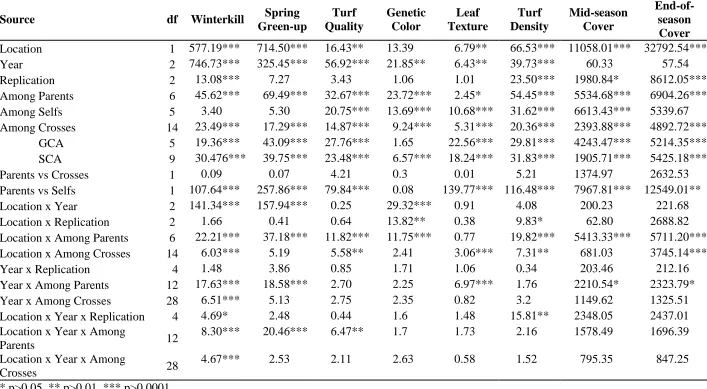
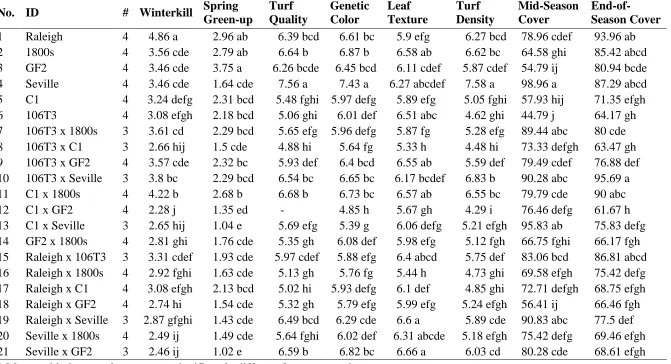
leaf texture, turf density, mid-season cover, and end-of-season cover traits ... 50 Table 2.3 List of six St. Augustinegrass parents and their crosses used in this
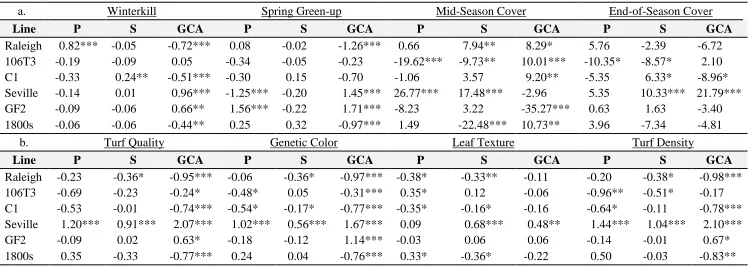
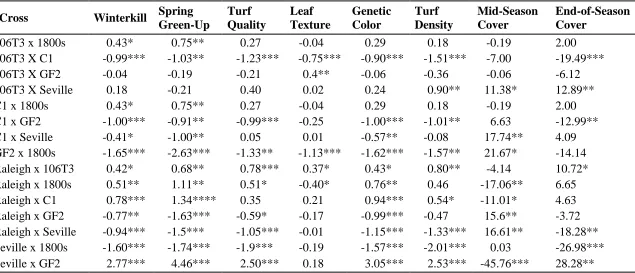
study along with mean separation for winterkill, spring green-up, turf quality, genetic color, leaf texture, turf density, mid-season cover, and end-of-season cover using Fisher's protected LSD ... 51 Table 2.4 Estimates of parental, self, and general combining ability (GCA)
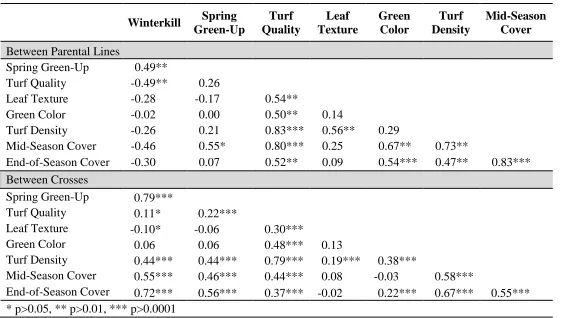
effects for winterkill, spring green-up, turf quality, green color, leaf texture, turf density, mid-season cover and end-of-season cover. ... 52 Table 2.5 Pearson correlation coefficients between parental lines and between
crosses for winterkill, spring green-up, turf quality, leaf texture, green color, turf density, mid-season cover, and end-of-season cover ... 53 Table 2.6 Estimates of the specific combining ability of 15 crosses in St.
Augustinegrass for winterkill, spring green-up, turf quality, leaf texture, green color, turf density, mid-season cover, and end-of-season cover traits across two locations over three years. ... 54 CHAPTER III. Freeze Testing in St. Augustinegrass I: A Methodological Approach
Table 3.1 Cultivars of St. Augustinegrass and experimental genotypes used in the U.S and their breeding information and release date. ... 75 Table 3.2 Analysis of variance Type III tests of fixed effects across all four
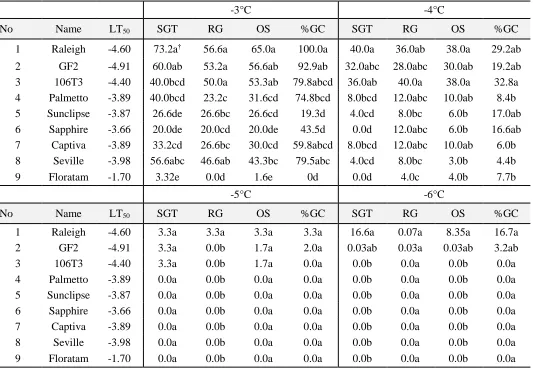
freezing temperatures after six weeks post-freeze for surviving green tissue, regrowth, overall survival, and percent green cover. ... 76 Table 3.3 St. Augustinegrass germplasm, LT50’s based on this study’s
ix and percent green cover (%GC) at six weeks postfreeze for 3°C, -4°C, -5°C, -6°C freezing temperatures . ... 77 Table 3.4 Repeated measures analysis of variance testing for within time effects
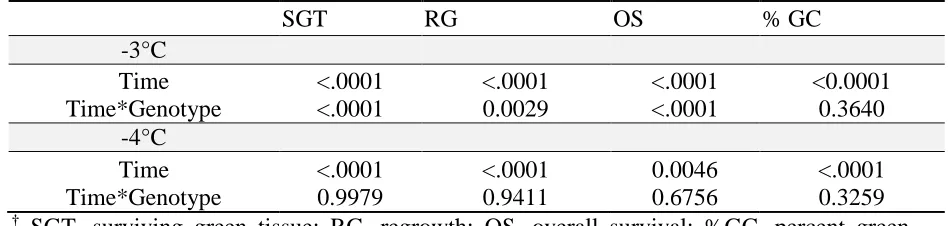
for visual and digital ratings at two different freezing temperatures .. 78 Table 3.5 Significance of genotype effects over time revealed by analysis of
variance while testing at -3°C and -4°C individually for visual and digital ratings ... 79 Table 3.6 Pearson correlation coefficients comparing surviving green tissue
(SGT) and regrowth (RG) as well as overall survival (OS) and percent green cover (%GC) over a six week evaluation period post-freeze at two freezing temperatures... 80 CHAPTER IV. Freeze Testing in St. Augustinegrass II: Evaluation of Acclimation Effects
Table 4.1 Cultivars of St. Augustinegrass and experimental genotypes used in the U.S and their breeding information and release date ... 101 Table 4.2 Repeated measures analysis of variance testing for the effect of time
for surviving green tissue (SGT) and regrowth (RG) across temperatures, acclimation treatments, nine St. Augustinegrass genotypes, and experimental run. ... 102 Table 4.3 Type III tests of fixed effects for surviving green tissue (SGT) and
regrowth (RG) at two and six weeks post-freeze, respectively, for nine St. Augustinegrass genotypes across two freezing temperatures and four acclimation treatments. ... 103 Table 4.4 Mean separation of nine St. Augustinegrass genotypes response for
surviving green tissue (SGT) and regrowth (RG) at three and six weeks post-freeze, respectively. Data are pooled over four different acclimation treatments. ... 104 Table 4.5 Testing for simple effects of cultivar and acclimation for surviving
x CHAPTER V. Linkage Analysis and Identification of Quantitative Trait Loci for Cold Tolerance and Turf Quality Traits in St. Augustinegrass
Table 5.1 Analysis of variance significance values for 117 progeny of a Raleigh x Seville cross evaluated in three field environments for cold tolerance and turf quality traits.. ... 135 Table 5.2 Lsmeans for parents, Raleigh and Seville, and progeny average,
minimum, and maximum trait values for winterkill, spring green-up, turf quality, leaf texture, genetic color, and turf density calculated for three individual field environments as well as an across environments calculation ... 136 Table 5.3 Analysis of variance significance values for 120 progeny of a Raleigh x
Seville cross evaluated in laboratory freeze tests at -3°C and -4°C for surviving green tissue (SGT) and regrowth (RG) ... 137 Table 5.4 Lsmeans for parents, Raleigh and Seville, and progeny average, minimum,
and maximum trait values for SGT and RG evaluated in laboratory freeze tests at -3°C and -4°C. ... 138 Table 5.5 Characteristics of the QTL detected winterkill, spring green-up, turf
quality, leaf texture, genetic color, and turf density ... 139 Table 5.6 Characteristics of the QTL detected surviving green tissue (SGT) and
xi LIST OF FIGURES
CHAPTER II. Combining Ability of Winterkill Tolerance and Turf Quality Traits in St. Augustinegrass
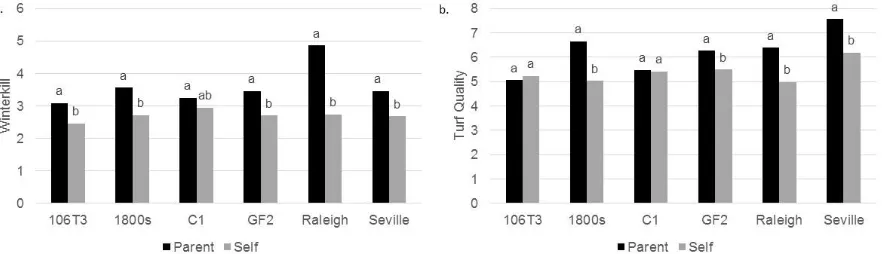
Figure 2.1 Mean separation between parental and selfed lines for a. winterkill, and b. turf quality. ... 55 S. Figure 2.1 LSmeans and mean separation between parental and selfed lines for a.
spring green-up, b. green color, c. leaf texture, d. turf density, e.mid-season cover, and f. end-of-e.mid-season cover. ... 56 CHAPTER III. Freeze Testing in St. Augustinegrass I: A Methodological Approach
Figure 3.1 Average percent regrowth (RG) for nine St. Augustinegrass genotypes across four freezing temperatures (-3°C, -4°C, -5°C, and -6°C) over a six week evaluation period post-freeze... 81 Figure 3.2 LSmeans of nine St. Augustinegrass genotypes for a. surviving green
tissue (SGT) at -3°C, b. SGT at -4°C, c. regrowth (RG) at -3°C, d. RG at -4°C, e. overall survival (OS) -3°C, f. OS at -4°C, g. percent green cover (%GC) -3°C, b. %GC at -4°C evaluated over a six week period post-freeze. Mean separation using Fisher’s LSD values are included across temperatures for each trait.. ... 82 CHAPTER IV. Freeze Testing in St. Augustinegrass II: Evaluation of Acclimation Effects
Figure 4.1 LSmeans and Fisher’s LSD groupings for the acclimation by genotype interaction of nine St. Augustinegrass genotypes response for a. surviving green tissue at three weeks post-freeze at -3°C, b. surviving green tissue at three weeks post freeze at -4°C, c. regrowth at six weeks postfreeze at 3°C, d. regrowth at six weeks postfreeze at -4°C. Within subfigure, means followed by the same letter are not significantly different according to LSD (0.05). ... 106 CHAPTER V. Linkage Analysis and Identification of Quantitative Trait Loci for Cold Tolerance and Turf Quality Traits in St. Augustinegrass
xii (LG). Marker names are listed on the right. Quantitative Trait Loci are located on the far right of each LG. Individual field environments (LW2013, LS2013, LW2015, and across all environments) and freeze temperatures (-3°C and -4°C) were not distinguished on the map and can be found in Tables 5.5 and 5.6. ... 143 Figure 5.2 Examples of the logarithm of odds (LOD) peaks for putative
1 -CHAPTER I-
2 ST. AUGUSTINEGRASS
St. Augustinegrass (Stenotaphrum secundatum [Walt.] Kuntze) is commonly utilized for its superior shade tolerance, stoloniferous growth habit, and moderately low input requirements when compared to other more popular turf species, i.e., tall fescue (Festuca arundinacea Shreb.), bermudagrass (Cynodon spp.), and zoysiagrass (Zoysia Willd.). Conversely, St. Augustinegrass is limited in its northern range of adaptation due to its inferior cold tolerance in comparison to zoysiagrass and the cool-season species commonly grown in North Carolina. Development of cold-tolerant St. Augustinegrass varieties would expand the market for this type of grass leading to an increase in more sustainable management practices
as St. Augustinegrass requires less input (i.e. water and fertilizer) than cool-season grasses and
several warm-season grasses. Aside from a need to improve cold tolerance in St.
Augustinegrass, aesthetics are another important issue for this species; homeowners find the grass’s long internodes, thick stolons, and coarse leaf texture somewhat undesirable. St. Augustinegrass cultivars are typically classified by their mowing height (growth habit) and their leaf texture. A dwarf growth habit, finer leaf texture, improved cold and drought tolerances, and resistance to pests are highly desired in new cultivar releases. There is also a need within the breeding community for a better working knowledge of the underlying genetics, including causal polymorphisms, conferring cold tolerance as well as other agronomical important morphological traits in St. Augustinegrass.
3 largely unknown, five different ploidy levels have been reported for S. secundatum, including diploids (2n=2x=18), triploids (2n=3x=27), tetraploids (2n=4x=36), hexaploids (2n=6x=54), and aneuploids (2n=28-32) (Long and Bashaw, 1961; Milla-Lewis et al., 2013a). St. Augustinegrass cultivars, ‘Floratam’ and ‘FX-10’, were the first reported instances of aneuploidy within the species (Busey, 1979). More recently, additional aneuploid genotypes with chromosome numbers ranging from 2n=28 to 2n=32 have been identified using flow cytometry (Milla-Lewis et al., 2013a; Mulkey et al., 2013b). Busey (2003) hypothesized that polyploidy in Stenotaphrum originated sporadically and by different mechanisms. Milla-Lewis et al. (2013a) hypothesized polyploidy originated by interspecific hybridization between the African diploids and Pembagrass (S. dimidatum (L.) Brongn.), a species closely related to St. Augustinegrass (Sauer, 1972). Introgression between the species has been reported (Busey, 1993; 1995) and would explain the various levels of aneuploidy, abnormal chromosome pairing behavior during metaphase (Busey, 1979; Milla-Lewis et al., 2013a), and self-incompatibility within the species.
4 simple sequence repeat markers (SSRs) (Mulkey et al., 2013a) confirmed previous morphological classification. Ploidy levels largely determine the grouping within this classification system. Diploid genotypes belong to the Breviflorous and Longicaudatus races and polyploids are classified into the Bitterblue and Floratam groups. Also, Mulkey et al., 2013b found the number of observed AFLP fragments increased with ploidy level, indicating higher levels of genetic diversity is present within higher ploidy levels in St. Augustinegrass. While most present-day cultivars are diploid, new successful tissue culture methods for embryo rescue in St. Augustinegrass (Genovesi et al., 2009) could increase the use of polyploids in cultivar development offering new sources of genetic diversity.
TURFGRASS BREEDING
Trait Improvement. Warm-season turf species are grasses that grow well in warmer climates, tolerate relatively low mowing heights, and are generally considered to have lower
input requirements. The species vary in morphology, ploidy level, and tolerance to abiotic and
biotic stresses. They also differ in their utilization across different sectors of the industry,
which drives the focus of breeding efforts for each species. Bermudagrass (Cynodon dactylon
(L.) Pers.) is widely grown on athletic fields and golf courses as the species has fine
leaf-texture, is able to withstand very low mowing heights, and quickly recovers from wear injury.
Zoysiagrass (Zoysia japonica Steud. and Zoysia matrella (L.) Merr.) is commonly used for
athletic fields, golf courses, and home lawns. It is particularly popular within the transition
zone of the United States because of its good cold tolerance relative to other warm-season turf
5
is frequently used on golf courses and home lawns along coastal regions of the southeastern
United States. Coarser-textured grasses like St. Augustinegrass (Stenataphrum
secundatum (Walt.) Kuntze) and centipedegrass (Eremochloa ophiuroides (Monro) Hack.) are
commonly grown in home lawns, public parks, and commercial landscapes due to lower
maintenance requirements and ability to outcompete weeds.
The transition zone is a particularly unique geographical location in the United States
with weather extremes in both summer and winter months. Though both cool- and
warm-season turfgrass species can be economically grown here, neither type is completely adapted to
year-round conditions, making this zone one of the most difficult regions in the U.S. to grow
quality turf. Variable seasonal temperatures consistently pose a large problem for turf in the
transition zone. Cool-season turfgrasses are not adapted to the southern-like summers which
can cause drought and heat stress, leading to watering and maintenance issues. Despite these
limitations, appealing leaf texture and color make cool-season turfgrasses widely popular in
North Carolina (47.8% of total turf area, single family dwellings contributing 44.5%) (North
Carolina Turfgrass Survey, 1999). Warm-season turfgrasses often suffer during cold winters
which can cause dormancy, injury, and death. However, these grasses often thrive during
summer months while having lower water and fertilizer requirements. Despite these strengths,
many warm-season species lag far behind cool-season species in production and popularity in
North Carolina mainly due to the lack of seed based production, slow establishment rates, and
limited cold tolerance.
6 lawns and commercial landscapes, improved varieties are more cosmetically appealing to home owners and businesses. Of course, to ensure that variety improvement continue, genetic diversity is key. Natural existing variation found in turfgrass species can be exploited by turf breeders to improve varieties for commercial use. However, capturing natural variation can be problematic in certain turf species. For example, many species, e.g., St. Augustinegrass, have limited available public germplasm. Other species, such as centipedegrass, have very limited genetic variation within germplasm stocks. Collection trips and other means of obtaining genetic diversity, e.g., mutagenesis, will need to be undertaken for these types of turfgrass species to ensure adequate diversity for breeding improvements.
Molecular Marker Use in Turf Breeding. A number of DNA-based molecular marker systems have been applied towards breeding purposes, including Restriction Fragment Length Polymorphisms (RFPLs) (Saiki et al., 1985), Randomly Amplified Polymorphic DNA (RAPDs) (Williams et al., 1990), Amplified Fragment Length Polymorphisms (AFLPs) (Vos et al., 1995), Simple Sequence Repeats (SSRs) (Jacob et al., 1991), and Single Nucleotide Polymorphisms (SNPs). Molecular markers can be used to uniquely identify cultivars, characterize germplasm, and analyze diversity within a germplasm pool. Additionally, molecular markers can be used to construct linkage maps, which, when combined with phenotypic data, can allow genes controlling important traits to be mapped. Markers closely linked to these traits can be utilized by breeders in marker assisted selection (MAS) to select progeny carrying genes of interest.
7 of molecular markers available for use in crop species, only a few are commonly applied to turfgrass. Cool-season grasses have been leading the way in genetic analysis and molecular marker development, particularly SSRs (Mian et al. 2005; Saha et al. 2005; Wang et al. 2009). Tall fescue (Festuca arundinacea Schreb.), perennial ryegrass (Lolium perenne L.), Kentucky bluegrass (Poa pratensis L.), and creeping bentgrass (Agrostris stolonifera L.) are cool-season grasses that have been evaluated using molecular markers to assess their genetic diversity,
phylogeny, and genetic makeup as well as for QTL mapping and marker-assisted selection
(MAS). Molecular markers have also been used in warm-season turfgrasses, particularly in
bermudagrass, seashore paspalum (Paspalum vaginatum), and zoysiagrass (Zoysia sp.). Other
warm-season turfgrasses, such as centipede and St. Augustine grasses, have limited available genetic information and little is known about the genetic relationships and diversity of these turfgrasses.
8
Roldan-Ruiz et al. 2000; Guthridge et al. 2001; Kubik et al. 2001). In Kentucky bluegrass, genetic diversity studies using RAPDs revealed high levels of diversity within and among cultivars (Curley et al. 2004). In creeping bentgrass, numerous molecular marker techniques, including RAPDs, AFLPs, EST sequences, and SSRs have been used for germplasm identification (Golembiewski et al. 1997; Caceras et al. 2000; Vergara et al. 2004; Rotter et al. 2007; Kubik et al. 2009).
Bermudagrass is one of the most thoroughly genetically studied warm-season turfgrasses. Many techniques have been used to evaluate bermudagrass germplasm diversity, including DNA fingerprinting (Caetano-Anolles 1998; Anderson et al. 2001; Yerramsettuy et al. 2005), and AFLP (Zhang et al. 1999), RAPD (Roodt et al. 2002), and most recently SSR analysis (Karaca et al. 2002). Two AFLP studies showed that bermudagrass samples cluster by ploidy level and geographical distribution (Zhang et al. 1999; Wu et al. 2005), which is similar to results found for St. Augustinegrass using AFLPs (Milla-Lewis et al., 2013). St. Augustinegrass and centipedegrass have an extremely limited amount of genetic information available. Both AFLPs and SSRs have been used to evaluate St. Augustinegrass (Mulkey et al., 2013a; Mulkey et al., 2014) and SCRAs have been used in centipedegrass (Milla-Lewis et al., 2013a). In zoysiagrass, phylogenetic relationships of the different Zoysia species have been disputed in several publications using several different molecular marker systems (Yaneshita et al. 1997; Caetano-Anolles et al. 1998; Anderson 2000; Tsuruta et al. 2008; Chen et al. 2009; Tsuruta 2011; Kimball et al., 2012, Kimball et al., 2013). The continuum of overlapping morphological variation and the lack of genetic structure between the different Zoysia species seems to indicate a high level of admixture within zoysiagrass.
9 programs have made use of molecular markers for marker assisted selection (Roldan-Ruiz and Kolliker, 2010). While MAS is commonly mentioned in QTL mapping studies, its application has not been well documented. For most turfgrass species, there is a lack of available molecular markers to conduct large-scale association mapping studies. However, as sequencing technologies become cheaper, it is to be expected that more molecular markers, particularly SNPs, can be developed and these types of studies can proceed.
LINKAGE AND QTL MAPPING
The application of molecular markers towards linkage and QTL mapping in turfgrass species has been gaining ground in recent years. Mapping studies using molecular markers leading to the development of genetic maps can serve as important tools for breeding and population development. The majority of mapping studies have focused on cool season grasses such as colonial bentgrass (Rotter et al., 2009), perennial ryegrass (Jones et al., 2002), and tall fescue (Saha et al., 2005), but warm season grasses are beginning to receive attention as well (Karaca et al., 2002; Cai et al., 2005).
10 disequilibrium (LD). Soybeans (Glycine max (L.) Merr.), on the other hand, have lower rates of recombination resulting in lower LD, which reduces a geneticist’s ability to determine the location of gene(s) affecting a particular trait with linkage mapping.
Molecular marker-based genetic linkage maps have become a very important aspect of crop improvement, predominantly in economically important agronomic species. Cereal crop breeders and geneticists, in particular, utilize molecular markers to identify genes of interest. For most warm-season turfgrass species, linkage maps are just beginning to be developed. Bermudagrass and seashore paspalum are at the forefront of this type of research with zoysiagrass following them. For St. Augustinegrass, one molecular-based linkage map has been developed in a population segregating for gray leaf spot resistance (Mulkey et al., 2013). Warm-season turfgrasses are generally vegetatively propagated and therefore, a pseudo-F2 strategy is commonly employed to combat issues within these species.
Pseudo-F2 Testcross Strategy. Linkage maps are typically constructed using inbred
populations derived from an F1 of the cross between two highly inbred, putatively homozygous, parents. In outcrossing plants, such as St. Augustinegrass, segregating F2 or backcross populations are rarely available due to high rates of self-incompatibility within the species, significant genetic load, and the laborious nature and time requirements for population development. Linkage mapping in outcrossing species is further complicated as non-inbred parents are highly heterozygous, markers may be co-dominant or dominant, and the linkage phase of the marker alleles is rarely known (Maliepaard et al. 1997).
11 developed from homozygous parents whose progeny will typically segregate in a 1:1 fashion, F1 progeny derived from an outbreeding species will segregate genetically based on the meiotic recombination from both parents may they be heterozygous or homozygous (Zhang et al., 2012). This strategy has been employed in many turfgrass species including bermudagrass (Bethel et al., 2006), creeping bentgrass (Chakraborty et al., 2005; Bonos et al., 2011; Zhang et al., 2012), ryegrass (Lolium spp.) (Jones et al., 2002; Warnke et al., 2004; Studer et al., 2010), and tall fescue (Saha et al., 2005).
12 consequently, the accurate estimation of recombination frequencies within and between the two different marker systems becomes very important (Alves et al., 2010).
Recombination frequencies are utilized to test for linkage and to construct both parental linkage maps or to build an integrated map for the cross. Unlike the typical segregation of a diploid, full-sib family descendent from two fully inbred parents, the segregation of co-dominant markers within a pseudo-F2 population has the possibility of up to four alleles at a particular locus. When both parents are heterozygous at a locus, the expected segregation ratio is 1:1:1:1. In this case, the differences between the male and female recombination events can be estimated directly, rather than assumed to be equal as in F2 populations from inbred lines (Maliepaard et al., 1997). When only one parent is heterozygous at a locus, the expected segregation ratio is 1:1 and the recombination frequencies can only be used to construct that parent’s linkage map. For dominant markers, the expected segregation ratio should be 3:1 and the recombination frequencies can be used to build both parental linkage maps.
Another complicating factor in linkage analysis is that while a priori knowledge of a marker’s linkage phase is required to detect recombination events, for crosses with outbreeders the linkage phase is unknown. Four different scenarios have to be considered: (1) alleles linked in coupling phase in one parent and unknown in the other, (2) alleles linked by repulsion in one parent and unknown in the other, (3) alleles linked by coupling in both parents, and (4) alleles linked by repulsion in both parents. The particular linkage phase combination has to be deduced using the segregation of alleles in the population itself a posteriori by comparing LOD scores obtained for each combination (Bhering et al., 2008).
13 (Sorghum bicolor), soybean, and wheat for numerous phenotypic characteristics associated with yield as well as tolerances to both abiotic and biotic stresses (Forster et al., 2004). In turfgrass, the majority of QTL mapping has been in the cool-season grasses, particularly tall fescue (Xu et al., 1995; Saha et al., 2005; Fribourg et al., 2009) and ryegrass (Hayward et al., 1994; Bert et al., 1999; Jones et al., 2002; Warnke et al., 2004; Yamada and Forster, 2005; Xiong et al., 2007). QTL mapping in cool-season grasses has mainly focused on disease resistance, abiotic stress tolerance, reproductive development, i.e., self-incompatibility, and morphological characteristics (Forster et al., 2004). In tall fescue, forage digestibility, biomass yield, drought tolerance, and some morphological QTL have been identified using genetic maps (Fribourg et al. 2009; Saha et al. 2009). The success of molecular marker use and development in tall fescue has impacted research on other species of turfgrass as well. Molecular markers developed for tall fescue have been successfully transferred to several cool-season turfgrass species including meadow fescue, tetraploid fescue, and ryegrass for use in genetic studies (Saha et al. 2004; Saha et al. 2006). In perennial ryegrass, high-density genetic molecular marker maps have been developed and QTLs for morphological traits, winter-hardiness, and disease resistance have been identified (Jones et al. 2002a; Jones et al. 2002b; Faville et al. 2004; Yamada et al. 2004; Jensen et al. 2005; and Myulle et al. 2005). Molecular markers such as AFLPs have been used to build a linkage map in Kentucky bluegrass as well (Porceddu et al., 2002). In creeping bentgrass, several linkage maps have been built using EST sequences and SSR markers, and QTLs for disease resistance have been identified (Rotter et al. 2009; Bonos et al. 2011).
14 bermudagrass (Bethel et al., 2006; Harris-Schultz et al. 2010) and zoysiagrass (Jessup et al., 2011). Several genetic linkage maps of zoysiagrass have been constructed using RFLPs (Yaneshita et al., 1999), AFLPs (Cai et al., 2004), and SSR markers (Cai et al., 2005; Li et al. 2009). Yaneshita et al. (1999) reported five pairs of linkage groups shared a series of ordered, duplicated loci in a Zoysia japonica x Zoysia matrella mapping population indicating homology between Zoysia species. A significant number of SSRs have been developed for zoysiagrass as well (Cai et al. 2004; Tsuruta et al. 2005). Recently, the first linkage map was developed for St. Augustinegrass using AFLPs and SSRs, and markers linked to QTL conferring gray leaf spot resistance were identified (Mulkey et al., 2014).
15 markers from subsequent analyses once they are identified.
IMPORTANT FACTORS AFFECTING COLD TOLERANCE
Environmental stresses, such as drought and extreme temperatures, can have severe effects on plant growth and survival. Many factors affect the cold hardiness of a species including their response to cold acclimation, deacclimation, chilling injury, and freeze injury. Cool-season and warm-season species of turfgrass are largely characterized based on their ability to survive and thrive in a varying range of temperatures. Evaluation of St. Augustinegrass cultivar’s response to winter stress in Indiana, measured as percent winterkill, revealed a range of tolerance from zero to 100 percent survival (Moseley et al. 2010). Raleigh, one of the most cold tolerant St. Augustinegrass cultivars, does consistently well in the upper range of St. Augustinegrass’ northern geographic limitations. Somatic mutants of Raleigh were identified, which showed similar if not better tolerance to cold temperatures in comparison to Raleigh (Reynolds et al., 2009). Two lines, GF and GF2, had comparable cold tolerance to Raleigh and improved leaf texture. ‘Seville’ showed some of the lowest cold tolerance of all the genotypes assessed in the study.
16 biochemical changes, increase a plant’s ability to minimize freeze injury and ultimately enhance winter survival. Overall, plants typically suffer from dehydration and have smaller, darker leaves upon cold acclimation (Ebdon et al., 2002). However, different regions of a cold-acclimated plant can be affected differently. Young leaves, for example, are hardier than old leaves or the leaf apex and typically respond better to cold-acclimation (Beard, 1973).
Cool-season turfgrasses are well known for their ability to cold acclimate and greatly improve their ability to resist lower freezing temperatures than non-acclimated plants. In perennial grasses, cold acclimation is induced by decreases in temperature, light intensity, photoperiod, and water availability (Bertrand et al., 2013). The amount of water-soluble sugars and carbohydrates maintained during cold acclimation play an important role in survival. Warm-season turfgrasses appear to vary in their capacity to cold acclimate. Studies in saltgrass (Shahba et al, 2003), buffalograss (Qian et al, 2001), zoysiagrass (Patton-Reicher, 2007) and bermudagrass (Anderson et al, 1988; Anderson et al, 1993, Anderson et al, 2003) have indicated that warm-season grass species respond well to cold-acclimation resulting in better freezing tolerance. In St. Augustinegrass, several studies have revealed variability of individual genotype’s response to cold-acclimation. Maier et al. (1994b) found that Raleigh acclimates well to cold and has greater freezing tolerance than ‘FX-332’ and ‘Floratam’. Li et al. (2010) confirmed this finding and also developed an acclimation protocol based on Raleigh’s freezing response. Milla-Lewis et al. (2013a) also found differences between Raleigh and Seville’s cold acclimation response. ‘Floratam’, however, appears not to respond to cold acclimation (Fry et al., 1991; Busey, 2003).
17 relates to fluctuating temperatures during winter or early spring. Warm temperatures can deacclimate plants within hours or days and the return to cold temperatures can cause significant damage to the deacclimated plant. This is particularly important in the transition zone as 22°C days are not uncommon in the middle of the winter. Svenning et al (1997) and Taulavuon (2004) showed that deacclimation is regulated by environmental factors interacting with gene expression. During deacclimation, a significant increase of water content in rye crowns was observed, and it was hypothesized that water increase also occurs in other grass species (Gusta, 1976).
Previous studies in cool-season turf species have reported both temperature and duration of the deacclimation event can affect a plant’s ability to retain freeze tolerance gained from cold acclimation (Gay and Eagles, 1991; Jørgensen et al., 2010; Hoffman et al., 2013). Specifically, plants exposed to the highest deacclimation temperatures for the longest periods of time experience the greatest decreases in freezing tolerance (Gay and Eagles, 1991; Hoffman et al., 2013). Although relatively few studies have investigated the effects of deacclimation in warm-season turf species, available research in bermudagrass suggests that deacclimation adversely affects freezing tolerance and can rapidly cause significant physiological and metabolic changes (Chalmers and Schmidt, 1979; Zhang et al., 2011a; Zhang et al., 2011b).
18 rate, and the presence of leaf lesions (DiPaola and Beard, 1992; Stier and Fei, 2008). Chilling injury can disrupt cell membrane activity, which leads to electrolyte loss from the cytoplasm, the release of vascular substances, and loss of protein activity.
Freezing Injury.Freeze injury in plants involves the dynamics and kinetics of water as it interacts within different tissues of the plant (Livingston et al., 2006). In grasses, freezing begins in the roots, travels to the crown, and finally progresses upwards into shoots and leaves (Stier et al., 2003). Successful recovery from freezing stress depends upon the meristematic tissues inside crowns and nodes to survive freezing damage (Harrison, 1997; Livingston et al., 2005). Stoloniferous and rhizomatous turfgrass species have meristematic regions located within the nodes of stolons or rhizomes, which have the ability to develop new leaves, roots, and lateral shoots (Duble, 1996). In St. Augustinegrass for example, Milla-Lewis et al 2013b found that despite severe damage to all surrounding tissue 14 days after freezing, new shoots were produced within the meristematic regions of St. Augustinegrass nodes suggesting that these are the most freezing tolerant regions of a St. Augustinegrass plant. Milla-Lewis et al. (2013b) also discovered significant differences between the basal (oldest), mid, and apical (youngest) regions of individual stolons of St. Augustinegrass after freezing tests. The mid region of the stolon recovered significantly better than either basal or apical regions. Concentrating on these specific regions of turfgrass plants during freeze testing could provide accurate estimates of the freeze tolerance of St. Augustinegrass genotypes.
19 lengths and deeper rhizomes have the best freeze tolerances. Based on lethal temperature and winter survival measurements, Raleigh and Seville have some of the best and worst freezing tolerances of St. Augustinegrass cultivars (Philley et al., 1995, 1998).
Post-freeze survival of rhizomes, single stolon nodes, whole stolons, and whole plants has been used to estimate freeze tolerance in turf species (Bush et al., 2000; Dione et al., 2001; Qian et al., 2001; Anderson et al., 2003; Sahba et al., 2003; Patton et al., 2007). In St. Augustinegrass, single-node (Philley, 1995; Li et al., 2010), four-node (Maier et al., 1994b), and whole stolons (Milla-Lewis et al., 2013a) have been utilized. Differences between these experiments resulted in a fifty percent survival rate when freezing Raleigh at -4oC (Li et al, 2010) and sixty percent survival at -6.0oC (Maier et al, 1994a). Moreover, Milla-Lewis et al. (2013a) reported differences between survival of the basal, mid, and apical regions of St. Augustinegrass stolons indicating node age is an important factor in freeze tests. Therefore, based on previous research, differences in tissue-type and freezing methodologies are important factors to consider when comparing results across studies.
20 PHYSIOLOGICAL ASPECTS OF COLD TOLERANCE
Environmental abiotic stresses, such as cold temperatures, induce various biochemical and physiological responses in plants (Bray et al., 2000), particularly in their cellular membrane. Accumulation of sugars, proline, and other compounds is observed during these stresses and thought to play a role in osmotic adjustment.
Physiological Adaptations of Cell Membrane Composition in Response to Cold Stress. A primary target of freezing injury in plants is their cellular membrane, which primarily consists of lipids, proteins, sterols, and carbohydrates. The lipid bilayer is a gateway for material transfer, while the proteins within the membrane allow for selective transport and accrual of solutes such as carbohydrates. Physiological changes in the cellular membrane, particularly alterations of phospholipid and fatty acid composition, are important factors in cold acclimation and freezing tolerance. At low temperatures, cellular membranes undergo a phase transition from a fluid liquid crystalline phase to a more rigid gel phase where lipids are tightly packed together. Lipid compaction impedes normal physiological functions and can render the membrane more permeable and prone to rupture, which results in the loss of cytoplasmic components. During periods of low, non-freezing temperatures, new compounds are sometimes synthesized in an effort to circumvent or diminish the deleterious effects of cellular dehydration (Gusta et al., 1996), also known as cold acclimation.
21 saturation levels. Tolerance to some abiotic stresses, such as cold temperatures, is largely dependent on maintaining osmotic homeostasis within cells as well as the capacity of the cells to retain water molecules. Increased desaturation of fatty acid chains aids in maintaining the fluidity of the cellular membrane by increasing the number of double bonds, hence the number of kinks in the chain, which ultimately prevents the unsaturated fatty acids from packing together as tightly as saturated fatty acids.
The number of double bonds in membrane fatty acids is an indirect measure of the overall fluidity in the cells. Several unsaturated fatty acids have been shown to be important in cold tolerance in many plant species. Linolenic acid appears to play an important role in maintaining a fluid, liquid state in the cellular membrane. It is synthesized by a series of desaturase enzymes where stearic acid (C18:0) is desaturated to oleic acid (C18:1), then to linoleic acid (C18:2), and then to linolenic acid (C18:3), each converting a single to a double bond. The role of carbohydrates in response to low temperatures has been extensively evaluated in the grass family. Typically, an increase in soluble sugar concentrations in the autumn can be seen with a decrease in tissue starch concentration (Levitt, 1980). Sucrose, glucose, fructose, and raffinose have all shown changes in levels before and after the onset of low temperatures.
SCREENING METHODOLOGIES FOR FREEZING TOLERANCE
22 reproduce (Anderson and Taliaferro, 2002). Field observations commonly vary from location to location and from year to year, and also require extensive resources including personnel, adequate field space, and significant monetary investment. In order to circumvent these issues and to expand testing year-round, laboratory-based experiments can be a reliable and reproducible method to evaluate freeze tolerance. Moreover, screening in a controlled environment has generally corresponded well with field screenings (Anderson and Taliaferro, 2002; Qian et al., 2001).Thus, laboratory-based experiments could aid in the improvement of cold tolerance within a species in an efficient, inexpensive manner.
Two main laboratory-based methods have been developed to assess freeze tolerance in turfgrass species including measurement of electrolyte leakage (EL) (Gusta et al, 1980; Fry et al, 1991; Maier et al, 1994; Ebdon et al, 2002) and evaluation of tissue re-growth after freezing (Maier et al, 1994a; Li et al, 2010, Milla-Lewis et al., 2012b). Inconsistencies in studies implementing the EL procedure, including the underestimation of freeze tolerances in seashore paspalum (Cardona et al., 1997) and centipedegrass (Fry et al., 1993) as well as the overestimation of freeze tolerance in St. Augustinegrass (Maier et al., 1994a), imply the re-growth tests may be a better option to determine freeze tolerance in grasses (Patton and Reicher, 2007).
23 2001), carpetgrass (Bush et al., 2000), saltgrass (Sahba et al., 2003), and zoysiagrass (Patton et al., 2007). In the case of St. Augustinegrass, Philley et al. (1995) used the electrolyte leakage (EL) method with single-node stolons, and found that the cultivars Raleigh, ‘Texas Common’ and ‘Delmar’ could survive lower freeze temperatures than ‘Seville’, ‘Floratam’ and ‘FX-33’. Maier et al (1994b) evaluated the freezing response of four-node stolons placed in plastic bags and Li et al (2010) did the same using single-node stolons in plastic containers. Differences in technique between these experiments resulted in LT50’s as high as -4oC (Li et al, 2010) and as low as -6oC (Maier et al, 1994b).
Milla-Lewis et al. (2013b) compared different cold-acclimation and freezing temperature effects on two St. Augustinegrass cultivars using a whole-stolon rolled method (WSRM). Significant differences between Raleigh and Seville were found between all the different cold-acclimation and freezing temperatures. However, the 3°C cold-acclimation temperature and the -2oC freeze temperature seemed to provide the best separation of St. Augustinegrass cultivars using the WSRM (Milla-Lewis et al., 2013b). While the WSRM is effective for comparing a small number of cultivars, this method would not be appropriate for surveying a whole breeding population mainly due the space required for this procedure, including greenhouse and freezer space.
HERITABILITY OF COLD TOLERANCE
24 the identification of cold tolerant germplasm, limited progress has been made in breeding for cold tolerance in St. Augustinegrass. This is in part due to the complexity of the trait, insufficient genetic knowledge of tolerance components, lack of efficient selection criteria, and limited breeding efforts. Previous investigations in other crops (Bohnert et al 1995, Lyons et al 1979) have indicated that plant response to cold stress is a complex phenomenon, controlled by more than one gene and is highly influenced by environmental variation. These factors confound the separation of genetic control from non-genetic factors, both of which are essential in deciding the selection methods of tolerant materials. Similar situations were observed in studies of other traits. A study assessing the heritability of brown patch disease found a strong environmental influence in tall fescue progeny (Bokmeyer et al., 2009). A stability analysis to identify the most stable genotypes based on performance over multiple years and locations also revealed a significant environmental effect (Bokmeyer et al., 2009).
25 diploid genotypes using a diallel analysis. General combining ability was the largest source of variation for lethal temperature and winter survival. Narrow-sense heritabilities for winter survival ranged from 0.70 to 0.95 over a three year period.
26 REFERENCES
Ahring, R.M., and R.M. Irving. 1969. A laboratory method of determining cold hardiness in bermudagrass, Cynodon dactylon (L.) Pers. Crop Sci. 9:615-618.
Ahring, R.M., W.W. Huffine, C.M. Taliaferro, and R.D. Morrison. 1975. Stand establishment of bermudagrass from seed. Agronomy Journal 67:229-232.
Anderson, J.A. and C.M. Taliaferro. 2002. Freeze tolerance of seed-producing turf bermudagrasses. Crop Sci. 42:190-192.
Anderson, J.A., C.M. Taliaferro, and D.L. Martin. 1993. Evaluating freeze tolerance of bermudagrass in a controlled environment. HortScience 28:955.
Anderson, J.A., C.M. Taliaferro, and D.L. Martin. 2003. Longer exposure durations increase freeze damage to turf bermudagrasses. Crop Sci. 43:973–977.
Anderson, J.A., M.P. Kenna, and C.M. Taliaferro. 1988. Cold hardiness of ‘Midiron’ and ‘Tifgreen’ bermudagrass. HortSci. 23:748-750.
Barelli, M.A.A., M.C. Goncalves-Vidigal, A.T. de Amaral Jr., P.S.V. Filho, and C.A. Scapim. 1999. Diallel analysis of the combining ability of common bean (Phaseolus vulgaris L.) cultivars.
Bateman, D.R. 1980. Notice to sod producers and growers relative to the naming and release of the new St. Augustine cultivar ‘Raleigh’. N.C. Ag. Res. Serv. Raleigh, NC
Beard, J.B. 1973. Turfgrass: Science and Culture. Prentice Hall, Inc., Englewood Cliffs, N.J. p.658.
Bert, P.F., G. Charmet, P. Sourdille, M.D. Hayward, and F. Balfourier. 1999. A high-density map for ryegrass (Lolium perenne) using AFLP markers. Theor Appl Genet 99:445-452. Bertrand, A., Y. Castonguay, A. Azaiez, and J. Dionne. 2013. Turfgrass: Biology, Use, and
Management. Chapter 8: Low-temperature stress. ASA, CSSA, and SSSA. pg: 279-318.
Bethel, C.M., E.B. Sciara, J.C. Estill, J.E. Bowers, W. Hanna, and A.H. Paterson. 2006. A framework linkage map of Bermudagrass (Cynodon dactylon x transvaalensis) based on single-dose restrictions fragments. Theor Appl Genet 112:77-93.
Bhering L.L., Cruz C.D., God P.I.V.G. 2008. Estimation of recombination frequency in genetic mapping of full-sib families. Pesq Agropec Bras.43:363–369.
27 Bokmeyer, J.M., S.A. Bonos, and W.A. Meyer. 2009. Broad-sense heritability and stability
analysis of brown patch resistance in tall fescue. HortScience 44:289-292.
Bonos, S.A. 2011. Gene action of dollar spot in creeping bentgrass. J Phytopath 159:12-18. Busey, P. 1979. What is Floratam? Florida State Hort Soc Proc. 92: 228-232.
Busey, P., T.K. Broschat, and B.J. Center. 1982. Classification of St. Augustinegrass. Florida Agric. Exp. Stn. Journal Series No.2900.
Busey, P. 1986. Morphological identification of St. Augustinegrass cultivars. Crop Sci. 26:28-32.
Busey, P. 1995. Genetic diversity and vulnerability of St. Augustinegrass. Florida Agric. Exp. Stn. Journal Series No. R-04017.
Busey, P. 2003. Winter survival of St. Augustinegrass cultivars. HortScience 38(7):1439-1440. Busey, P., R. M. Giblin-Davis, and B. J. Center. 1993. Resistance in Stenotaphrum to the sting
nematode. Crop Sci. 33:1066-1070.
Cardona, C.A., R.R. Duncan, and O. Lindstrom. 1997. Low temperature tolerance assessment in Paspalum. Crop Sci. 37:1283-1291.
Chakraborty, N., J. Bae, S. Warnke, T. Chang, and G. Jung. 2005. Linkage map construction in allotetraploid creeping bentgrass (Agrostis stolonifera L.). Theor Appl Genet 111:795-803. DiPaola, J.M. and J.B. Beard. 1992. Physiological effects of temperature stress. In D.V.
Waddington et al., (ed.) Turfgrass. Agron. Monogr. 32. ASA, CSSA, and SSSA, Madison, WI. p.231-268.
Duble, R.L. 1996. Turfgrasses, their management and use in the southern zone. Second Edition. Texas A&M University press. College Station, Texas.
Ebdon, J.S., R.A. Gagne, and R.C. Manley. 2002. Comparative cold-tolerance in diverse turf quality genotypes of perennial ryegrass. Crop Sci. 43:973-977.
Forster, J.W., E.S. Jones, J. Batley, and K.F. Smith. 2004. Molecular marker-based genetic analysis of pasture and turfgrasses. Mol. Breeding of Forage and Turf. 197-238.
Fribourg, H., D. Hannaway, and C. West. 2009. Tall fescue for the twenty-first century. ASA. Madison, Wi.
28 Fry, J.D., N.S. Lang, and R.G.P. Clifton. 1991. Freezing resistance and carbohydrate
composition of ‘Floratam’ St. Augustinegrass. HortSci 26:1537-1539.
Fry, J.D., N.S. Lang, R.G.P. Clifton, and F.P. Maier. 1993. Freezing tolerance and carbohydrate content of low temperature-acclimated and non-acclimated centipedegrass. Crop Sci. 33:1051-1055.
Genovesi, A.D., R.W. Jessup, M.C. Engelke, and B.L. Burson. 2009. Interploid St. Augustinegrass [Stenotaphrum secundatum (Walt.) Kuntze] hybrids recovered by embryo rescue. In Vitro Cell. Dev. Bio. Plant 45:659-666.
Gusta, L.V., J.D. Butler, C. Rajashekar, and M.J. Burke. 1980. Freezing resistance of perennial turfgrasses. HortScience 15:494-496.
Grando, M.S., D. Bellin, K.J. Edwards, C. Pozzi, M. Stefanini, and R. Velasco. 2003. Molecular linkage maps of Vitis vinifera L. and Vitis riparia Mchx. Theor Appl Genet 106:1213-1224.
Griffing, B. 1956. Concept of general and specific combining ability in relation to diallel crossing systems. Aust. J. Bio. Sci. 9:463-493.
Harrison, J., C. Tonkinson, C. Eagles, and C. Foyer. 1997. Acclimation to freezing temperatures in perennial ryegrass (Lolium perenne). Acta Physiologiae Plantarum 19:505-515.
Hayward, M.D., N.J. Mcadam, J.G. Jones, C. Evans, G.M. Evans, J.W. Forester, A. Ustin, K.G. Hossain, B. Quader, M. Stammers, and J.K. Will. 1994. Genetic markers and the selection of quantitative traits in forage grasses. Euphytica 77:269-275.
Hoffman,L., M. DaCosta, J.S. Ebdon, and E. Watkins. 2010. Physiological changes during cold acclimation of Perennial Ryegrass accessions differing in freeze tolerance. Crop Sci 50:1037–1047.
Jessup, R.W., K. Renganayaki, J.A. Reinert, A.D. Genovesi, M.C. Engelke, A.J. Paterson, T.L. Kamps, S. Schulze, A.N. Howard, B. Gilberto, and B.L. Burson. Genetic mapping of fall armyworm resistance in zoysiagrass. Crop Sci. 51:1774-1783.
Jones, E.S., M.P. Dupal, J.L. Dumsday, L.J. Hughes, and J.W. Forster. 2002. An SSR-based genetic linkage map for perennial ryegrass (Lolium perenne L.). Theor Appl Genet 105:577-584.
Kramer, C.Y. 1956. Extension of multiple range tests to group means with unequal numbers of replications. Biometrics 12: 307-310.
29 Li, R., A.H. Bruneau, and R. Qu. 2009a. Tissue-cultured induced morphological somaclonal
variation in St. Augustinegrass [Stenotaphrum secundatum (Walt.) Kuntze] Plant Breed Li, R., A.H. Bruneau, and R. Qu. 2009b. Morphological mutants of St. Augustinegrass induced
by gamma ray irradiation. Plant Breed (in press)
Li, R.., R. Qu, A.H. Bruneau, and D.P. Livingston. 2010. Selection for freezing tolerance in St. Augustinegrass through somaclonal variation and germplasm evaluation. Plant Breeding 129:417-421.
Li, X., X. Wang, Y. Wei, and E.C. Brummer. 2011. Prevalence of segregation distortion in diploid alfalfa and its implications for genetics and breeding applications. Theor Appl Genet 123:667-679.
Livingston, D.P., S. P. Tallury, R. Premkumar, S. A. Owens, and C. R. Olien. 2005. Changes in the histology of cold-hardened oat crowns during recovery from freezing. Crop Sci. 45:1545–1558.
Livingston, D.P., III, S.P. Tallury, S. Owens, J.D. Livingston, and R. Premakumar. 2006. Freezing in non-acclimated oat: thermal response and histological observations of crowns during recovery. Can. J. Bot. 84:199–210.
Long, J. A., and E.C. Bashaw. 1961. Microsporogenesis and chromosome numbers in St. Augustinegrass. Crop Sci. 1:41-43.
Lyons, J.M., D. Graham, J.K. Raison. 1979. Low Temperature stress in crop plants: the role of the membrane. Academix Press, New York.
Maier, F.P., N.S. Lang, and J.D. Fry. 1994a. Evaluation of an electrolyte leakage technique to predict St. Augustinegrass freezing tolerance. HortScience 29:316–318.
Maier, F. P., N. S. Lang, and J.D. Fry. 1994b. Freezing tolerance of three St. Augustinegrass cultivars as affected by stolon carbohydrate and water content. J. Amer. Soc. Hort. Sci. 119:473-476.
Maliepaard, C., J. Jansen, and J.W. Van Ooijen. 1997. Linkage analysis in a full-sib family of an outbreeding plant species: overview and consequences for applications. Genet. Res. 70:237-250.
McCarty, L.B. and J.L. Cisar. 1995. St. Augustinegrass for Florida Lawns. University of Florida: Florida Cooperative Extension Service. Fact Sheet ENJ-5(a).
30 Milla-Lewis, S.R., Zuleta, M.C., Van Esbroeck, G.A., Quesenberry, K.H., Kenworthy, K.E.
2013a. Cytological and molecular assessment of genetic diversity in Stenotaphrum germplasm. Crop Sci. Vol. 53 No. 1, p. 296-308.
Milla-Lewis, S.R., J.A. Kimball, T.E. Claure, T.D. Tuong, C. Arellano, and D.P. Livingston III. 2013b. Freezing tolerance and the histology of recovering nodes in St. Augustinegrass. Int. Turfgrass Soc. J 12 p. 523-530.
Moseley, D., A. Patton, and J. Trappe. 2012. Winter hardiness of thirty St. Augustinegrass genotypes. Arkansas Turfgrass Report 2010, Ark. Ag. Exp. Stn. Res. Ser. 593:79-84. Mulkey, S.E., M.C. Zuleta, J.E. Keebler, J.E. Schaff, and S.R. Milla-Lewis. 2013a.
Development and characterization of simple sequence repeat markers for St. Augustinegrass. Crop Sci. 54:1 401-412.
Mulkey, S.E., Zuleta, M.C., Van Esbroeck, G.A., Lu, H.J., Kenworthy, K.E., Milla-Lewis, S.R. 2013b. Genetic analysis of a St. Augustinegrass germplasm collection using AFLP markers and flow cytometry. International Turfgrass Society Research Journal 12 p. 281-291.
Mulkey, S., E. Carbajal, M.C. Zuleta, B. Ma, and S.R. Milla-Lewis. 2014. Identification of QTL for resistance to grey leaf spot disease in St. Augustinegrass. Crop Sci. (in review). North Carolina Department of Agriculture and Consumer Services and National Agricultural
Statistics Service U.S. Department of Agriculture. 1999. North Carolina Turfgrass Survey. North Carolina Agricultural Statistics, Raleigh, NC.
Patton, A.J. and Z.J. Reicher. 2007. Zoysiagrass species and genotypes differ in their winter injury and freeze tolerance. Crop Sci. 47:1619-1627.
Philley, H.W., C.E. Watson Jr., J.V. Krans, J.M. Goatley Jr., and F.B. Matta. 1995. Differential thermal analysis of St. Augustinegrass. HortScience 30:1388-1389.
Philley, H., C. Watson, J. Krans, J. Goatley, V. Maddox, and M. Tomaso-Peterson. 1998. Inheritance of cold tolerance in St. Augustinegrass. Crop Sci. 38:451-454.
Qian, Y.L., S. Ball, Z. Tan, A.J. Koski, and S.J. Wilhelm. 2001. Freezing tolerance of six cultivars of buffalograss. Crop Sci. 41:1174–1178.
Reynolds, W.C., R. Li, K. De Silva, A.H. Bruneau, and R. Qu. 2009. Field performance of mutant and somaclonal variation lines of St. Augustinegrass [Stenotaphrum secundatum (Walt.) Kuntze]. Intl. Turfgrass Soc. Res. J. 11:573-582.
31 Saha, M.C., R. Mian, J.C. Zwonitzer, K. Chekhovskly, and A.A. Hopkins. 2005. An SSR- and
AFLP-based genetic linkage map of tall fescue (Festuca arundinacea Schreb.). Theor Appl Genet 110:323-336.
Sauer, J.D. 1972. Revision of Stenotaphrum (Gramineae: Paniceae) with attention to its historical geography. Brittonia 24: 202-222.
SAS Inst. Inc. 2008. SAS/STAT 9.2 User’s Guide. SAS Inst., Inc. Cary, NC.
Schuelke, M. 2000. An economic method for the fluorescent labeling of PCR fragments. Nature Biotech. 18: 233-234.
Shahba, M.A., Y. L. Qian, H.G. Hughes, A. J. Koski, and D. Christensen. 2003. Relationships of soluble carbohydrates and freeze tolerance in saltgrass. Crop Sci. 43:2148-2153.
Sifers, S. and J. Beard. 1999. Drought resistance in warm-season grasses: A lengthy dry spell tests St. Augustinegrass, centipedegrass, paspalum, and buffalograss. Golf Course Management. September issue.
SPSS Inc. 2002. Sigmascan Pro 5.0. SPSS Science, Chicago, IL, USA.
Stavang, J., M. Hansen, and J.E. Olsen. 2008. Short term temperature drops do not enhance cold tolerance. Plant Growth Regul 55:199–206.
Stier, J.C., D. L. Filiault, M. Wisniewski, and J. P. Palta. 2003. Visualization of freezing progression in Turfgrassses using infrared video thermography. Crop Sci 43:415–420. Stier, J.C. and S. Fei. 2008. Cold-stress physiology and management of turfgrasses. In:
Handbook of turfgrass management and physiology. CRC Press. Taylor & Francis Group. Az. p.473-495.
Stein N., G. Herren, and B. Keller. 2001. A new DNA extraction method for high-throughput marker analysis in a large-genome species such as Triticum aestivum. Plant Breed. 120:354-356.
Studer, B. 2010. EST-derived SSR markers used as anchor loci for the construction of a consensus linkage map in ryegrass (Lolium spp.). Plant Biology 10:177.
Van Ooijen, J.W. 2006. JoinMap ® 4, Software for the calculation of genetic linkage maps in experimental populations. Kyazma B.V., Wageningen, Netherlands.
Vos, P., R. Hogers, M. Bleeker, M. Reijans, T. van de Lee, M. Hornes, A. Frijters, J. Pot, J. Peleman, M. Kuiper, and M. Zabeau. 1995. AFLP: a new technique for DNA fingerprinting. Nucleic Acids Res. 23:4407–4414.
32 Statistics, North Carolina State University, Raleigh, NC. (http://statgen.ncsu.edu/qtlcart/WQTLCart.htm)
Warnke, S.E., R.E. barker, G. Jung, S.C. Sim, M.A. R. Mian, M.C. Saha, I.A. Brilman, M.P. Dupal and J.W. Forster. 2004. Genetic linkage mapping of an annual x perennial ryegrass population. Theor Appl Genet 109:294-304.
Xiong, Y., S. Fei, R. Arora, E.C. Brummer, R.E. Barker, G. Jung, and S.E. Warnke. 2007. Identification of quantitative trait loci controlling winter hardiness in an annual x perennial ryegrass interspecific hybrid population. Mol Breeding 19:125-136.
Xu, W., D. Sleper, and S. Chao. 1995. Genome mapping of polyploidy tall fescue (Festuca arundinacea Schreb.) with RFLP markers. Theor Appl Genet 91:947-955.
Yamada, Y., M.A.R. Mian, and J.H. Bouton. 2006. Recent molecular and genomic studies on stress tolerance of forage and turf grasses. Crop Sci. 46:497-511.
33 -CHAPTER II-
Combining Ability for Winter Survival and Turf Quality Traits in St. Augustinegrass
34 ABSTRACT
New elite St. Augustinegrass varieties with improved cold tolerance and desirable turf quality are needed for the turf industry in the transition zone of the United States. In order to efficiently utilize sources of cold tolerance in a breeding program, an understanding of the genetic control of this trait and its relationship to important turf quality traits is required. Therefore, the objective of this study was to estimate general and specific combining abilities for cold tolerance and turf quality traits. Six diploid genotypes of St. Augustinegrass were selected as parents for a diallel mating design without reciprocals. Hybrid progenies and self-pollinated populations were evaluated over three years at two locations. The true hybridity of crosses was confirmed using molecular markers. Combining ability analysis revealed that both general and specific combining abilities were significant across years and locations. Specific combining ability was the largest source of genetic variation for winterkill, genetic color, turf density, and end-of-season cover indicating that non-additive gene effects play a key role in the inheritance of these traits. The parental genotype GF2 was identified as a promising parent for future breeding efforts as it provided positive GCA effects for both cold tolerance and turf quality traits, which were not significantly correlated with one another. Lines identified as parental selfs generally showed lower winter survival and inferior turf quality than the original parental lines indicating that inbreeding depression can occur in St. Augustinegrass. This study provides information regarding the combining ability of cold tolerance and turf quality traits in St. Augustinegrass, which will ultimately aid in parental selection for breeding efforts in the species.
35 INTRODUCTION
St. Augustinegrass (Stenotaphrum secundatum [Walt.] Kuntz) is a warm-season, perennial grass species commonly utilized in the turfgrass industry for its superior shade tolerance and stoloniferous growth habit. However, winter survival is a major limiting factor for the species affecting its area of adaptation and marketability, specifically in the transition zone of the United States. Additionally, the most cold-tolerant cultivars currently available often lack the aesthetic characteristics, such as a semi-dwarf growth habit and fine leaf texture that are desirable in the market. Therefore, new St. Augustinegrass cultivars with improved cold tolerance and desirable turf quality are needed for the turfgrass industry in the transition zone of the United States.
Studies have reported significant variability in winter survival and freezing tolerance among present-day varieties (Moseley et al., 2010, Reynolds et al., 2009, Milla-Lewis et al., 2013, Kimball et al., 2015 a and b). A cold hardy cultivar, ‘Raleigh’, performs consistently well in the upper range of the species’ geographic limits. However, Raleigh’s coarse leaf texture and long internodes when compared to other St. Augustinegrass cultivars as well as other warm-season turfgrasses are often undesirable (Reynolds et al., 2009). Somatic variants and gamma-ray mutants of Raleigh were developed in 2004 (Li, 2007). In comparison to Raleigh, they had similar cold hardiness as well as improved aesthetic characteristics (Reynolds et al., 2009). On the other hand, available commercial cultivars with good turf quality often have limited cold tolerance. Seville, a popular cultivar well liked for its semi-dwarf habit, fine-leaf texture, and dark green color, exhibits high levels of winterkill (Riordan et al., 1980; Philley et al., 1996; Moseley et al., 2010).