IOP Conference Series: Materials Science and Engineering
OPEN ACCESS
Meta-analysis of the relationship between TQM
and Business Performance
To cite this article: Ahmad M F et al 2013 IOP Conf. Ser.: Mater. Sci. Eng. 46 012020
View the article online for updates and enhancements.
Related content
List of Committee and Editorial: MEST2017
-Effect of strain rates on tensile and work hardening properties for Al-Zn magnesium alloys
A L Noradila, Z Sajuri, J Syarif et al.
-Causal Analysis of ISO/TS16949 Efforts in Automotive Industry
Norhayati Zakuan, Mohd Shoki Md Ariff, Mohd Norfian Alifiah et al.
-Recent citations
An Analysis of the Impact of Total Quality Management on Employee Performance with mediating role of Process Innovation Aimie Nadia Dedy et al
-Identifying Critical Success Factors for TQM and Employee Performance in Malaysian Automotive Industry: A Literature Review
Aimie Nadia Dedy et al
-Mediator effect of statistical process control between Total Quality Management (TQM) and business performance in Malaysian Automotive Industry
M F Ahmad et al
Meta-analysis of the relationship between TQM and Business
Performance
Ahmad, M.F1,2, Zakuan, N2, Jusoh, A.2 , Tasir, Z.3 and Takala, J.4,
1 Department of Production and Operation, Faculty of Technology Management and Business, Universiti Tun Hussein Onn Malaysia (UTHM), Parit Raja, Batu Pahat, Johor, Malaysia
2 Department of Management, Faculty of Human Resource and Management, Universiti Teknologi Malaysia (UTM), Skudai, Johor, Malaysia
3 Department of Foundation of Education, Faculty of Education, Universiti Teknologi Malaysia (UTM), Skudai, Johor, Malaysia 4 Department of Engineering Science and Industrial Management, University of Vaasa, Finland
E-mail: [email protected]
Abstract. Meta-analysis has been conducted based on 20 previous works from 4,040 firms at 16 countries from Asia, Europe and America. Throughout this paper a meta-analysis, this paper reviews the relationships between TQM and business performance amongst the regions. Meta-analysis result concludes that the average of rc is 0.47; Asia (rc=0.54), America (rc=0.43) and Europe (rc=0.38). The analysis also shows that Asia developed countries have greatest impact of TQM (rc=0.56). However, the analysis of ANOVA and t-test show that there is no significant difference amongst type of country (developed and developing countries) and regions at p=0.05. In addition, the average result of rc2 is 0.24; Asia (rc2=0.33), America
(rc2=0.22) and Europe (rc2=0.15). Meanwhile, rc2 in developing countries (rc2=0.28) are higher
than developed countries (rc2=0.21).
1.0 Introduction
The concept of total quality management (TQM) has been developed as a result of intense global competition [1]. Firms that manage the international trade in global competition have put emphasis on TQM philosophy, procedures, tools and techniques. Juran [2] defines TQM as philosophy aimed at achieving business excellence through the application of tools and technique, as well as the management of soft aspects, such as human motivation in work. Furthermore, Demirbag et.al [3] defines TQM as a management philosophy aims to contribute continuous improvement in the organization with the participation of all employees to achieve customer satisfaction by producing better, cheaper, faster and safer than competitors. The role of TQM in improving business performance is broadly agreed in the literature and empirical study [4],[5],[6]. TQM helps to manage the firm to improve the effectiveness and business performance to achieve world class status for the past two decades [7]. However, the study of mediators and moderators is neglected and is referred to less frequently in literature review. Contingency theory proposes that organizations can create congruence between organizational structure and environmental uncertainty will achieve higher
MOIME 2013 IOP Publishing
performance result (Ellis et.al., 2002). It means that there is "no a best way" to manage an organization, but the best management base on the circumstances and the environment. Thus, one of the objectives of this study is to empirically analyse and compare the affect the relationships amongst TQM and business performance in difference environment base on the difference type of country and the region.
2.0 Methodology
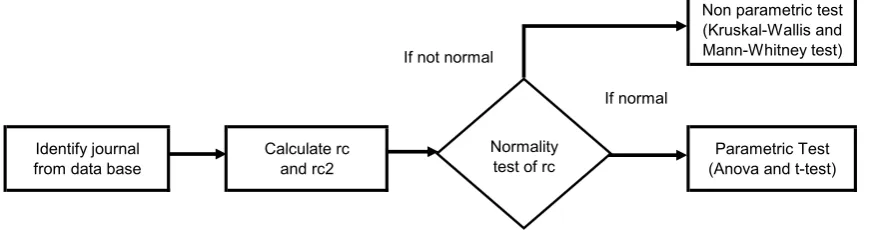
An extensive literature search was designed to identify and retrieve primary empirical studies relevant to the project’s major research question. The databases searched were SpringerLink, Emerald, Taylor & Francis, ScienceDirect, Elsevier, ProQuest and Google Scholar. The descriptor TQM was used when possible; otherwise, it was searched as a keyword. The publication period is between 2003 until 2012. First, researchers find-out the study that used Structural Equitation Modeling (SEM) and regression in their methodology to identify the rc value between TQM and business performance as shown in figure 1. Based on the data, normality test was conducted to determine the type of test. In this study, ANOVA and t-test are used to test the differences between the groups. In the next section, researchers will discuss the result of this study.
Non parametric test (Kruskal-Wallis and Mann-Whitney test)
Identify journal from data base
Calculate rc and rc2
Parametric Test (Anova and t-test) Normality
test of rc
If normal If not normal
Figure 1: Flow-chart of Methodology
3.0 Result
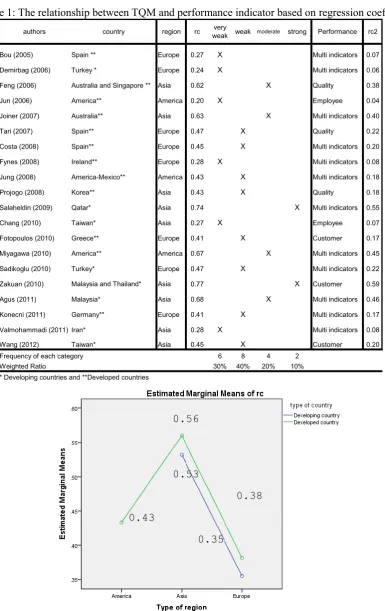
The next step is to examine how strong the relationship between TQM and performance indicators. A Meta-analysis has been conducted based on 20 previous works from 4,040 firms at 16 countries from Asia, Europe and America. The methods of measuring the relationships in previous study are Structural Equation Modeling (SEM) and linear regression [9],[10]. The regression coefficient (rc) shows the strength of the relationships. Analysis have been made to understand the strength of the relationship, which is categorized into five levels; very weak (0.00-3.0), weak (0.31-0.50), moderate (0.51-0.70), strong (0.71-0.90) and very strong (0.91-1.00). Furthermore, percentage ratio of each category has been calculated to understand the weighted ratio of each category. The analysis results show the regression coefficient (rc) of the relationship is between 0.12 (weak) and 0.77 (strong). The overall mean for rc is 0.46, which is categorized as weak. In particular, the weighted ratio of category are 30% (very weak), 40% (weak), 20% (moderate), 10% (strong) and very strong (0%) as shown in Table 1. This result indicated that 70% of the results show weak relationship. It can be concluded that there are still inconsistent result of the relationship although most of the results are significant. On the other hand, the majority of the results show that the relationships are still weak and moderate. Based on Table 1, the country has been divided into two groups; developing and developed countries. First, normality test are conducted to confirm whether the data is normal. Kolmogorov-Smirnov test result shows that p value is 0.58 (p>0.05), it means that rc value is normal data. Further analysis has been made to compare the relationship between developed and developing countries to confirm whether
MOIME 2013 IOP Publishing
IOP Conf. Series: Materials Science and Engineering 46 (2013) 012020 doi:10.1088/1757-899X/46/1/012020
there are any differences based on rc value as shown in Table 1. The result shows that there is no significant difference between the rc among developed and developing countries based on t-test. However, the rc average value of developed countries is 0.49 compared to developing countries, 0.44. It means that the developed countries have higher impact of TQM practices compare to developing countries. Furthermore, the comparative analysis was carried out among three regions; America, Europe and Asia based on rc value in Table 1. One-way ANOVA is used to analyze the differences among the regions. The result shows that there is no significant difference among the regions. However, it is surprising that Asia region has the highest rc among the regions. Further analysis with two way ANOVA have been conducted to confirm whether there are any interaction between the type of country and the region. The result indicates p value is 0.993 (p>0.05), which indicates no significant interaction between them. Overall result shows that type of countries and regions have no significant effect to the strength of the relationship between TQM and business performance. However, Asia countries particularly developed countries have shown higher impact of performance than other countries as shown in Figure 2.
The next is to examine how much variance effect in firm performance caused by TQM. Rc squared (rc2) is a measure of the amount of variability in firm performance that is explained by TQM [11]. Based on Table 1, rc2 has been calculated of each country for further analysis. The overall average result of rc2 is 0.24, which can be categorized as very weak. It means that firm performance can be accounted for 24% of variation in TQM. ANOVA and t-test result show that there is no significant difference amongst type of country (developed and developing countries) and regions. It is surprising that Asia developing countries have the highest (rc2=0.33) and it shows that these countries are in the right track in TQM implementation. However, the European developed countries show the lowest value (rc=0.14). Further analysis with two way ANOVA have been conducted to confirm whether there are any interaction between the type of country and the regions. The result indicates p value is 0.929 (p>0.05), which indicates no significant interaction between them.
4.0 Discussion
It was expected that impact of TQM practices among developed countries would be superior. It is proven true , based on the analysis result. This study indicates that developed countries have higher relationship performance compared to developing countries. It means that developed countries have higher impact of TQM implementation. However, the study reveals that there is no significant different of relationships between developed countries and developing countries. Based on this study, developed countries in Asia have showed a higher impact of TQM performance. It explains that Asia countries such as Korea and Japan have not only higher TQM performance [12],[13] but also higher impact of TQM practices on their business performance. It is expected that these countries will continuously dominate the world market through TQM practices and customer satisfaction [14].
5.0 Conclusion
The main objectives of this study are to examine the relationship between TQM and business performance with extensive meta-analysis. Meta-analysis result concludes that the average of rc is 0.47; Asia (rc=0.54), America (rc=0.43) and Europe (rc=0.38). The analysis also shows that Asia developed countries have greatest impact of TQM (rc=0.56). In contrast, European developing countries have the lowest (rc=0.35). In addition, the average result of rc2 is 0.24; Asia (rc2=0.33),
America (rc2=0.22) and Europe (rc2=0.15). Meanwhile, rc2 in developing countries (rc2=0.28) are
higher than developed countries (rc2=0.21). It has proved that relationship between TQM and business performance are based on contingency theory namely type of region and country. European countries should focus on how to improve the impact of TQM on business performance in the future.
MOIME 2013 IOP Publishing
Table 1: The relationship between TQM and performance indicator based on regression coefficient
year authors country region rc weakvery weak moderate strong Performance rc2
2005 Bou (2005) Spain ** Europe 0.27 X Multi indicators 0.07
2006 Demirbag (2006) Turkey * Europe 0.24 X Multi indicators 0.06
Feng (2006) Australia and Singapore ** Asia 0.62 X Quality 0.38
Jun (2006) America** America 0.20 X Employee 0.04
2007 Joiner (2007) Australia** Asia 0.63 X Multi indicators 0.40
Tari (2007) Spain** Europe 0.47 X Quality 0.22
2008 Costa (2008) Spain** Europe 0.45 X Multi indicators 0.20
Fynes (2008) Ireland** Europe 0.28 X Multi indicators 0.08
Jung (2008) America-Mexico** America 0.43 X Multi indicators 0.18
Projogo (2008) Korea** Asia 0.43 X Quality 0.18
2009 Salaheldin (2009) Qatar* Asia 0.74 X Multi indicators 0.55
2010 Chang (2010) Taiwan* Asia 0.27 X Employee 0.07
Fotopoulos (2010) Greece** Europe 0.41 X Customer 0.17
Miyagawa (2010) America** America 0.67 X Multi indicators 0.45
Sadikoglu (2010) Turkey* Europe 0.47 X Multi indicators 0.22
Zakuan (2010) Malaysia and Thailand* Asia 0.77 X Customer 0.59
2011 Agus (2011) Malaysia* Asia 0.68 X Multi indicators 0.46
Konecni (2011) Germany** Europe 0.41 X Multi indicators 0.17
Valmohammadi (2011) Iran* Asia 0.28 X Multi indicators 0.08
2012 Wang (2012) Taiwan* Asia 0.45 X Customer 0.20
Frequency of each category 6 8 4 2
Weighted Ratio 30% 40% 20% 10%
* Developing countries and **Developed countries
Figure 2: rc comparison between type of country and region
0.56
0.53
0.38
0.35 0.43
MOIME 2013 IOP Publishing
IOP Conf. Series: Materials Science and Engineering 46 (2013) 012020 doi:10.1088/1757-899X/46/1/012020
References:
[1] T. Laosirihongthong, “A Comparative Study of Implementation of Manufacturing Strategies in Thai and Indian Automotive Manufacturing Companies,” Industrial Engineering, vol. 24, no. 2, 2005.
[2] J. M. Juran, Juran’s Quality Handbook. Singapore: McGRAW-HILL, 1998.
[3] M. Demirbag, E. Tatoglu, M. Tekinkus, and S. Zaim, “An analysis of the relationship between TQM implementation and organizational performance: Evidence from Turkish SMEs,” Journal of
Manufacturing Technology Management, vol. 17, no. 6, pp. 829-847, 2006.
[4] B. Fynes, S. de Búrca, and J. Mangan, “The effect of relationship characteristics on relationship quality and performance,” International Journal of Production Economics, vol. 111, no. 1, pp. 56-69, Jan. 2008.
[5] Prajogo and S. W. Hong, “The effect of TQM on performance in R&D environments: A perspective from South Korean firms,” Technovation, vol. 28, no. 12, pp. 855-863, Dec. 2008.
[6] I. Sila, “Examining the effects of contextual factors on TQM and performance through the lens of organizational theories: An empirical study,” Journal of Operations Management, vol. 25, no. 1, pp. 83-109, Jan. 2007.
[7] V. Arumugam, K.-B. Ooi, and T.-C. Fong, “TQM practices and quality management performance: An investigation of their relationship using data from ISO 9001:2000 firms in Malaysia,” The TQM Journal, vol. 20, no. 6, pp. 636-650, 2008.
[8] S. Ellis, T. Almor, and O. Shenkar, “Structural contingency revisited: toward a dynamic system model,”
Emergence, vol. 4, no. 4, pp. 51-85, 2002.
[9] N. M. Zakuan, S. M. Yusof, and T. Laosirihongthong, “Total Quality Management & Business Excellence Proposed relationship of TQM and organisational performance using structured equation modelling,” Total Quality Management, vol. 21, no. March 2012, pp. 37-41, 2010.
[10] A. Agus and Z. Hassan, “Enhancing Production Performance and Customer Performance Through Total Quality Management (TQM): Strategies For Competitive Advantage,” Procedia - Social and Behavioral Sciences, vol. 24, pp. 1650-1662, Jan. 2011.
[11] A. Field, Discovering Statistics Using SPSS, 2nd ed. London: Sage Publication, 2009.
[12] A. G. Garvin, Managing Quality. New York: The Free Press, 1988.
[13] M. F. B. Ahmad and S. M. Yusof, “Comparative study of TQM practices between Japanese and non-Japanese electrical and electronics companies in Malaysia: Survey results,” Total Quality Management & Business Excellence, vol. 21, no. 1, pp. 11-20, Jan. 2010.
[14] M. Ahmad, S. Yusof, and N. Yusof, “Comparative study of quality practices between Japanese and non-Japanese base electrical and electronic companies in Malaysia: A Survey,” vol. 47, no. A, pp. 75-89, 2008.
MOIME 2013 IOP Publishing