20th International Conference on Structural Mechanics in Reactor Technology (SMiRT 20) Espoo, Finland, August 9-14, 2009 SMiRT 20-Division 3, Paper 1913
Condensation Pool Experiments at LUT Supporting CFD and Structural
Analysis Tool Development
Markku Puustinen
a, Antti Räsänen
a, Jani Laine
a, Heikki Purhonen
a, Timo Pättikangas
band
Antti Timperi
ba
LUT Energy, Faculty of Technology, Lappeenranta University of Technology, Lappeenranta, Finland e-mail: [email protected]
b
VTT Technical Research Centre of Finland, Espoo, Finland
Keywords: Thermal hydraulics, fluid-structure interaction, direct contact condensation.
1
ABSTRACT
Nuclear power plant safety has been experimentally investigated at Lappeenranta University of Technology (LUT). In addition to the thermal hydraulic studies it has been beneficial to add instrumentation for structural measurements into the test facilities as well. This way, running tests aiming to solve thermal hydraulic problems, can also serve other purposes such as producing data for developing tools for Computational Fluid Dynamics (CFD) and structural analysis.
At VTT, coupling of commercial CFD and structural analysis codes has been done for analyzing Fluid-Structure Interaction (FSI). One-way coupled calculations, in which only the pressure is transferred to the structure, were first carried out with an in-house code based on the MpCCI library. Later commercial middleware ES-FSI and MpCCI have been used for analyzing also two-way FSI, in which the deformations of the structure are accounted for in the flow solution (Räty and Puska, 2006).
The main goal of the work at LUT has been to gather data of structural loads from thermal hydraulic tests. Coupled CFD and structural analysis codes can then be validated against measured structural loads related to thermal hydraulic phenomena such as rapid condensation, gas bubble formation and detachment.
2
INTRODUCTION
Nuclear power plant safety has been experimentally investigated at Lappeenranta University of Technology (LUT) for over 30 years. Several thermal hydraulic test facilities have been designed and constructed. In addition to the thermal hydraulic studies it has been beneficial to add instrumentation for structural measurements into the test facilities as well. This way running tests aiming to solve problems related to thermal hydraulic problems can also serve other purposes such as producing data for developing tools for structural analysis.
Numerical methods for analyzing pressure suppression pools in BWRs are developed at VTT. The numerical modelling work has three objectives.
• Improving understanding of the thermal hydraulic phenomena in the drywell and wetwell compartments of the containment of BWRs.
• Developing methods for modeling pressure loads and FSI in the pressure suppression pool. • Supporting the POOLEX and PPOOLEX experiments carried out at LUT.
3
EXPERIMENTAL WORK
Test facilities simulating containment of a BWR have been built and operated at LUT, first an open pool facility POOLEX and now a closed facility, PPOOLEX is in use. The main objective of the experiments has been to validate the computer codes used in the thermal hydraulic analysis of the safety systems of a nuclear power plant. The second objective has been to produce validation data for structural analysis, especially for the combined use of CFD and structural analysis codes. This has been possible by adding extra instrumentation to measure structural loads produced by rapid condensation of steam in the pressure suppression pool.
3.1 POOLEX
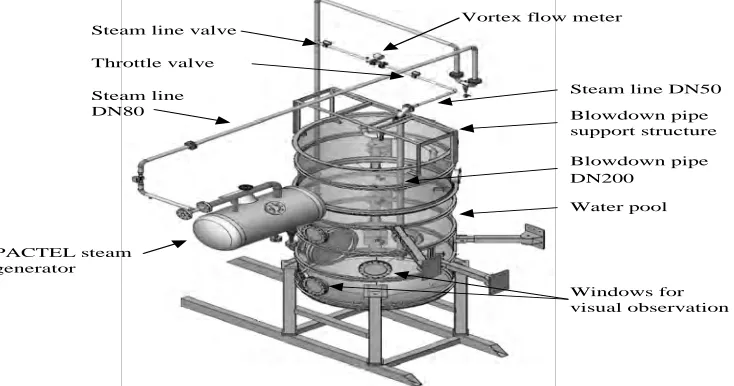
POOLEX facility (Fig. 1) was used to study dynamic and structural loads caused by the steam blown from the upper drywell of the containment to the condensation pool through the blowdown pipes. The test pool was a stainless steel tank with a wall thickness of 4 mm and a bottom thickness of 5 mm at atmospheric pressure containing 15 m3 of water. The nearby PACTEL test facility was used as a steam source. The test facility was equipped with high frequency measurement instrumentation for capturing different phenomena. A digital high-speed video camera was used for visual observation of the pool interior.
Steam line DN80
Steam line DN50
PACTEL steam generator
Water pool Blowdown pipe DN200
Vortex flow meter
Blowdown pipe support structure
Windows for visual observation Throttle valve
Steam line valve
Figure 1. Condensation pool test facility POOLEX
Figure 2. Strain gauges attached onto the wall of the POOLEX facility
3.2 PPOOLEX
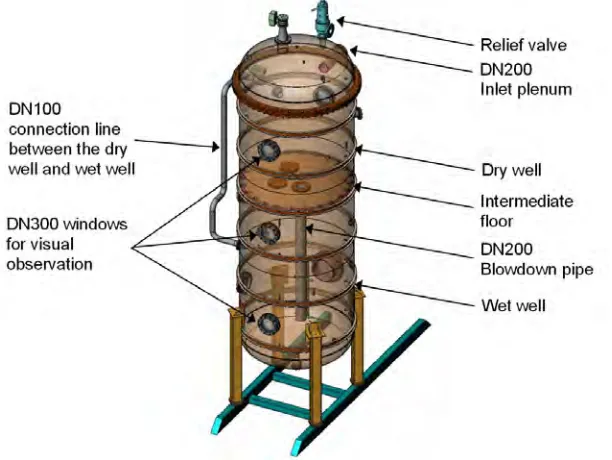
The open pool POOLEX facility was replaced with a closed vessel test facility PPOOLEX (Fig. 3) withstanding prototypic pressure of a BWR containment. The PPOOLEX facility consists of a wet well compartment (condensation pool), dry well compartment, inlet plenum and air/steam line piping. An intermediate floor separates the compartments from each other but a route for gas/steam flow from the dry well to the wet well is created by a vertical blowdown pipe attached underneath the floor.
The applied instrumentation of the PPOOLEX facility depends on the experiment in question. Normally, the test facility is equipped with thermocouples for measuring air/steam and pool water temperatures and with pressure transducers for observing pressure behavior in the dry well compartment, inside the blowdown pipe, at the condensation pool bottom and in the gas phase of the wet well compartment. Steam and air flow rates are measured with vortex flow meters in the steam and air lines. Additional instrumentation includes, for example, strain gauges on the pool bottom outer wall (Fig. 4) and vertical displacement sensor connected with the diaphragm springs in the supporting structures.
Figure 4. Strain gauge locations in PPOOLEX
3.3 Experiments on steam line rupture
Test series SLR-05 dealt with steam line rupture. In the first seconds of a steam line rupture accident nitrogen gas, that fills the upper drywell, flows through the blowdown pipes to the wet well. Later the fraction of steam increases in the upper drywell as well as in the blowdown pipe flow. In the PPOOLEX test, air was used to simulate nitrogen. Test SLR-05-02 was chosen to be used in fluid-structure interaction calculation, presented in detail in another article of this publication (Timperi 2009).
Before each SLR experiment the condensation pool (wet well) of the facility was filled with water to the level of 2.14 m i.e. the blowdown pipe outlet was submerged by 1.05 m. This air/water distribution corresponds to the scaled gas and liquid volumes in the containment of the reference plant. Pool water bulk temperature was about 22 °C. Flow rate was controlled also with the initial pressure level of the air accumulators.
After the correct initial pressure level in the air accumulators had been achieved the remote-controlled shut-off valve in the air line was opened. As a result, the inlet plenum was filled with air that immediately pushed its way to the dry well compartment and mixed there with the initial air content. Pressure build-up in the dry well then pushed water in the blowdown pipe downwards and after a while the pipe cleared and air flow into the wet well compartment started.
In test SLR-05-02, the initial pressure of the air accumulators was increased from the other tests of the SLR series to the value of 1.2 MPa. As a result, the air mass flow rate was higher in the beginning of the blow than in the other tests, Fig. 5.
0 100 200 300 400 500 600 700 800 900
0 10 20 30 40 50 60
0 20 40 60 80 100 120 140 160 180 A ir f lo w [ g /s ] A ir f lo w [ l/ s ] Time [s] SLR-05-02
F9001 mass flow
F9001 volumetric flow
Measured changes of strains on the vessel surface and the vessel pressures in dry- and wetwell in the test SLR-05-02 are presented in Fig. 6. The stepwise increase of the vessel pressure in the wetwell is due to formation and detachment of gas bubbles at the exit of the blowdown pipe. The pressure increase is clearly visible in the strain curves. Furthermore, the strain curves show the pressure oscillations caused by the collapse of the water when the large gas bubble reach the pool surface. These water mass movements are most visible in the vertical displacement curve of the vessel, shown in Fig. 7.
-120 -100 -80 -60 -40 -20 0 20 40 60 80 100 120
0 10 20 30 40 50 60
0.9 1 1.1 1.2 1.3 1.4 1.5 1.6 1.7 1.8 1.9 2 2.1 S tr a in [ ! S ] P re s s u re [ b a r] Time [s] SLR-05-02 S1 Axial S2 Circum. S3 Axial S4 Circum. P4 Wet well
P1101 Dry well
Figure 6. Measured pressures and strains in PPOOLEX test SLR-05-02
-0.7 -0.6 -0.5 -0.4 -0.3 -0.2 -0.1 0 0.1 0.2 0.3 0.4
0 10 20 30 40 50 60
V e rt ic a l m o v e m e n t [m m ] Time [s] SLR-05-02 Z-axis
4
NUMERICAL SIMULATIONS
4.1 CFD modelling
In the CFD calculations, the mass flow rate, temperature and the mass fractions of vapor and air of the gas flowing into the drywell are used as the boundary condition. Discharges where only air is blown into the drywell have been modeled by using the Volume Of Fluid (VOF) models of the commercial Fluent 6.3 and Star-CD 4.08 CFD codes. The VOF model is based on tracing the interface between gas and water and it is suitable for describing large bubbles in the water pool. Discharges where vapor is blown into the drywell have been modeled by using the Euler-Euler multiphase model of Fluent, which can describe well behavior of small bubbles. Wall-condensation models and a simple version of direct contact condensation models have been implemented in Fluent by using user-defined functions.
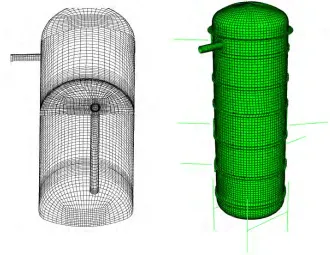
In the following, Fluent simulation results are presented for the PPOOLEX experiment CHAR-09-04, which is similar to the experiment SLR-05-02. This simulation was done before the test series SLR-05 was performed. The strain gauges were added to the PPOOLEX facility after CHAR-09 test series, that is why SLR 05 series was used for FSI simulations. Air was treated as ideal gas and water was assumed incompressible. Turbulence was modelled with the standard k- model. Time step in the simulation was 0.5 ms. The numerical mesh contained about 135 000 hexahedral cells and is shown in Fig. 8.
In Fig. 9, the calculated mass flow rate of air through the blowdown pipe to the wetwell compartment is illustrated. The blowdown pipe is cleared from water at time t = 4.5 s, and the mass flow rate reaches its first maximum value of 0.73 kg/s at time t = 4.91 s. This first maximum occurs during formation of the first air bubble at the exit of the blowdown pipe. Then, the first bubble is detached from the pipe exit and starts rising towards the water surface. The blowdown pipe is closed by the water flowing into the pipe and the mass flow rate of air in the blowdown pipe decreases rapidly towards zero. After this, new bubbles are formed in a cyclic manner.
In Fig. 10, detachment of the first bubble is shown at the outlet of the blowdown pipe. The bubble is detached at the pipe outlet at time t = 5.02 s. The velocity of the bubble surface is upwards near the pipe and downwards further away from the pipe. This phenomenon determines the characteristic shape of the bubble. The vertical velocity of the bottom surface of the bubble is larger than the vertical velocity of its top surface. This can lead to fragmentation of the bubble if the bottom surface reaches the top surface of the bubble. In this case, however, the bubble reaches the water surface before fragmentation.
Figure 9. Measured mass flow rate (kg/s) into the drywell (blue line) and calculated mass flow rate through the blowdown pipe (red line) versus time (s)
Figure 10. Surface of the first bubble at time t = 5.02 s coloured with vertical velocity (m/s) obtained in CFD simulation
In Fig. 11, analysis of the mass flow rate through the blowdown pipe is shown for the simulation data of Fig. 9. The time interval between the bubbles is plotted as a function of the mass flow rate of air into the drywell. It is evident that the time period between the bubbles increases approximately linearly with the mass flow rate into the drywell.
In Fig. 12, the calculated temperatures are compared to measured values. The calculated temperatures differ from the measured values especially in the wetwell top and in the drywell top. In the end of the simulation, the calculated temperatures are about eight degrees higher than the measured temperatures. Near the wetwell water surface and in the wetwell middle, the calculated values are closer to the measured ones. Stepwise rise pattern caused by bubble dynamics is clearly visible in the calculated temperature in the wetwell top and wetwell middle. In the measured values, it is much less apparent.
Figure 11. Time period between bubble formation as a function of mass flow rate into the drywell in CFD simulation
Figure 12. Comparison of calculated temperatures to the measured values
4.2 Fluid-structure interaction
calculated by Abaqus, and the wall displacement is transferred back to CFD calculation. Then, CFD calculation of the next time step is performed with the modified geometry.
FSI calculations of the PPOOLEX experiments have been numerically unstable with explicit two-way coupling. A linear perturbation method has been developed for preventing the instability; the method and calculations of the experiments are presented in detail in another article of this publication (Timperi, 2009).
5
CONCLUSIONS
Dynamic and structural loads caused by the gas and steam blown to the condensation pool through the blowdown pipes have been studied in POOLEX and PPOOLEX facilities at LUT. Beyond the original task of the POOLEX and PPOOLEX tests, additional instrumentation has been added to the facilities to obtain data for developing structural and fluid-structure interaction analysis methods. Data has been successfully applied by VTT.
Numerical work on modelling loads and FSI in condensation pool simulations was also described. Blowdown of air can be modelled fairly accurately with the VOF models of the present commercial CFD codes. Direct contact condensation of steam remains challenge for the CFD simulations. FSI has been simulated by coupling commercial CFD and structural analysis codes by using the MpCCI middleware. A linear perturbation method has been developed and validated for performing numerically stable FSI simulations of the PPOOLEX experiments (Timperi, 2009).
REFERENCES
Anon., 2008. MpCCI 3.0.6–21 Documentation, VI Codes Manual, Fraunhofer Institute for Scientific Computing.
Kauppinen, P., Sarkimo, M., Timperi, A. and Kinnunen P. 2006. Integrity and life time of reactor circuits, in “SAFIR The Finnish Research Programme on Nuclear Power Plant Safety 2003-2006, Final Report”, eds. Räty, H. and Puska, E.K. VTT Research Notes 2363, Espoo, p. 81-87.
Laine, J. and Puustinen, M., 2008. Steam line rupture experiments with the PPOOLEX test facility. Research report CONDEX 2/2007, Nuclear Safety Research Unit, Lappeenranta University of Technology, 23 p. + app. 7 p.
Räty, H. and Puska, E.K. (editors), 2006. SAFIR The Finnish Research Programme on Nuclear Power Plant Safety 2003-2006, Final Report. VTT Research Notes 2363, Espoo.