2
ISOLATED CHARACTER
RECOGNITION BASED ON
SUB-CHARACTER PRIMITIVE FEATURES
Muhammad Faisal Zafar
Dzulkifli Mohamad
1 INTRODUCTION
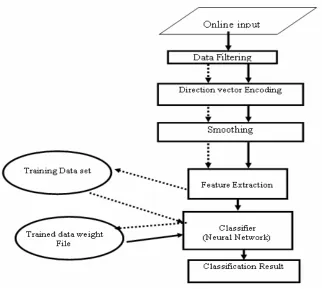
In this chapter character recognition is tried with another approach based on the sub-character primitive features. Novel features have been proposed and experimented. In this approach, on-line data is converted into series of x, y coordinates first. Some preprocessing is applied to the data and then filtered data is encoded into direction vector. A proposed smoothing algorithm smoothes the encoded sequence of direction vectors before extracting the features. These features are then fed to the input of BPN and CPN for training and recognition purposes. An overview of the whole system is presented in Figure 1. The flow of data during training is shown by the dashed line arrows, while the data flow during recognition is shown by solid line arrows. In the following sections, the techniques and algorithms to be involved for each processing block are briefly introduced.
Algorithms and Practice, Vol. 2
Figure 1 Block diagram of the system
2 DATA COLLECTION
second. This generates a sequence of (x; y) coordinates which define the trace of the pen over time. The stylus typically has a switch to detect pen-down (when the pen is touching the tablet) and pen-up (the pen is not touching the tablet) status. Some devices make use of a pressure sensor on the tip of the pen and collect pressure information in addition to the location information. Other devices that can be used to collect data include touch screens, such as found on many PDAs, and the CrossPad. The CrossPad is a device that receives an RF signal from a special pen. A receiving grid inside the pad allows the CrossPad to detect the location of the pen. The advantage of such a device is that the writing surface is not part of the sensor, and is actually the paper (e.g., a legal pad) making the writing experience more natural (Scott, 2000).
3 DATA FILTERING
Algorithms and Practice, Vol. 2
as possible, at the same time maintaining the appearance of the original data.
This section presents three filters: distance, angular variation and cross product based. The cross product filter is considered to be most suitable for the recognition algorithms. The two other filters are used in an auxiliary role.
3.1 Distance Filter
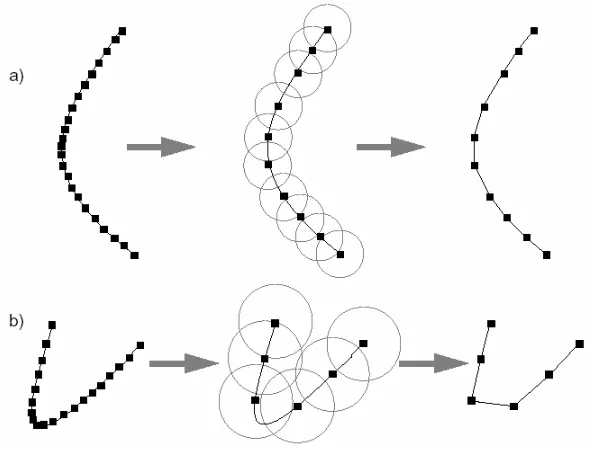
Figure 2 The distance filter: a) regular case; b) introduced distortions. From left to right: original data points; filtering process with distance thresholds marked; results
The distance filter used in this research removes identical consecutive data points.
3.2 Angular Filter
Algorithms and Practice, Vol. 2
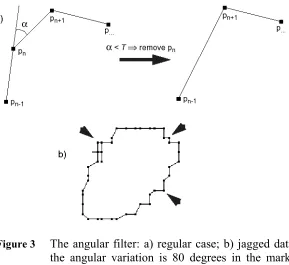
Figure 3a. Only three consecutive points are used for the calculations. The filter produces unequally spaced points. Points in areas of high angular variation are retained. However, the filter will not be effective on very jagged data (see Figure 3b). In such a case the angular variation can be very high, exceeding any reasonable value for the angular variation threshold. A pre-filter smoothing would be required to overcome this problem.
3.3 Cross Product Filter
Ideally, a filter for an angular variation based recognizer should eliminate points on long straight lines and preserve the points in the corners. To that purpose a cross product filter (Powalka, 1995) is best suited. This filter provides the following benefits:
• very fast to compute;
• pre-filter smoothing unnecessary; • can select the size of candidate features.
The cross product filter approximates curved strokes by line segments. It selects three points from the input stroke (Figure 4a). One point denotes which input point last went to the output (point a), one tells where the algorithm is (point b) and one tells where the algorithm is going (point c). Point b is the candidate for output, and it is most likely to be accepted when it is at a corner.
Algorithms and Practice, Vol. 2
Having point b at a corner maximizes the area of triangle
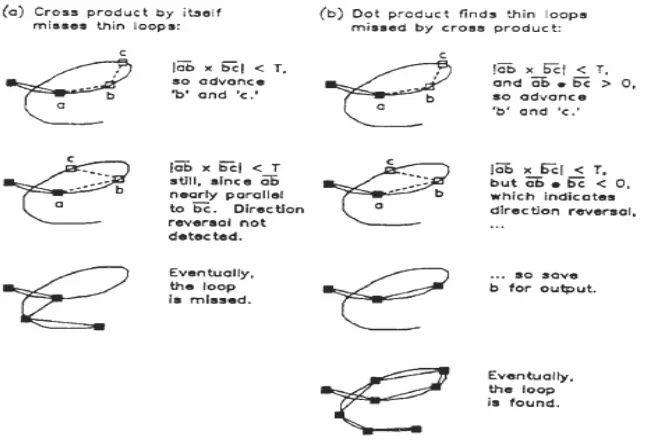
abc, which is one half the cross product of line segments ab and bc. If the cross product of vectors ab and bc is below some threshold (T), then points b and c are advanced, with b moving slower than c (Figure 4b). If the new cross product is greater than the threshold, point b is saved (Figure 4c), and new points a, b and c are established (Figure 4d). This is repeated until point c reaches the end of the stroke. The threshold T is decided empirically. The cross product, by itself, cannot detect the change of direction because it tests the sine of the direction change. In order to prevent missing tight loops, a dot product test is additionally applied (Powalka, 1995). It checks for direction reversal. The threshold is set to negative to detect only substantial direction reversal, not small jitters. Figure 5 illustrates the details of this process.
The filter can miss some detail at the end of the stroke, when the points b and c (Figure 5) cannot be advanced any further. This is actually used to an advantage: the processing starts at the end of the stroke and moves towards its beginning. In this way the inaccuracies occurring at the beginning of strokes, when the pen touches the writing surface for the first time, are removed. The surface of currently available digitizers does not match that of a sheet of paper. It often feels like writing on glass. Hence it is possible for a human hand to slip in the first contact with the writing surface. The cross product filter requires a calibration, so that it removes the right amount of detail. Figure 6 makes clear the difference between angular filtered data and cross product filtered data.
Algorithms and Practice, Vol. 2
4 VECTOR DIRECTION ENCODING
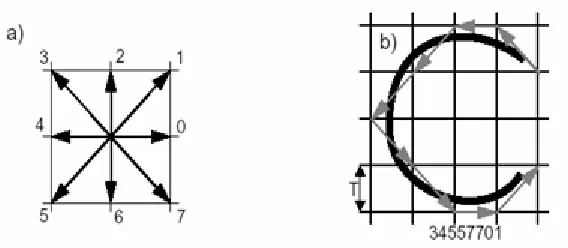
Vector direction encoding was introduced by Herbert Freeman (1974). It is a means of describing line drawings in an approximate way using a number of vectors of quantised directions. Direction of each line segment is approximated to the nearest direction available within the vector encoding. When a line changes direction, another approximation is used. The result is a chain of vectors capable of representing any arbitrary line drawing. Handwriting can be perceived as a line drawing. This is particularly the case for dynamic data, which can be represented by polylines of various complexity. Vector direction encoding well represents the angular variation of the pen path and is used in the segment and recognize approaches (Powalka, 1995).
The vector direction encoding described in (Freeman, 1974) uses vectors of uniform length. If a line segment is longer than the length of the unit vector, it is represented by a sequence of vectors of identical direction (e.g. Figure 7b). As the encoding is defined in a rectangular grid, eight directions are chosen: horizontal, vertical and diagonal (Figure 7a). The quality of representation of the original data by the vector direction encoding depends on the size of the grid relative to the size of the line drawing. The original chain coding scheme expresses the size of line drawings through the repetition of consecutive vectors of the same direction and size. While extremely simple, it produces long coding sequences as the size of line drawings increases. Such encoding is also size dependent. Drawings differing only in size would be encoded by different vector sequences.
4.1 Number and Directions of Coding Vectors
Algorithms and Practice, Vol. 2
Figure 8 Different varieties of vector encoding: a, b) four; c) six; d) eight (standard); e) twelve; f) sixteen directions
For eight directions encoding the following measures have been taken: Horizontal direction along x-axis (at angle 0) is considered as 1. Directions at angles 45, 90, 135,180, 225, 270, 315 are coded as 2, 3, 4, 5, 6, 7, and 8 respectively. When a character is drawn, the value of angle ‘θ ‘ is calculated by the relation:
x y 1
tan−
=
θ ……….. (1)
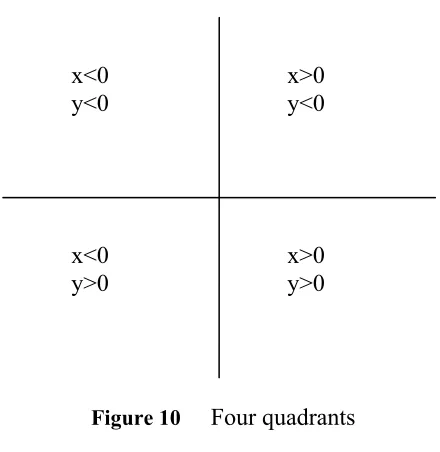
As there are 4 quadrants, for computer screen the distributions of x and y coordinates are shown in Figure 10 below.
x>0 y<0 x<0
y<0
x<0 y>0
x>0 y>0
Algorithms and Practice, Vol. 2
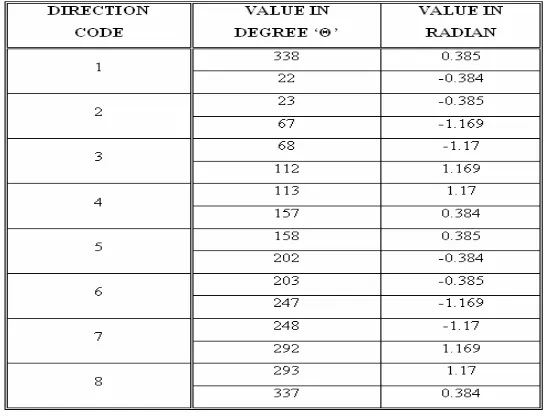
Therefore, the values of θ in 1st and 3rd quadrants are –ve. To code the angle space between two angle values, a threshold is fixed. The value of θ below this threshold is coded to lower nearest value and above it to upper nearest value. For instance, the threshold between 0o (0 rad.) and 45o (0.785 rad.) is taken as 22o (0.384 rad.). The θ value between 0o (0 rad.) and 22o (0.384 rad.) is coded as ‘1’ and between 22.1o and 45o is coded as ‘2’ and so on.
In terms of radian it will look like as:
Code = 1 when -0.01 < θ < -0.385 Code = 1 when -0.385 < θ < -0.786 and so on.
Table 1 Direction code with corresponding values of angles in degree ’θ’ and in radian
The length of each vector is measured using Euclidean distance:
(
) (
)
21 2 2 1
2 x y y
x
d = − + − ……… (2)
Also slope of a line with points (x1, y1) and (x2, y2) is given by
1 2
1 2
tan
x x
y y
− − =
θ ……… (3)
or
(
2 1)
tanθ 12 y x x
Algorithms and Practice, Vol. 2
Putting this value of y2−y1 in (6.2):
(
)
(
(
)
)
2 12 2 1
2 x x x tanθ
x
d = − + −
or
(
)
(
)
21
2 − 1+ tanθ
= x x
d or
(
)
2 12
tan 1+ θ =
−x d
x
or
(
)
2 12
tan 1+ θ +
=x d
x ……… .. (4)
Similarly
(
)
2 1 2 tan 1 1 θ + += y d
y ………. (5)
As the values of x1, y1, d, and θ are calculated from the
previous points(x1, y1) and (x2, y2), the new value of x2and y2 is
measure by (4) and (5). In this way, the exact length of the segment remains the same i.e. Euclidean distance d after being coded.
5 SMOOTHING
may exist that are not useful for pattern class discrimination. Strokes captured by a digitizing tablet tend to contain a small amount of noise, most likely introduced by the digitizing device, causing the sampled curves to be somewhat jagged. In order to reduce this noise, some form of smoothing is often applied using a spline filter, or a Yulewalk filter for low-pass filtering of the data (Connell, 2000) and Gassian filter (Jong, 2001) etc. But these filters sometimes involve complex mathematics and are applied on the initial data which is in the form of x, y coordinates. In this research a smoothing algorithm has been proposed which is quite simple in nature and applied on the direction encoded data of the input character. It involves simple mathematics. For a sequence C = < p1, p2,…,pi,….pn> of direction code of a character, the proposed algorithm smoothes the coded data in the following steps.
1. Search first for the member of sequence which is different from its neigbours by a value of absolute 1 (in case of consecutive 1 and 8 in either order, this difference will be considered as absolute 7), when both neighbours are same, then change it equal to value of its neigbours e.g. 323323 to 333333. In symbolic form:
if
1
,....
3
,
2
,
1
!
1 1 1 1 1−
=
=
⇒
=
−
Λ
=
Λ
=
+ + + − +n
i
p
p
p
p
p
p
p
p
i i i i i i i iSee effects in Figure 11 (a), (b), and (d).
Algorithms and Practice, Vol. 2 if
4
,....
3
,
1
2 1 1 3 2 2 1 1−
=
=
=
⇒
=
−
Λ
=
=
=
Λ
=
+ + + + + − − +n
i
p
p
p
p
p
p
p
p
p
p
p
i i i i i i i i i i iSee effects in Figure 11(e).
3. Search for the member of sequence which is different from its left side pair of neigbours by a value of absolute 11, and also different from right side pair, when members in that left neighbouring pair are same, but different in right neighbouring pair then change it equal to value of its left neigbours e.g. 5541723 to 5551723. In symbolic form: if
4
,....
3
,
1
!
!
1 1 3 2 2 1 1−
=
=
⇒
=
−
Λ
=
Λ
=
Λ
=
− − + + − − +n
i
p
p
p
p
p
p
p
p
p
p
i i i i i i i i i iSee effects in Figure 11 (a) and (f).
4. Search for the member of sequence which is different from its right side pair of neigbours by a value of absolute 11, and also different from left side pair, when members in that right neighbouring pair are same, but different in left neighbouring pair then change it equal to value of its right neigbours e.g. 5551233 to 5551333
if
3
,....
3
,
1
!
!
1 1 2 1 2 1 1−
=
=
⇒
=
−
Λ
=
Λ
=
Λ
=
+ + + + − − −n
i
p
p
p
p
p
p
p
p
p
p
i i i i i i i i i iSee effects in Figure 11 (a), (b), (c), (d) and (f).
will be considered as absolute 6), and also different from left side pair, when members in that left and right neighbouring pairs are same inside the pair but different among the pairs, then change it equal to value of its leftt neigbours e.g. 2224777 to 2222777. In symbolic form: if
4
,....
3
,
2
!
!
1 1 1 1 2 1 2 1 1−
=
=
⇒
=
−
Λ
=
Λ
=
Λ
=
Λ
=
− − + − + + − − +n
i
p
p
p
p
p
p
p
p
p
p
p
p
i i i i i i i i i i i iSee effects in Figure 11 (c).
6. Search for two consecutive sequence members which are equal to each other but different from their respective neigbours, when neighbouring pair on both sides are different by a value of absolute 1 (in case of 1 and 8 in either side, this difference will be considered as absolute 7), then change one of two members equal to value of its neigbours e.g. 77733888 to 77773888. In symbolic form: if
4
,....
3
,
1
1 2 2 3 2 2 1 1−
=
=
⇒
=
−
Λ
=
Λ
=
Λ
=
− + − + + − − +n
i
p
p
p
p
p
p
p
p
p
p
i i i i i i i i i iAlgorithms and Practice, Vol. 2
Figure 11 Smoothing from left to right by Proposed Algorithm: characters representation graphically and numerically in 8-directional code
6 FEATURE EXTRACTION
6.1 Sub-Character Primitive Features
small salient sub-region of the character. The simplest kind is the directional code computed from equally spaced regions. That is, the character shape is divided into equally spaced intervals and the line orientation code corresponding to each interval is computed. Usually 8 or 16 directional code is used. More sophisticated methods compute a set of salient points according to their feature extraction scheme, and use the variable length intervals between the salient points, instead of the equal-spaced ones. The summary information computed from each interval may still be a directional code or a more elaborate feature. Another kind of feature is drawn from the topological characteristics of the character shape like corners, cusps, loops, and openings. One advantage of the sub-character primitives is that they are more concise due to their encoded nature. Another is that they offer a higher level view because they represent a region not a point. One problem is that the primitive level feature extraction, depending on the granularity they work on, should be extremely robust to be effective since one mistake may make a big hole in the overall picture because of their regional representation nature. This is not easy to achieve especially in the setting of writer independent mode of recognition, in which a large variability in writing style exists and a system needs to deal with potentially missing or previously unseen features not covered in the training data.
6.2 Feature Proposition
Algorithms and Practice, Vol. 2
i. Total length of direction vectors sequence (T).
ii. Total no. of each direction vector present in the sequence (Di, i =1,2,…,N).
Where N = No. of encoding directions (in this case it is 8)
Below are given the different proposed features experimented in this research work. They are produced by considering different combinations of local as well as global traits of every character
1. Ratio ri of total no. of each direction vector Di with sequence
length T
i.e i N
T D
r i
i = , =1,2,... ……… (6)
This ratio is size invariant and helpful in getting the unique participation of each direction code for a particular character. It gives local insight of the character. In total there are eight ratios as 8-direction encoding has been used in this work.
2. Norm n (termed Minkoski metric) of all ri’ given by
∑
=
= N
i ri
n
1 2 2
……… (7)
This is a global feature of every character and gives a unique value for a particular character. In connection with (6.6), it is also size invariant.
3. Total no. of direction vectors h1 pointing towards left side.
4. Total no. of direction vectors h2 pointing towards right side
5. Total no. of direction vectors v1 pointing towards up side
6. Total no. of direction vectors v2 pointing towards down side
7. Total no. of direction vectors diag1 constituting left diagonals
8. Total no. of direction vectors diag2 constituting right diagonals
12. Total no. of local minima minim present in the sequence 13. Total no. of clock wise cw movements present in the sequence 14. Total no. of anti-clock wise acw movements present in the sequence
15. Total no. of central angles ang present in the sequence
Features 3-15 have local as well as global nature and provide the information that how many times the event, stated in the feature definition, occurs. All these values are distinctive for a particular character.
Table 2 shows the size and sequence of encoded direction vectors of character “A” written by three different subjects. Table 2 shows the corresponding features values of “A” extracted by the proposed method. The uniqueness of the features is obvious from the values shown in Table 2.
Algorithms and Practice, Vol. 2
Table 3 Feature values for three pattern of ‘A’ given in Table 1
6.3 Feature Extraction Algorithm
Here a comprehensive algorithm for extraction of features from direction vector encoded sequence S ( s0, s1,s2….,sT-1)of a character has been given. It implements everything step by step as proposed above.
The values of encoded sequence S and its length T are assumed known. N = 8 is the total number of directions used in encoding.
1. Measurement of Ratio ri of total no. of each direction vector Di
with sequence length T
; ri
T Di
= from (6)
2. Calculation for norm n of ri‘s
∑
=
= N
i
r
in
1 2
2 from (7)
Scan code sequence S from start to end. Each one of the h1,
h2, v1, v2, diag1, diag2 will qualify for a count and will be
incremented by 1, if at least three consecutive direction vectors are same.
4. Calculation for maxim
Let a, b, and c are representing patches of three consecutive values in the sequence S such that a = 666 , b = 777 , c =888
There will be a maxim
if b comes immediately after awith only a one direction vector between them.
or
if c comes immediately after awith only a one direction vector between them.
or
if c comes immediately after bwith only a one direction vector between them.
(direction vector between all above cases has been observed 2 or 3)
5. Calculation for minim
Let x, and y are representing patches of three consecutive values in the sequence S such that x = 222 , y = 333
There will be a minim
if x comes immediately after b
or
if y comes immediately after b
or
if x comes immediately after c
or
Algorithms and Practice, Vol. 2
6. Calculation for RTarm
There will be a RTarm
if b comes immediately after x
or
if c comes immediately after x
7. Calculation for LTarm
There will be a LTarm
if b comes immediately after y
or
if c comes immediately after y
8. Calculation for cw, acw and ang.
If code sequence has two consecutive pairs (e.g. 5544) of direction vectors in descending order then there will be clockwise movement and cw will qualify to increment by 1.
If code sequence has two consecutive pairs (e.g. 4455) of direction vectors in ascending order then there will be anticlockwise movement and acw will qualify to increment by 1.
7 EXPERIMENTS
7.1 Data Set And Model Parameters
The data used in this work was collected using tablet SummaSketch III. It has an electric pen with sensing writing board. An interface was developed to get the data from tablet.
English alphabets were considered in case study. As direction encoding has been used, thus the stroke order matters in this case since different orderings of the strokes will result in different representations even though the written character is the same (see Figure 12).
Figure 12 Character "A", two different orders that it could have been written indicated in boxed numbers
Algorithms and Practice, Vol. 2
characters is about 2000 characters used for training purposes, collected from 30 subjects. About 1000 more handwriting samples were used for testing purpose. Experiments were examined by extracting a feature vector of 22 elements from each character. Every developed model was tested on characters drawn by individuals who did not participate in the sample collection for data set. Each subject was asked to write on tablet board (writing area). No restriction was imposed on the content or style of writing. The writers consisted of university students (from different countries), professors, and employees in private companies.
7.2 Learning / Training
For classification purpose, two neural networks techniques: back propagation neural networks (BPN) and counter propagation neural networks have been used. Experiments were performed using data sets of 11, 22, 33, 44, 55 and 66 samples/character separately to observe the behaviour of BPN and CPN.
Table 5 below shows the learning trends of BPN while training. Values of sum of squared error (SSE) have been given after every 5000 iterations.
Algorithms and Practice, Vol. 2
Table 5 Learning Trends of BPN during Training Phase
Figure 13 Convergence Trends of different BPN models
Similarly in the CPN, twenty-nine output layer processing elements (PEs) corresponded to twenty-six English (A, M and N having double entries) alphabets to be recognized. For example, a ‘high’ output value on the second PE in the output layer and ‘low’ on the others would mean that the network classifies the input as a ‘B’.
7.3 Recognition Performance
Algorithms and Practice, Vol. 2
to its ability to translate drawn characters irrespective of writing styles.
BPN models were tested with high thresholds of 0.9 and
0.5, using the PE with the highest value above the threshold for input classification. Another criterion used in translating the BPN model’s outputs was to eliminate the concept of threshold and simply use the highest value. Note that the first criteria will always have the possibility of a recognition failure: a network decision of not attributing any character to the input vector. The last criteria will eliminate this somewhat desirable feature in the decision making process. Table 6 below presents the statistics; CRs, FRs, and RFs are abbreviation for Correct Recognitions, False Recognitions, and Recognition Failures respectively.
Similar thresholds of 0.0, 0.5 and 0.9 were considered for CPN, using the PE with the highest value above the thresholds for input classification. Same series of tests with CPN models (for 11 samples/character, 22 samples/character, 33 samples/character, 44 samples/character, 55 samples/character and 66 samples/character) were performed to exactly compare the performance of CPN with BPN. Table 7 presents the statistics.
Table 7 Performance of CPN models with three different criteria of classification
7.4 Performance Analysis
Algorithms and Practice, Vol. 2
long time of training, models were unable to fully learn the training sets. Number of hidden PEs from 30 to 35 were found suitable. Value of learning rate < 1 appeared appropriate for training. Generally, the recognition performance of BPN models improved with increase in samples/character. Figure 14 presents a graphical overview of BPN performances with three different decision criteria of Recognition. The recognition rate without any threshold (NONE) was highest (up to 87%) but at the cost of more false recognition. This recognition rate gradually decreases by applying tough thresholds (0.5 and 0.9) but this makes the system more reliable by tempting less false recognitions. However, overall the false recognitions were much less than recognition failure (RFs), after applying thresholds. More RFs are due to a large number of untrained samples. This number can be reduced by experimenting more suitable combinations of hidden PEs and learning rate. It will ultimately improve the recognition rate.
For developed CPN models, there was no need of training parameters nor it is an iterative method like BPN which took a long time for learning. A general trend of increase in performance with increase in samples/character has also been observed in this case. The difference in recognition rates with and without a threshold for input classification is understandable (Table 7). Though threshold reduces the correct recognitions but at the same time it prevents the system to go for more false recognitions. Application of threshold was the same as there was NONE threshold. False Recognition (FRs) is another important factor in any recognition system, lower the false recognition rate, more reliable the system. Instead of FRs, system goes for recognition failure (RFs) which is less dangerous than FRs. On the other hand, performance of the system increases without threshold but at the cost of more FRs. Figure 15 presents a graphical overview of CPN performances with three different decision criteria of Recognition.
Algorithms and Practice, Vol. 2
The performance comparison of CPN of BPN is presented graphically in Figure 16. The recognition of BPN is better than that of CPN. Also, if we look at the performances in terms of quality and models outputs in Table 8 and Table 9, BPN seems to be leading again as there are much less FRs in comparison to those with CPN. However, in terms of training time, CPN shows a very good promise.
Table 8 Classification results at BPN output for A, B and C
Algorithms and Practice, Vol. 2
In general, the performance of all developed models was observed up to the mark.
7.5 Similarity of Characters
After analyzing the result files that describe target and actual outputs, it has been found that some classes got very high recognition rates, whereas some got the very low recognition rate. The top 3 recognition rates for CPN and BPN are given in Table 10.
Table 10 Top 3 Classification Rates
CPN BPN
Top 1 H (99%) H (100%)
Top 2 N (99%) X (100%)
Top 3 Z (99%) Z (100%)
8 SUMMARY
Another elementary online handwriting recognition prototype for isolated upper case English characters has been developed using novel feature proposition. The system is also writer-independent based on neural network approach. The online drawn input character is captured into x, y coordinates. Filtering is performed to remove the noise. Then the character is converted to a direction code sequence. On this sequence again a smoothing algorithm is applied to convert useless code elements into effective usage. A 22-feature vector for written character produced can then be stored for training purposes or can be supplied to a developed model for making a decision regarding the class of the character. The preliminary results are quite encouraging. The experiments provided the author an opportunity to explore pattern recognition methodologies; the exercise provided a theoretical base for further investigations and impetus for development work in this discipline.
REFERENCES
ABUHAIBA S. I., AND AHMED P. (1993). A fuzzy graph theoretic approach to recognize the totally unconstrained handwritten numerals. Pattern Recognition, 26(9):1335-1350.
ALESSANDRO VINCIARELLI (2002). A survey on off-line Cursive Word Recognition. Pattern Recognition, 35 (2002) 1433–1446.
ALESSANDRO L. KOERICH, YANN LEYDIER, ROBERT SABOURIN AND CHING Y. SUEN (2002). A Hybrid Large Vocabulary Handwritten Word Recognition System using Neural
Algorithms and Practice, Vol. 2
ALEXANDRE LEMIEUX, CHRISTIAN GAGNE AND MARC PARIZEAU. (2002). Genetical Engineering of Handwriting Representations.
Proc of the International Workshop on Frontiers in
Handwriting Recognition (IWFHR), Niagara-On-
The-Lake, August 6-8.
ROBERT K. POWALKA, NASSER SHERKAT, ROBERT J. WHITROW, 1995. Zoning invariant holistic recognizer for hybrid recognition of handwriting. ICDAR 1995: 64-67
ROBERT K. POWALKA, NASSER SHERKAT, ROBERT J. WHITROW, 1995. Recognizer characterisation for combining handwriting recognition results at word level. ICDAR 1995: 68-71
SCOTT D. CONNELL, (2000).Online Handwriting Recognition Using classification: A combined approach of clustering and support.
YEFENG ZHENG ET AL. (2004). Machine Printed Text and Handwriting Identification in Noisy Document Images. IEEE
Transactions On PAMI, 26(3).
YOSHIDA K. AND SAKOE H. (1982). Online handwritten character recognition for a personal computer system. IEEE Trans.
Consumer Electronics, CE-28(3): 202-209, 1982.
ZAFAR M. F., DZULKIFLI MOHAMAD AND IKRAM UL HAQ, (2004 a). A Simple Approach For On-Line Isolated Handwritten Character Recognition Using Neural Networks. International Conference On AI Applications in Engineering And
Technology(ICAIET 2004),3-5 August, Kota Kinabalu, Sabah,
Malaysia.
ZAFAR M. F., DZULKIFLI MOHAMAD AND IKRAM UL HAQ, (2004 b). Real-time Dynamic Offline Text Recognition system. Proc. Of
2nd National Conference on Computer Graphics and
Multimedia,(Cogram04), Bangi, Kualampur Malaysia. Dec.
8-10.
ZAFAR M. F., DZULKIFLI MOHAMAD AND IKRAM UL HAQ, (2005 a). Counter Propagation Neural Networks for On-line Recognition of Isolated Handwritten Character. Proceedings of 9th
International Conference on Information Visualisation IV05 ,
AHMED, S.M.,ET.AL, (Nov.1995). Experiments in character recognition to develop tools for an optical character recognition system, IEEE Inc. 1st National Multi Topic Conf.
proc. NUST, Rawalpindi, Pakistan, 61-67.
ZAFAR M. F., DZULKIFLI MOHAMAD AND IKRAM UL HAQ, (2005 b). Neural Networks for On-Line Recognition of Isolated Handwritten Character. Proceedings of Malaysian Science
And Technology Congress (Mstc 2005) 18 – 20 April 2005,
Kuala Lumpur, Malaysia.
ZHANG G. P. (2000). Neural networks for classification: a survey.
IEEE Transactions on Systems, Man, and Cybernetics - Part C:
Applications and Reviews, 30(4):451-462.
ZHANG, FU M., YAN H., AND FABRI M. A. (1999). Handwritten digit recognition by adaptativesubspace self organizing map.
IEEE Trans. on Neural Networks, 10:939-945.