295 MANOVA ON PRINT ADVERTISING
Ng Siew Hui, Dr. Norazlina Ismail
Abstract
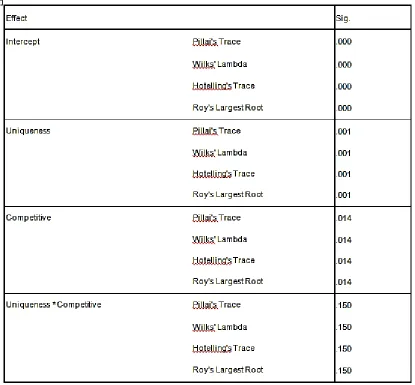
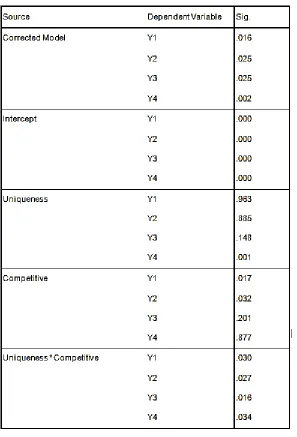
Print advertising is a common form of marketing communication used for the purpose of solicitation, marketing or promoting. With the presence of print ad elements, the advertisement is enhanced. The objective of the research is to determine the effect of different print ad copy elements on attitude towards product and intention to buy. Data were obtained from 100 subjects which are divided into 25 subjects per cell. Data were analyzed using simple 2x2 balanced design full factorial between subjects’ multivariate analysis of variance and some necessary univariate analysis. Both competitive claim and uniqueness claim shown significant main effect on the dependent variables. The univariate tests shown significance of uniqueness claim on the likelihood on buying the product, whereas competitive claim on the liking of the product. It is concluded that the inclusion of print ad elements can affect the attitude towards product and intention to buy.
Keywords: MANOVA, print ad, SPSS, competitive claim, uniqueness claim.
Introduction
Advertising is a form of marketing communication used to persuade audience or consumers to take or continue some action, usually with respect to a commercial offering, or political or ideological support. Any advertisement printed on paper, be it newspapers, magazines, flyers, booklets or other medias that could be considered as a portable printed medium is called print advertising.
In this research, we want to test the effects of different print ad copy elements on attitude toward product and intention to buy by using MANOVA. MANOVA, Multivariate Analysis of Variance is a type of multivariate analysis used to assess the statistical significance of differences that involves more than one independent variable in one time. The null hypothesis tested in MANOVA is the equality of vectors of means on multiple dependent variables across groups.
Literature Review
A study was carried out by Keith P. Gennuso, et al. (2014) on the smokers’ physical activity and weight
gain one year after a successful versus unsuccessful quit attempt to examine whether smokers’ physical activity is related to their weight changed following a quit attempt. Data were analysed by using t-tests and chi-square analyses. In a study conducted by FilizFatmaColakoglu, et al.(2014) examining the aggression levels and emphatic tendency levels of secondary school students who involve or do not involve in sports, both ANOVA and MANOVA is used to analyse the data.Aghajanihashtchintahmores (2011) investigated on the role of play in social skills and intelligence of children in three groups, kindergarden (3-5 years old), pre-school (6-7 years old), and school (8-12 years old) focusing on two factors, which is intelligence profile and social skill with data analysed by two-way MANOVA. William Flores, et al. (2013) explored on the effect of variations in banner ad, type of product, website context, language of advertising on Internet users’ attitudes. The main goal of the study by Yu-Chen Hsieh, et al.
296 focused on how the information types and the webpage structure influenced the viewers’ attention on banner advertising.
Methodology
Multivariate Analysis of variance (MANOVA) is a statistical test procedure for comparing multivariate (population) means of several groups. The one-way MANOVA is modelled as
(1) (2) ( )
(1) (2) ( )
(1) (2) ( )
(1) (2) (p)
ij ij ij p j j j p p ij ijij y y
y for p measures.
yij (k)
is the score for the subject ij on the dependent variable Yk; µ (k)
and αj (k)
are parameters for Yk (Finn, 1974).
We explored the multivariate effect and univariate effect for each MANOVA, where multivariate effect is how the independent variables have an impact on the combination of dependent variable and univariate effects is how the mean scores for each dependent variable differ across the independent variable groups. . It describes the effect of the independent variables upon the combined dependent variables.
A few assumptions have to be met to use MANOVA. All dependent variables must be distributed normally. Linear combinations of dependent variables must be distributed normally. All subsets of the variables must have a multivariate normal distribution (Statistics, L., 2013). In MANOVA, each one of dependent variables is required to have equal variances. Also, it is required in MANOVA that the covariance matrices are homogeneous. The variance shared between any two variables need to be equal across all levels of independent variable. Box’s M test is used to test the hypothesis that the covariance matrices of the dependent variables are significantly different across levels of the independent variable. The assumption of MANOVA is violated when the Box’s M test is significant (Zaiontz C., 2015). The subjects’ scores on the dependent measures should not be influenced by or related to scores of other subjects in the condition or level. If it is suspected that the observations are lack of independence, it can be tested with an interclass correlation coefficient.
The dependent variables in MANOVA should not be too strongly correlated. When there are moderate correlations between the dependent variables, MANOVA works well. If the dependent variables are too correlated, there is not enough variance left over after the first dependent variable is fit. On the other hand, if the dependent variables are not correlated, the multivariate test will lack of power. Hence, the acceptable limits are positive correlation should not exceed r=0.90, while negative correlation should not exceed r =-0.40(Andrew Mayers, 2013).
297 When the MANOVA null hypothesis is rejected, we look into the main effect and interaction effect by using univariate tests, ANOVA. Analysis of Variance (ANOVA) is used to analyse the
differences between group means and their associated procedures, such as variation among and between groups. In ANOVA, the null hypothesis is that all groups are random samples of the same population, implying that the treatments have the same effect on the samples. There are three assumptions to be satisfied for ANOVA test. The observations are obtained independently and randomly from the populations. The population at each factor level is (approximately) following normal distribution and these normal populations have a common variance, 𝜎2.
Findings and Discussion
299 Table 2: Univariate Test Result
Conclusion
300 References
Gennuso, K. P., Thraen-Borowski, K. M., Schlam, T. R., LaRowe, T. L., Fiore, M. C., Baker, T. B., & Colbert, L. H. (2014). Smokers' physical activity and weight gain one year after a successful versus unsuccessful quit attempt.Preventive medicine, 67, 189-192.
Colakoglu, F. F., &Solak, N. (2014).Examination of aggression levels and empathic tendency levels of secondary school students who involve or not involve in sports. Procedia-Social and Behavioral Sciences, 152, 415-420.
tahmores, A. H. (2011). Role of play in social skills and intelligence of children.Procedia-Social and Behavioral Sciences, 30, 2272-2279.
Flores, W., Chen, J. C. V., & Ross, W. H. (2014).The effect of variations in banner ad, type of product, website context, and language of advertising on Internet users’ attitudes. Computers in Human Behavior, 31, 37-47.
Hsieh, Y. C., & Chen, K. H. (2011). How different information types affect viewer’s attention on internet advertising. Computers in Human Behavior, 27(2), 935-945.
Finn, J. D. (1974). A general model for multivariate analysis.Holt, Rinehart & Winston.
Statistics, L. (2013).One-way ANOVA in SPSS. Retrieved December, 21, 2013.
Zaiontz C. (2015) Real Statistics Using Excel. www.real-statistics.com