ABSTRACT
STARLING, TINA T. Comparing Discourse in Face-to-Face and Synchronous Online Mathematics Teacher Education: Effects on Prospective Teachers’ Development of
Knowledge for Teaching Statistics with Technology. (Under the direction of Dr. Hollylynne S. Lee).
This comparative study examined discourse and opportunities for interaction in two mathematics education methods classes, one face-to-face and one synchronous, online. Due to the content taught in the course, this study also sought to determine prospective
mathematics teachers’ understanding of variability and the role of discourse in each learning environment in developing statistical knowledge for teaching with technology in prospective mathematics teachers.
data, helped ensure credibility of the qualitative methods described. Supporting data included a pre-/post-assessment, written assignments, and interviews of focus group members.
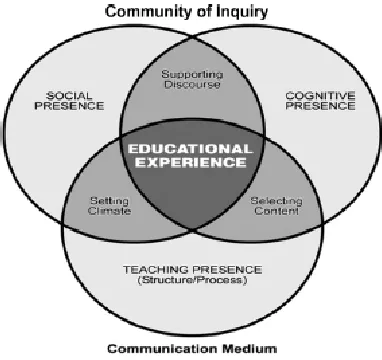
A community of inquiry framework, which presents the social, technological, and pedagogical presences that make up an educational experience, was used as the theoretical lens for this study (Garrison, Anderson, & Archer, 2000). Findings indicate that the ways in which prospective teachers and the instructor interacted with one another and discussed notions of variability looked very different between the face-to-face and online
environments. This was because in the synchronous, online environment, prospective teachers could interact with one another in a number of ways. They used non-traditional forms of communication such as the chat window and the interactive whiteboard to share ideas and to ask questions.
Despite these differences in how prospective teachers interacted with the instructor and with one another in each group, the substance of what they said about describing distributions, deviation, and the law of large numbers was strikingly similar across settings. Specifically, their usage of informal language was prevalent and comparable as they
Comparing Discourse in Face-to-Face and Synchronous Online Mathematics Teacher Education: Effects on Prospective Teachers’ Development of Knowledge
for Teaching Statistics with Technology
by Tina T. Starling
A dissertation submitted to the Graduate Faculty of North Carolina State University
in partial fulfillment of the requirements for the degree of
Doctor of Philosophy
Mathematics Education
Raleigh, North Carolina 2011
APPROVED BY:
_______________________________ ______________________________
Dr. Hollylynne Lee Dr. Karen Hollebrands
Committee Chair
DEDICATION
BIOGRAPHY
Tina Julian Tedder Starling was born in Statesville, NC on August 17, 1977. She is the daughter of Randy and Sherry Tedder. She graduated from North Iredell High School and attended NC State University as a recipient of the North Carolina Teaching Fellows
Scholarship. She graduated from NC State University in May, 1999 with a Bachelor of Science degree in mathematics and in December, 1999 with a Bachelor of Science degree in mathematics education. In January, 2000, she was hired at Athens Drive High School in Raleigh, NC. The following summer, Tina married college sweetheart Ray Starling. Mrs. Starling continued teaching mathematics, earning the First Year Teacher of the Year Award (2001) and Teacher of the Year (2006) awards at her high school. During this time, Starling continued teaching full time while taking graduate courses. She completed her Master of Science degree in mathematics education at NC State in December, 2005. Her thesis study, advised by Dr. Lee Stiff, examined the effects of students’ self-assessment on Algebra I achievement.
In August, 2006, she left public schools to teach in the Mathematics and Physics Department at Wake Technical Community College in Raleigh, NC. There, she taught a variety of courses including an online mathematical modeling course. During her time at Wake Tech, she was asked to help with the supervision of student teachers from NC State. Working as an adjunct supervisor allowed Tina to return to the public schools, which she missed, and opened her eyes to the joy in working with prospective mathematics teachers. In January, 2008, she began taking doctoral classes and decided to return to the doctoral
supervising student teachers. She also taught the Teaching Mathematics with Technology course and worked with the Preparing to Teach Mathematics with Technology (PTMT) research project under the direction of Dr. Hollylynne Lee and Dr. Karen Hollebrands.
ACKNOWLEDGMENTS
To God be the glory! The doctoral journey was not an easy one, I will admit. Without the constant and abundant love and grace from my heavenly Father, none of this would have been possible. His perfect healing in 2008 and the birth of our daughter in 2010 were life-changing events that occurred while I was pursuing this degree. His love and care were shown over and over again through the people He placed in my life.
To my husband, Ray, thank you for being such a sweet, thoughtful, Godly man. Your unwavering support, constant encouragement, and hugs in the kitchen have gotten me
through many tough days. You are a terrific Daddy, too, and I appreciate the times when you just sensed you needed to take Victoria on a “trip.” To my parents, Randy and Sherry Tedder, thank you for teaching me the value of education and for your remarkable faith in me. Your help after surgery and with Victoria was critical and I appreciate all you have done to help me along the way. To my mother-in-law, JoAnne Starling, thank you for your genuine interest in what I was doing and for the many days of extra help with Victoria. I love all of you.
To my sweet daughter, Victoria, thank you for keeping me grounded and reminding me daily how important it is not to worry about tomorrow, but to laugh and play today. Watching you grow is pure joy and I am so proud of you. You are a beautiful girl, inside and out, and I love you… much!
expectations were high and your sense of humor great, two things I appreciated very much. I respect you so much.
To members of my committee, thank you for your time and expertise. Dr. Karen Hollebrands, thank you for reading every word of my proposal and dissertation and providing such thoughtful feedback. You are so responsible and efficient; I really do not know how you get it all done. Dr. Lee Stiff, thank you for “keeping it real.” You have a way of keeping your head at the student-level that I truly admire. Dr. Roger Woodard, thank you for commitment to teaching and for pushing me to think about online education differently.
To my extended family and to all of my friends, your words of encouragement often came at just the right time. Please know that I appreciated your support and prayers along this journey.
TABLE OF CONTENTS
LIST OF TABLES……….xiii
LIST OF FIGURES………xvi
CHAPTER 1: INTRODUCTION ... 1
BACKGROUND OF THE STUDY ... 1
PURPOSE OF THE STUDY ... 2
CLARIFICATION OF TERMS ... 3
SIGNIFICANCE OF THE STUDY ... 4
CHAPTER SUMMARY AND ORGANIZATION OF THE STUDY ... 6
CHAPTER 2: LITERATURE REVIEW ... 8
INTRODUCTION ... 8
COMMUNITY OF INQUIRY FRAMEWORK ... 9
SOCIAL PRESENCE... 10
Discourse and Interaction... 11
Existing Frameworks For Analyzing Discourse and Interaction ... 15
COGNITIVE PRESENCE ... 18
Existing Frameworks For Analyzing TPSK ... 19
Statistical Knowledge... 22
Technological Statistical Knowledge ... 30
Technological Pedagogical Statistical Knowledge ... 32
TEACHING PRESENCE ... 34
Implications of Synchronous Learning for the Instructor... 37
CHAPTER SUMMARY ... 38
CHAPTER 3: METHODOLOGY ... 41
INTRODUCTION ... 41
RESEARCH QUESTIONS ... 41
FRAMEWORKS ... 42
PILOT STUDY ... 45
RESEARCH DESIGN ... 48
SITE SELECTION AND SAMPLE ... 49
Online Group ... 51
Face-to-Face Group ... 52
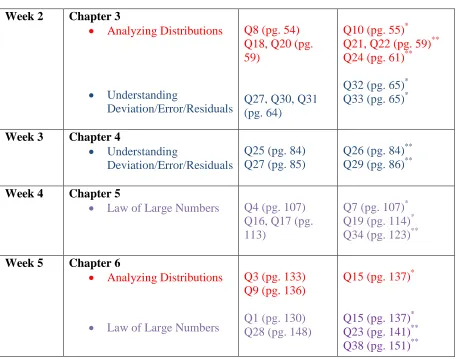
Curriculum ... 53
DATA COLLECTION ... 57
Audio and Video Recordings of Class Sessions ... 57
Assessments ... 58
Interviews ... 62
DATA ANALYSIS ... 64
Analyzing Understanding of Variability ... 71
RESEARCH VALIDITY AND RELIABILITY ... 76
SAFEGUARDS AGAINST RESEARCHER BIAS ... 78
ETHICAL ISSUES ... 79
CHAPTER SUMMARY ... 79
CHAPTER 4: THE CASE OF TEACHING AND LEARNING IN AN ONLINE ENVIRONMENT ... 81
INTRODUCTION ... 81
CONTEXT AND OVERVIEW ... 82
Chapter One ... 83
Chapter Two... 89
Chapter Three ... 94
Chapter Four ... 97
Chapter Five ... 104
Chapter Six... 109
DISCOURSE ... 114
Chapter One ... 115
Episode One – Small Group. ... 115
Episode One – Whole Group ... 117
Chapter Two... 119
Episode Two – Small Group ... 119
Episode Two – Whole Group ... 121
Chapter Three ... 124
Episode Three – Small Group ... 124
Episode Three – Whole Group ... 125
Chapter Four ... 128
Episode Four – Small Group... 128
Episode Four – Whole Group ... 130
Chapter Five ... 133
Episode Five – Whole Group ... 133
Chapter Six... 135
Episode Six – Whole Group ... 135
Episode 6 – Small Group ... 138
Trends in Class Design and Management ... 140
Trends in Form ... 142
Trends in Purpose ... 145
UNDERSTANDING OF VARIABILITY ... 147
Describing Distributions ... 153
Pre-/Post-Assessment. ... 153
Chapter 2 Homework ... 154
Performance Task ... 156
Interview Analysis ... 163
Summary of Understanding of Describing Distributions ... 166
Understanding Deviation ... 166
Pre/Post-Assessment ... 167
Performance Task ... 169
Discussion Analysis ... 171
Interview Analysis ... 176
Summary of Understanding of Deviation ... 178
Understanding the Law of Large Numbers ... 179
Pre/Post-Assessment ... 179
Performance Task ... 181
Discussion Analysis ... 182
Summary of Understanding the Law of Large Numbers ... 186
TRENDS IN UNDERSTANDING VARIABILITY ... 187
Statistical Knowledge (SK) ... 187
Technological Statistical Knowledge (TSK) ... 188
Technological Pedagogical Statistical Knowledge (TPSK) ... 189
SUMMARY ... 190
Revisiting the Social Presence of the Online Case ... 191
Revisiting the Cognitive Presence of the Online Case ... 193
Revisiting the Teaching Presence of the Online Case ... 195
CHAPTER 5: THE CASE OF TEACHING AND LEARNING IN A FACE-TO-FACE ENVIRONMENT ... 198
INTRODUCTION ... 198
CONTEXT AND OVERVIEW ... 199
Chapter One ... 200
Chapter Two... 204
Chapter Three ... 207
Chapter Four ... 210
Chapter Five ... 215
Chapter Six... 219
DISCOURSE ... 223
Chapter One ... 224
Episode One – Small Group ... 224
Episode One – Whole Group ... 226
Chapter Two... 228
Episode Two – Small Group ... 228
Episode Two – Whole Group ... 230
Chapter Three ... 232
Episode Three – Small Group ... 232
Episode Three – Whole Group ... 234
Episode Four – Whole Group ... 237
Chapter Five ... 240
Episode Five – Whole Group ... 240
Chapter Six... 242
Episode Six – Whole Group ... 242
Episode Six – Small Group ... 245
TRENDS AND PATTERNS IN DISCOURSE ... 246
Trends in Class Design and Management ... 247
Trends in Form ... 249
Trends in Purpose ... 250
Trends in TPSK ... 252
UNDERSTANDING OF VARIABILITY ... 253
Describing Distributions ... 258
Pre-/Post-Assessment ... 259
Chapter 2 Homework ... 260
Performance Task. ... 262
Discussion Analysis ... 264
Interview Analysis ... 268
Summary of Understanding of Describing Distributions ... 270
Understanding Deviation ... 271
Pre-/Post-Assessment ... 272
Performance Task ... 273
Discussion Analysis ... 275
Interview Analysis ... 279
Summary of Understanding of Deviation ... 282
Understanding the Law of Large Numbers ... 283
Pre-/Post-Assessment ... 283
Performance Task ... 284
Discussion Analysis ... 286
Summary of Understanding the Law of Large Numbers ... 289
TRENDS IN UNDERSTANDING VARIABILITY ... 290
Statistical Knowledge (SK) ... 290
Technological Statistical Knowledge (TSK) ... 292
Technological Pedagogical Statistical Knowledge (TPSK) ... 293
SUMMARY ... 294
Revisiting the Social Presence of the Face-to-Face Case ... 295
Revisiting the Cognitive Presence of the Face-to-Face Case ... 297
Revisiting the Teaching Presence of the Face-to-Face Case ... 299
CHAPTER 6: CROSS-CASE ANALYSIS OF ONLINE AND FACE-TO-FACE CASES 301 INTRODUCTION ... 301
CURRICULUM IMPLEMENTATION ... 302
Class Management ... 309
Form of Discourse ... 313
Purpose of Discourse ... 316
Topic of Discourse ... 318
Summary of Discourse ... 320
UNDERSTANDING OF VARIABILITY ... 322
Describing Distributions ... 324
Understanding Deviation ... 327
Understanding the Law of Large Numbers ... 330
SUMMARY ... 333
Revisiting the Social Presence ... 334
Revisiting the Cognitive Presence ... 337
Revisiting the Teaching Presence ... 340
CHAPTER 7: DISCUSSION ... 344
INTRODUCTION ... 344
SUMMARY OF RESEARCH QUESTION 1 AND FINDINGS ... 345
Discourse ... 345
Opportunities for Interaction ... 350
SUMMARY OF RESEARCH QUESTION 2A AND FINDINGS ... 357
Describing Distributions ... 358
Understanding Deviation ... 359
Understanding the Law of Large Numbers ... 361
SUMMARY OF RESEARCH QUESTION 2B AND FINDINGS ... 363
Connection of Findings to the Community of Inquiry Framework ... 363
The Intersection of Social and Cognitive Presences... 365
LIMITATIONS ... 369
IMPLICATIONS AND SUGGESTIONS FOR FUTURE RESEARCH ... 371
Mathematics Teacher Education ... 371
Statistics Education ... 375
Final Thoughts and Lessons Learned ... 376
APPENDICES ... 394
APPENDIX A.QUESTIONS IDENTIFIED TO POTENTIALLY CAPTURE PROSPECTIVE TEACHERS’ DEVELOPING TPSK(LEE ET AL.,2010). ... 395
APPENDIX B.PRE-/POST-ASSESSMENT INSTRUMENT (FROM MADDEN,2008, PG.386-391). ... 398
APPENDIX C.SCORING RUBRIC FOR GRADING QUESTION 3 OF THE PRE-ASSESSMENT (MADDEN,2008, PG.422). ... 401
APPENDIX D.SCORING RUBRIC FOR GRADING QUESTION 5 OF THE PRE-ASSESSMENT (MADDEN,2008, PG.423). ... 402
APPENDIX F.SCORING RUBRIC FOR GRADING QUESTION 7 OF THE PRE-ASSESSMENT
(MODIFIED FROM MADDEN,2008, PG.426). ... 404 APPENDIX G.FINAL EXAM PERFORMANCE TASKS. ... 405
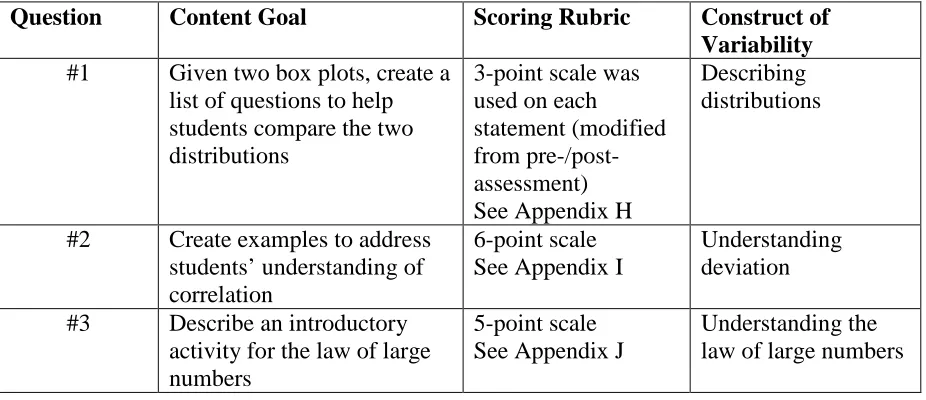
APPENDIX H.SCORING RUBRIC FOR FINAL EXAM PERFORMANCE TASK QUESTION ONE. .... 411
APPENDIX I.SCORING RUBRIC FOR FINAL EXAM PERFORMANCE TASK QUESTION TWO. ... 412 APPENDIX J.SCORING RUBRIC FOR FINAL EXAM PERFORMANCE TASK QUESTION THREE. .. 413
APPENDIX K.PROTOCOL FOR FIRST INTERVIEW. ... 414
LIST OF TABLES
Table 1. Opportunities for revealed understanding of variability identified a priori (exact
questions can be found in Appendix A). ... 55
Table 2. Brief summary of written data sources. ... 58
Table 3. Summary of pre-/post-assessment questions, scoring rubrics and corresponding constructs of variability... 59
Table 4. Summary of final exam performance tasks, scoring rubrics, and corresponding constructs of variability... 61
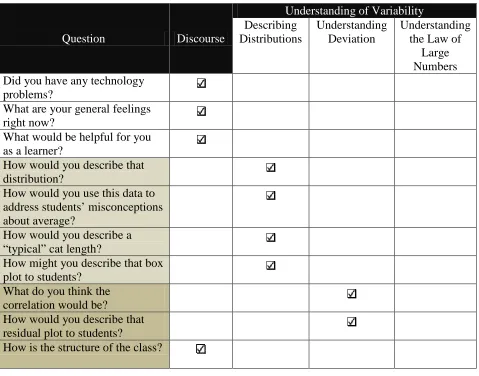
Table 5. Examples of interview questions related to discourse and understanding variability. ... 63
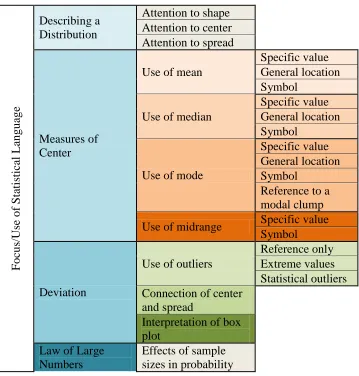
Table 6. Codes for discourse used in line-by-line analysis of episode transcripts. ... 69
Table 7. Codes for variability used in line-by-line analysis of episode transcripts. ... 72
Table 8. Online Episode 1, Small group discourse. ... 115
Table 9. Online Episode 1, whole group discourse. ... 118
Table 10. Online Episode 2, small group discourse... 120
Table 11. Online Episode 2, whole group discourse. ... 122
Table 12. Online Episode 3, small group discourse... 124
Table 13. Online Episode 3, whole group discourse. ... 126
Table 14. Online Episode 4, small group discourse... 128
Table 15. Online Episode 4, whole group discourse. ... 130
Table 16. Online Episode 5, whole group discourse. ... 134
Table 18. Online Episode 6, small group discourse... 138
Table 19. Online exchange percentages of types of purpose. ... 145
Table 20. Online percent of exchanges, summary of purpose (SK, TSK, TPSK). ... 147
Table 21. Online pre-assessment summary of statistics comfort levels. ... 150
Table 22. Face-to-Face Episode 1, small group discourse... 225
Table 23. Face-to-Face Episode 1, whole group discourse. ... 226
Table 24. Face-to-Face Episode 2, small group discourse... 228
Table 25. Face-to-Face Episode 2, whole group discourse. ... 230
Table 26. Face-to-Face Episode 3, small group discourse... 233
Table 27. Face-to-Face Episode 3, whole group discourse. ... 235
Table 28. Face-to-Face Episode 4, whole group discourse. ... 238
Table 29. Face-to-Face Episode 5, whole group discourse. ... 240
Table 30. Face-to-Face Episode 6, whole group discourse. ... 243
Table 31. Face-to-Face Episode 6, small group discourse... 245
Table 32. Face-to-face exchange percentages of types of purpose. ... 251
Table 33. Face-to-face percent exchanges for focus of discourse (SK, TSK, TPSK). ... 252
Table 34. Face-to-face pre-assessment summary of statistics comfort levels. ... 255
Table 35. Comparison of curriculum implementation. ... 303
Table 36. Comparison of opportunities of interaction by chapter. ... 305
Table 37. Comparison of episodes (time, number of exchanges, and purpose). ... 317
Table 38. Comparison of episodes (topic). ... 319
LIST OF FIGURES
Figure 1. The community of inquiry framework (Garrison, Anderson, & Archer, 2010, pg. 6).
... 9
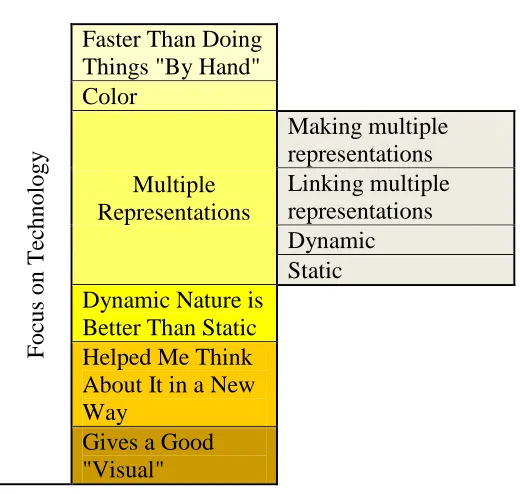
Figure 2. TPSK framework (Lee & Hollebrands, 2011, pg. 362). ... 21
Figure 3. Nested case study design. ... 49
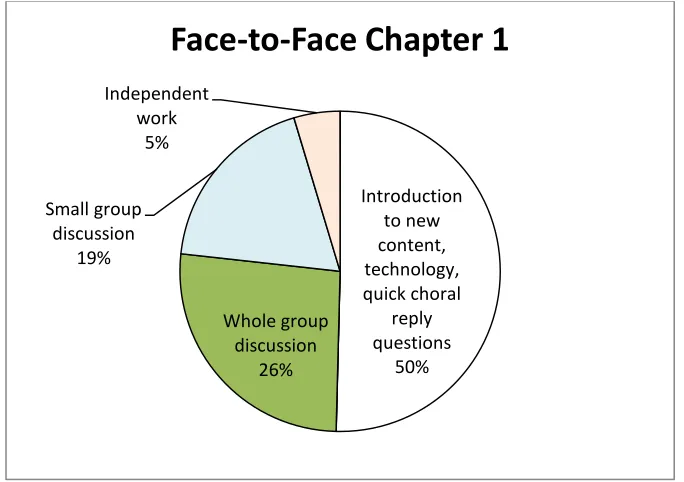
Figure 4. Opportunities for interaction in Chapter 1 of the face-to-face class. ... 65
Figure 5. Timeline for Chapter 1 of the face-to-face class. ... 66
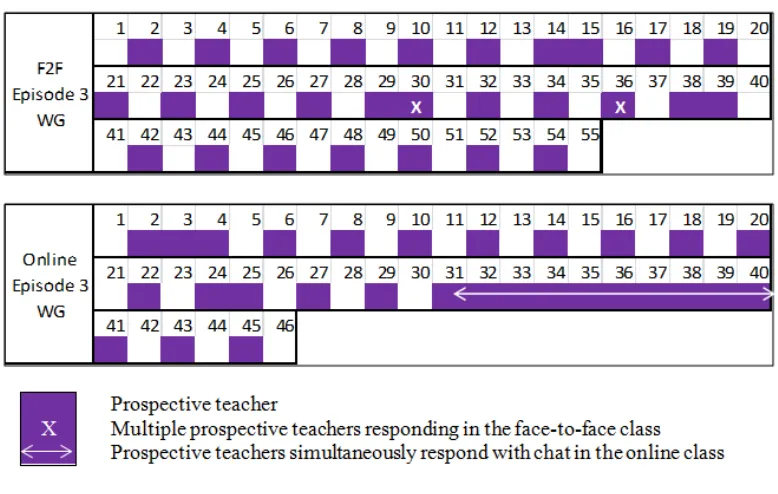
Figure 6. Example of discussion pattern representations... 68
Figure 7. Partial coding of discourse for online whole group discussion related to Chapter 4. ... 70
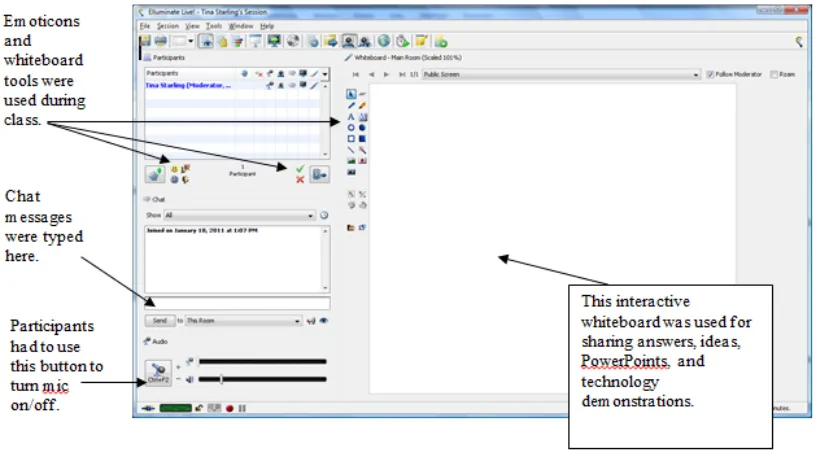
Figure 8. Sample Elluminate session. ... 83
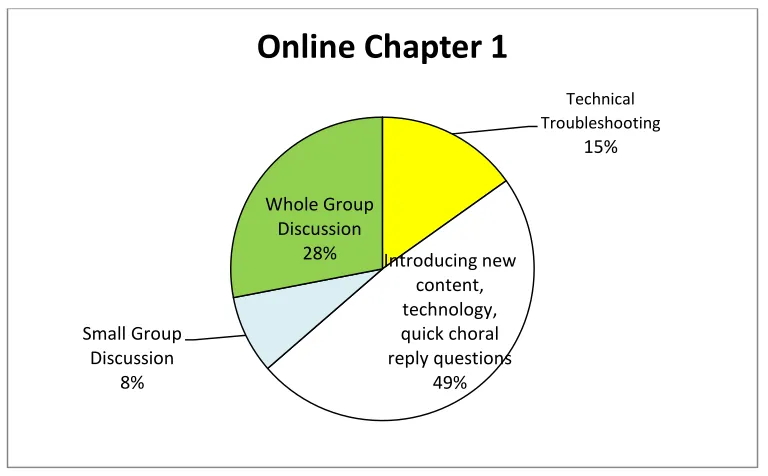
Figure 9. Opportunities for interaction in Chapter 1 of the online class. ... 85
Figure 10. Timeline for Chapter 1 of the online class. ... 86
Figure 11. Data cards and default plot in TinkerPlots; sharing an application within Elluminate. ... 87
Figure 12. Bar graph of a qualitative attribute in TinkerPlots. ... 87
Figure 13. Dot plot of a quantitative attribute in TinkerPlots. ... 88
Figure 14. Divider tool used by a prospective teacher for a quantitative attribute in TinkerPlots. ... 88
Figure 15. Survey of measures of center in the online class. ... 89
Figure 16. Opportunities for interaction in Chapter 2 of the online class... 91
Figure 18. Dot plot of graduation rate with the setting attribute selected (purple represents
private and yellow represents public). ... 92
Figure 19. Online focus group's whiteboard for Chapter 2 discussion. ... 93
Figure 20. Opportunities for interaction in Chapter 3 of the online class... 95
Figure 21. Timeline for Chapter 3 of the online class. ... 96
Figure 22. Movable line and squares with one attribute in Fathom. ... 97
Figure 23. Building bivariate understanding in Fathom. ... 98
Figure 24. Pre-created Fathom file for the curriculum text. ... 99
Figure 25. Summary table in Fathom for the correlation coefficient. ... 99
Figure 26. Movable line with squares in Fathom. ... 100
Figure 27. Chapter 4 Elluminate session. ... 101
Figure 28. Opportunities for interaction during Chapter 4 of the online class. ... 102
Figure 29. Timeline for Chapter 4 of the online class. ... 103
Figure 30. Prospective teacher’s interpretation of a residual plot in the online class. ... 104
Figure 31. Opportunities for interaction in Chapter 5 of the online class... 105
Figure 32. Timeline for Chapter 5 of the Online class. ... 106
Figure 33. Online survey of prior experiences with probability simulations. ... 107
Figure 34. Freshmen retention rate shown in TinkerPlots. ... 107
Figure 35. Results from coin simulation in the online class. ... 108
Figure 36. Probability simulation with different sample sizes in the online class. ... 109
Figure 37. Opportunities for interaction in Chapter 6 of the online class... 110
Figure 39. First Chapter 6 survey for the online class. ... 112 Figure 40. Dot plot of the PerctMale attribute in Fathom. ... 112 Figure 41. PerctMale dot plot with vertical reference line and Total attribute overlay in
Figure 60. Cats TinkerPlots file used in interview #1. ... 164 Figure 61. Pre/post-assessment item for understanding deviation (Madden, 2008, pg. 403).
... 167 Figure 62. Online pre/post understanding deviation assessment (out of 4 points). ... 168 Figure 63. Online performance task assessment of deviation (out of 6 points). ... 169 Figure 64. Online pre-survey of least squares regression understanding. ... 174 Figure 65. Online post-survey of least squares regression. ... 176 Figure 66. Online pre/post-assessment for law of large numbers (correct response B). ... 180 Figure 67. Online performance task for law of large numbers (out of 5 possible points). ... 181 Figure 68. Diagram of face-to-face computer lab. ... 199 Figure 69. Opportunities for interaction in Chapter 1 of the face-to-face class. ... 201 Figure 70. Timeline for Chapter 1 of the face-to-face class. ... 202 Figure 71. Face-to-Face demonstrations of introductory TinkerPlots activities. ... 203 Figure 72. Prospective teacher demonstrating the use of the divider tool in the face-to-face
class. ... 203 Figure 73. Dot plot of average teacher salary. ... 204 Figure 74. Opportunities for interaction in Chapter 2 of the face-to-face class. ... 205 Figure 75. Prospective teacher’s dot plot of graduation rates for public and private schools.
Figure 79. Movable line and squares with one attribute in Fathom projected in the face-to-face class. ... 210 Figure 80. Building bivariate understanding in Fathom in the face-to-face class. ... 210 Figure 81. Movable line with squares in Fathom projected in the face-to-face class. ... 212 Figure 82. Opportunities for interaction during Chapter 4 of the face-to-face class. ... 213 Figure 83. Timeline for Chapter 4 of the face-to-face class. ... 213 Figure 84. Interpretation of residual plots in the online (left) and face-to-face (right) classes.
... 214 Figure 85. Opportunities for interaction in Chapter 5 of the face-to-face class. ... 216 Figure 86. Timeline for Chapter 5 of the face-to-face class. ... 217 Figure 87. Coin toss simulation used in the face-to-face class
Figure 98. Face-to-face Episode 6 whole group discussion pattern. ... 245 Figure 99. Comparison of chapters for the face-to-face class. ... 247 Figure 100. Face-to-face statistical background responses (1 low comfort, 5 high comfort).
... 254 Figure 101. Box plots of the face-to-face group’s performance on the pre/post-assessments
(out of possible 31 points)... 257 Figure 102. Gains from assessment scores in the face-to-face group. ... 257 Figure 103. Pre/post-assessment item for describing distributions (Madden, 2008, pg. 397).
... 259 Figure 104. Face-to-face pre/post describing distribution assessment (4-point scale). ... 260 Figure 105. Face-to-face Chapter 2 assessment (4-point scale). ... 261 Figure 106. Sample performance task figure for comparing distributions (Backpacks.tp data
from TinkerPlots resources). ... 262 Figure 107. Describing distributions performance task results for face-to-face class ... 263 Figure 108. Cats TinkerPlots file used in interview #1. ... 269 Figure 109. Screen capture of divider tool in Sam's first interview. ... 270 Figure 110. Pre/post-assessment item for understanding deviation (Madden, 2008, pg. 403).
Figure 115. Face-to-face pre/post-assessment for law of large numbers (correct response B). ... 284 Figure 116. Face-to-face performance task for law of large numbers (5-point scale). ... 285 Figure 117. Physical arrangement of face-to-face focus group. ... 295 Figure 118. Timeline comparison of Chapter 4 in the online and face-to-face settings. ... 307 Figure 119. Timeline comparison of Chapter 1 in the online and face-to-face settings. ... 309 Figure 120. Discussion pattern comparison of Chapter 3 in the online and face-to-face
CHAPTER 1: INTRODUCTION Background of the Study
Over the past decade, there has been an increased focus to develop mathematics teachers’ knowledge as it relates to teaching and learning with technology. At the same time, there has been a growing interest in constructivism and accepting the notion that knowledge is socially constructed and distributed (Putnam and Borko, 2000). The combination of these contemporary foci has resulted in some teacher education programs making concerted efforts to help prospective mathematics teachers collaborate and grow their knowledge about
teaching with technology within settings that are designed to promote social interactions. One possible approach to this challenge is offering online coursework to reach prospective teachers and practicing teachers where they are geographically located; but an internet search for online courses in mathematics education exposes the near absence of online course offerings. While other academic fields have been increasing their offerings in the online setting, mathematics education has moved more cautiously. Perhaps it should not be surprising then, that the research presented for online mathematics education is minimal as well. Therefore, the field of mathematics education knows little about how an online
mathematics education course, especially a technology methods course, may compare to its face-to-face counterpart.
Levin, 2004) and mathematics education will need to learn how to adapt face-to-face methods courses so that prospective teachers will have the same online accessibility that students in other disciplines with online options are afforded.
Admittedly, preparation of today’s prospective teachers is a complex task. In any learning environment, there is the challenge of developing prospective teachers’ content knowledge as well as technological and pedagogical knowledge simultaneously. How do the ways in which they communicate their thoughts during mathematics education courses affect the development of this specialized knowledge? Knowing more about how prospective teachers may engage and interact with one another and the knowledge that is constructed in both face-to-face and online learning environments may help to answer questions
surrounding whether there are important similarities and differences in these environments for mathematics teacher educators to consider.
Purpose of the Study
The purpose of this study was to analyze discourse and opportunities for interaction in two mathematics education methods classes, one face-to-face and one synchronous, online. In addition, due to the content of the unit of study, this study sought to determine the role discourse played in developing statistical knowledge, focused on the concept of
variability, for teaching with technology in prospective mathematics teachers. Consequently, the goal was to answer the following research questions:
(2a) What is the nature of prospective teachers’ understanding of variability and teaching concepts related to data analysis and probability with technology? (2b) What is the role of discourse in face-to-face and synchronous, online
environments in developing this understanding among prospective mathematics teachers?
Clarification of Terms
Due to the relative recent emergence of online education, particularly to the world of mathematics education, definitions of terms may be helpful. Some refer to online education as distance education; others use the term e-learning instead, and many use the terms
interchangeably. Guri-Rosenblit (2005) admits there is some overlap, but the two are actually not synonymous. Distance education is typically associated with non-traditional students who live in remote locations, but it may be used by students of all ages, in any place
(Guri-Rosenblit, 2005). Furthermore, online education could be set in an environment that includes both asynchronous and synchronous activities, which are terms to describe non-simultaneous and simultaneous activities respectively (Hodges, 2005). For this study, the online setting was a synchronous learning environment. Participants were able to engage and interact with others in real-time.
One focus of this study was how prospective teachers engaged and interacted with others in the class (other prospective teachers and the instructor/researcher). Discourse encompassed all forms of communication to others. This included both verbal (i.e. talking, writing) and non-verbal (i.e. hand gestures, emoticons) forms of communication. In this study, prospective teachers were members of a technology mathematics education methods course. Technology refers to a collection of specific tools that may be used in teaching statistical and probabilistic ideas to students. This collection of technology tools included a TI-83+/84 graphing calculator, Microsoft Excel, and three programs that provide linked representations of data (TinkerPlots, Fathom, and Probability Explorer). These programs allowed users to display data collection windows, tables, graphs and more. The dynamic nature of Fathom and TinkerPlots allowed these multiple representations to be linked; when a user changed one representation, other representations changed simultaneously.
Developing knowledge of statistical technology listed above was important for prospective teachers participating in this study. Developing knowledge of teaching statistics with technology was even more important. This knowledge included, at its foundation, statistical content knowledge. One key concept in statistics is variability (Ben-Zvi, 2004; Burgess, 2007). Prospective teachers’ understanding of distributions, deviation, and the law of large numbers was addressed in this study.
Significance of the Study
one believes knowledge is socially constructed, how prospective teachers communicate and interact with one another certainly warrants additional research. Much of the current research literature on discourse is related to the mathematics classroom. For a number of years, there has been interest in discerning how it is that students of mathematics come to know what they know through social interactions (Yackel, Cobb, & Wood, 1991). What is missing, however, is how discourse may develop and manifest itself in mathematics teacher education and how it affects knowledge developed by prospective teachers.
Second, distance education coursework in higher education continues to grow, and it is no surprise that many academic disciplines have begun designing and implementing courses online. Although the jury is still out with regard to the quality of such courses currently being offered, no one can dismiss the efforts of such programs that have simply offered the online option. Because teaching online is a relatively new endeavor, much of the “research is in the form of case studies” (Engelbrecht & Harding, 2005, p. 268) and “most studies to date address learner perceptions and comparisons of online instruction to traditional course instruction” (Alexander, Lignugaris-Kraft, & Forbush, 2007, p. 201). Notwithstanding an undeveloped body of supporting research, it is likely that universities will continue to employ the use of online instruction until evidence surfaces that suggests such environments cannot be effective. Thus, it is also likely that the “research may reflect on practice rather than drive the practice” (p. 268).
second goal is to identify, analyze, and describe prospective teachers’ knowledge about teaching statistical and probabilistic concepts with technology as it develops in face-to-face and online settings. The results from this dissertation study will certainly fill a gap in the research literature for mathematics education.
Overview of Approach
To analyze discourse and prospective teachers’ knowledge in face-to-face and online education learning environments, this study employed a qualitative methodology. The primary objective was to learn more about how discourse and interactions help develop prospective mathematics teachers’ knowledge about teaching statistical and probabilistic ideas with technology. Since the form and strength of knowledge and processes cannot be completely measured or assessed quantitatively, utilizing qualitative methods through a multiple case study approach was necessary to allow for a more in-depth and detailed inquiry (Patton, 2002). A nested case study design was especially useful for this specific project because it permitted an in-depth investigation of two groups simultaneously and took advantage of individual cases.
Chapter Summary and Organization of the Study
Since there has been little interest in moving mathematics education courses
(particularly technology methods courses) online, there was a need to develop and study the effectiveness of one such course. The purpose of this work is to analyze the nature of
designed in order to answer the research questions. Chapter three will explain, in greater detail, the methodology used in this study to address those questions. Specifically,
CHAPTER 2: LITERATURE REVIEW Introduction
The current study aimed to examine the nature of discourse, in both face-to-face and online environments, that impacts the development of prospective teachers’ knowledge for teaching statistics with technology and to identify that knowledge in prospective teachers. For this literature review, numerous research and theoretical articles related to distance education, mathematics education, and statistics education were used. However, by no means is this review an exhaustive account of all literature pertaining to any of those disciplines. Instead, this literature review takes a broad look at three key presences in any mathematics education course – social, cognitive, and teaching. A community of inquiry framework (Garrison, Anderson, & Archer, 2000), with its social, cognitive, and teaching presences, will be formally introduced in the next section and will serve as a lens for reviewing literature related to this dissertation study.
The social presence includes opportunities for discourse and interaction. Thus, literature related to these opportunities with face-to-face and online learning environments was reviewed. The cognitive presence includes opportunities for developing knowledge associated with teaching statistical and probabilistic concepts with technology.
Understanding the research on how teachers think about variability was particularly
lessons so that opportunities exist for prospective teachers to engage and interact with others on important statistical ideas, using dynamic statistical technology tools. Literature
associated with facilitating this type of community of inquiry was also reviewed. This literature review concludes with a summary discussion on the implications of the literature cited.
Community of Inquiry Framework
The community of inquiry framework (Figure 1) attempts to understand the social, technological, and pedagogical processes that lead to collaborative knowledge construction (Garrison, Anderson, & Archer, 2000). It reveals the behaviors and processes necessary to cultivate knowledge construction through various forms of “presence.” The social, cognitive and teaching presence components that encompass this framework do not exist in isolation. Therefore, while the presences may be discussed independently, it is how they work together in order to foster a unique type of learning-community that is most important.
Because this study looked at effects of discourse on prospective teachers’ developing knowledge about teaching statistics with technology, it was important to consider all
presences of the learning environment. Therefore, the community of inquiry framework was used to provide organizational structure and continuity in reviewing literature related to the social, cognitive, and teaching presences in both face-to-face and online mathematics education courses.
Social Presence
The idea that knowledge is constructed by an individual through interactions is not a new one (Bruner, 1966, 1986, 1990; von Glasersfeld, 1984, 1989; Wertsh, 1985). In the mid-1900s, Piaget’s theory about social interaction incorporated the view that the social world has an important role to play in the developmental process (Tudge & Rogoff, 1989). Bruner (1966), who once described his teacher as a “human event not a transmission device,” asserted that reality is constructed by individuals through the use of other people and assistive tools (pg. 126). Vygotsky (1978) believed that it was the social interaction and dialectic process which furthered existing knowledge and promoted new insights.
Interpretations of his notion of the zone of proximal development have emerged that apply, extend, and reconstruct his original ideas (Daniels, 2001). The constructivist philosophy supports the belief that learners construct unique knowledge based on their own experiences and understanding.
More recent research in mathematics education supports that discourse and
1991). Socio-cognitive learning theory states that “learning is a social activity and that individuals learn more from their interactions with others than from reading materials alone” (Richardson & Swan, 2003, p. 43). Therefore, cognition is “social and distributed” (Putnam & Borko, 2000, pg. 5). This notion that knowledge is socially constructed is not limited to the mathematics classroom; it applies to mathematics teacher education classes as well. “The view that knowledge is socially constructed makes it clear that an important part of learning to teach is becoming enculturated into the teaching community – learning to think, talk, and act as a teacher” (Putnam & Borko, 2000, pg. 5, 9). This type of knowledge construction potentially results from purposeful discourse and interaction.
Discourse and Interaction
A major contributor to interactivity is discussion during class. “There must be time to talk about the mathematics, to develop models, to analyze and synthesize ideas, and to develop an atmosphere in which they can think for themselves…there must be adequate resources in an environment in which exploration and discovery are supported and ideas are valued and can be freely stated” (Sliva, 2002, pg. 80). Among any group of novices,
“The kind of conversation that promotes teacher learning differs from usual modes of teacher talk, which feature personal anecdotes and opinions and are governed by norms of politeness and consensus. Professional discourse involves rich descriptions of practice, attention to evidence, examination of alternative interpretations and possibilities” (pg. 1043).
Productive or professional discourse requires much more than prospective teachers simply grouped together. Therefore, it is critical that strategies are in place during class to assist prospective teachers in developing the practice of giving rich descriptions, attending to evidence, and considering alternate approaches as Feiman-Nemser (2001) suggests.
For mathematics teacher educators, much can be gleaned from existing research regarding strategies that have been shown effective in promoting constructive discourse with mathematics students. Research on effective whole-class discussions (Nathan & Knuth, 2003), questioning (Piccolo et al., 2008), and implementing effective small discussion groups (Elbers, 2003; Webb, 1991; Webb, Nemer, & Ing, 2006; Kazemi & Franke, 2004) may be transferred to teacher education. For example, we know that often ideas and/or actions are discussed and then become objects of discussion in their own right (Yackel & Cobb, 1996). This type of discourse is natural and healthy in developing knowledge for teaching.
opportunity not only to hear what the teacher is teaching, but actually converse and articulate their own understanding of the content being presented” (pg. 404). In their work, they also stressed the effect questioning from students has on discourse and interactions. When students ask questions, “they are thinking about their thinking” (pg. 381). Those types of reflective activities are important, especially for prospective teachers.
It is important to note that simply organizing prospective teachers into small groups does not imply social and distributed learning is taking place. Even online, networked interaction or social interaction, by itself, is insufficient to the development of a community of inquiry (Larreamendy-Joerns & Leinhardt, 2006; Shea & Bidjerano, 2009). As can be expected, in any learning environment, there are variations in the level of participation from prospective teachers and group functioning is not identical (Koehler & Mishra, 2005).
them to anticipate more about how their future students may approach a task differently and what they may do in response.
Discourse and Interaction Promoted Synchronously. The interactions in an online environment will undoubtedly be different from those in a face-to-face environment. But, results from research show that the computer-mediated environment can be powerful in initiating and maintaining a learning forum for mathematics teachers (Chinnappan, 2006). Web-conferencing programs such as Elluminate1 allow users to chat, view live
demonstrations, interact with presentations, and more. Advantages of using a synchronous learning environment include real time sharing of knowledge and immediate access to the instructor, and others, to ask questions and receive answers. In particular, with regard to environments such as Elluminate, students tend to favor features such as emoticons, hand raising, a shared whiteboard, polling, and application sharing as points of personal
engagement. McBrien, Jones, and Cheng (2009) found that with these features, students talked about an enhanced learning experience with improved communication, high levels of satisfaction with the course, and strong group cohesion when compared to earlier
asynchronous designs of online courses.
Stephens and Mottet (2008) also showed that increased interactivity with tools such as the ones described in Elluminate enhances participants’ satisfaction with the learning environment. Therefore, the interactivity of the students in a synchronous, online
environment is critical. Online instructors must employ strategies that encourage interaction to allow students to feel socially present in the lesson. One feature in web-conferencing
programs like Elluminate that shows promising gains is “Application Sharing” (Cady & Rearden, 2009). With this feature, participants have the opportunity to view live
demonstrations and even take control of the instructor’s mouse if permission is requested and granted.
Existing Frameworks For Analyzing Discourse and Interaction
Some researchers have used Vygotsky’s zone of proximal development explicitly as a framework for analyzing discourse. For example, Goos and Bennison (2004) used data from classroom observations and interviews to study scaffolding involved in teacher-student interactions, collaboration in student-student interactions, and interweaving of intuition and formalized concepts. Other researchers have broadened their perspective to include
“constructs derived from symbolic interactionism and ethnomethodology… to account for and explicate the development of general classroom social norms” (Yackel & Cobb, 1996, pg. 459). They describe the basis of explanations offered by mathematics students.
According to their work, students use explanations as descriptions of actions and as objects of reflection to construct sociomathematical norms (Yackel & Cobb, 1996).
learning. The levels of their “Math-Talk Learning Community framework went through cyclical revisions” (pg. 87).
Krussel, Edwards, and Springer (2004) also draw upon previous works. Their framework, designed to assist in understanding discourse moves, “synthesizes elements of several other discourse frameworks” (pg. 307). One such framework comes from Sfard (2000), who studied the foci of mathematics students’ talk. Sfard noted students’ pronounced and attended (either explicit or implicit) foci and the perceived intended focus from their words and actions. “A careful examination of the pronounced and attended foci, together with the researcher’s interpretation of the participants’ intended foci at various points in the discourse, provides insight into the process of developing mathematical understanding” (Krussel et al., 2004, pg. 308). Knuth and Peressini (2001) also introduced the distinction between univocal discourse and dialogic discourse, which is evaluation authority given to the teacher and to the group respectively. Using existing frameworks, including the ones
described above, Krussel et al. (2004) described discourse by purpose, form, and consequences. Their framework was used, among other things, to study discourse in a geometry course for teachers. Especially interesting in light of the current study, in their concluding comments, the authors claim that “although much of the discourse literature clearly concerns face-to-face settings, the framework can also be applied to discourse in distance courses” (Krussel et al., 2004, pg. 311).
may also be helpful for studying synchronous, online and face-to-face discourse and interaction as well. Topco and Ubuz (2008) found that coding messages and scoring them based on rubrics is critical for analysis of comments and interactions by prospective teachers. Their categorization of interactions included the following labels: “acknowledgment,
question, compare, contrast, evaluation, idea to example, example to idea, clarification, and cause-and-effect” (pg. 7-8). Similar labels for synchronous and face-to-face interactions are possible.
Nandi, Chang, and Balbo (2009) adapted frameworks from other distance education research to create their own way of selecting criteria for quality in prospective teachers’ online discourse about content and interaction. Specifically, they looked for evidence of: “clarification and critical assessment, justification or judgment, inferencing or interpretation, application of knowledge, prioritization of key knowledge, breadth of knowledge, critical discussions of contributions, new ideas/solutions, sharing outside knowledge, use of social cues or emotions, and participation rate” (Nandi et al., 2009, pg. 669). This type of
framework, they claim, can be helpful to online facilitators and researchers to assess discourse and interaction. Using these criteria to also evaluate quality of discourse and interactions in a face-to-face setting may be fitting, particular in discussions focused on content.
However, by allowing prospective teachers to focus on content and students’ thinking, they have a common ground on which to stand and base their conversations. Researchers have tried to develop frameworks for analyzing the social presence and its effects, each attending to different nuances that exist. They do seem to agree on one thing, however. The way students communicate and interact with one another, either face-to-face or online, may affect the knowledge they develop. In the current study, the knowledge being developed in
prospective teachers was knowledge about teaching statistics with technology. Cognitive Presence
In the previous section, the importance of socio-cognitive learning theory or social presence was stated. The notion that students construct knowledge from interactions with other students, the instructor, and the content is not new; and the practice of allowing
students to learn from one another is widely accepted in both face-to-face and online settings (Ling, 2007; Richardson & Swan, 2003).
meaningful discussions. Teachers with high metacognitive knowledge were more “aware” of the mathematical and pedagogical content in the messages and were better able to make connections between ideas presented in the discussions and their own. These teachers also tended to initiate interaction more frequently, perhaps ultimately leading to an even more satisfactory performance in the course. Prospective teachers with lower metacognitive knowledge benefited from tools or activities that could scaffold their thinking. They especially performed better with discussions that caused them to judge knowledge of self.
With the prior knowledge and attitudes students bring with them, cognitive presence may be more difficult to assess than the social and teaching presences. Regardless of the setting in which learning takes place, today’s prospective mathematics teachers need to develop a specialized type of knowledge. A literature search for fundamental knowledge of mathematics teachers results in parallel, yet independent results (Ball, Thames, & Phelps, 2008). Over time researchers have made claims about that which teachers should know in order to be effective in the classroom, but no consensus has been reached (Ball & Forzani, 2009; Fennema & Franke, 1992; Reynolds, 1992). Yet, there is enough evidence to suggest that mathematics educators do, in fact, require a specialized knowledge (Ball & Forzani, 2009; Ball et al., 2008). This knowledge may be a careful combination of knowledge related to content, technology, and pedagogy. The following sub-sections will look more closely at a possible combination of these types of knowledge.
Existing Frameworks For Analyzing TPSK
proficiency in content and pedagogy. Researchers believe that learning to teach mathematics is a developmental process the teacher will need to create – a process where different types of knowledge build on each other (Hiebert, Morris, & Glass, 2003; Simon, 1994). With the onset of easy-to-access interactive tools, the development of a unique knowledge comprised of technology, pedagogy, and content (TPACK) in prospective teachers is one goal of 21st century teacher education. TPACK is a way to represent what teachers need to know about technology and requires the design of a curricular emphasis that is all-encompassing, not a focus on technology, pedagogy, and content at individual moments. Mishra and Koehler (2006) described it this way:
“TPACK is the basis of good teaching with technology and requires an understanding of the representation of concepts using technologies; pedagogical techniques that use technologies in constructive ways to teach content; knowledge of what makes
concepts difficult or easy to learn and how technology can help redress some of the problems that students face; knowledge of students’ prior knowledge and theories of epistemology; and knowledge of how technologies can be used to build on existing knowledge and to develop new epistemologies or strengthen old ones” (p. 1029). Teachers who have a developed TPACK understand that “technology is not merely applied to the pedagogy of the past. It has implications for how we teach and what we teach” (Koehler & Mishra, 2005, pg. 144).
careful attention should be paid to how teachers learn and consequently, how teacher education programs facilitate that learning.
Mishra and Koehler’s (2006) popular TPACK framework highlights the intersection of three distinct types of knowledge in a Venn diagram. Lee and Hollebrands (2011)
specialized the notion of TPACK for the knowledge needed to teach data analysis and probability, the content focus of this study. Rather than viewing technological, pedagogical, statistical knowledge (TPSK) as the intersection of three distinct circles in a Venn diagram like the TPACK framework, they considered TPSK as layered circles. The TPSK framework allows researchers to consider statistical knowledge as the foundation of specific TPSK (Figure 2).
Figure 2. TPSK framework (Lee & Hollebrands, 2011, pg. 362).
developed simultaneously. “After teachers have engaged in examining a statistical question with technology, they are asked pedagogical questions concerning how technology and various representations can support or hinder students’ statistical thinking” (pg. 4). Specifically related to statistical ideas about variability, Lee et al. claim the following:
“The materials examine distributions graphically and characterize the data before computing statistical measures. Questions promote the comparison of distributions as means to transition to thinking about data as aggregate and help teachers conceptually coordinate center and spread. Studying data in a univariate context helps students consider measures of variation (e.g., residuals, sum of squares) in a bivariate context when modeling with a least squares line” (pg. 4).
Using the TPSK framework above, prospective teachers’ statistical content knowledge is developed in purposeful ways as they engage in tasks using technological tools. Pedagogical issues are woven into the activities once participants have some similar ideas about concepts being discussed.
Statistical Knowledge
Among teacher educators, there is little dispute over the belief that teachers need to be mathematically proficient (Hiebert et al., 2003; National Research Council, 2001; Stipek et al., 2001; Usiskin, 2001). But, only a few studies have found and tested appropriate levels of content knowledge required for teaching (Ball et al., 2008). In statistics education, there are even fewer related research efforts.
For this study, prospective teachers were engaged with curriculum materials related to data analysis and probability. Specifically, their knowledge of variability was assessed in light of three big ideas: analyzing/comparing distributions, understanding of
growing body of literature that focuses on postsecondary students’ understanding of statistics and probability (e.g. Hammerman & Rubin, 2004; Heaton & Mickelson, 2002; Madden, 2008; Makar & Confrey, 2004; Chance, delMas, & Garfield, 2004; Reading & Shaughnessy, 2004; Garfield, 1995). From these studies, we can begin to learn more about how prospective teachers may think about the ideas central to this study.
First, consider the terms variability and variation. Understanding variation has been identified as a key piece of statistical knowledge teachers must acquire (Ben-Zvi, 2004; Burgess, 2007). Reading and Shaughnessy (2004) maintain there is a distinct difference between variation and variability, but many researchers use the terms interchangeably (Slauson, 2008). Just as Makar and Confrey (2004) made no distinction between reasoning about variability and reasoning about variation, this study also made no distinction. Variation and variability will be used interchangeably due to the fact that variation/variability
encompasses so much. “Variation encompasses more than a measure, although measuring variation is an important component in data analysis. In considering variation, one must consider not just what it is (its definition or formula), or how to use it as a tool (related procedures), but also why it is useful within a context (purpose)” (Makar & Confrey, 2004, pg. 28).
Describing Distributions. Recall that this study assessed prospective teachers’ statistical knowledge about variability related to three big ideas: analyzing/comparing distributions, understanding of deviation/error/residuals, and articulating the Law of Large Numbers. Often with the materials used in this study, teachers were asked to analyze graphical representations. Leavy (2006) found that, initially, prospective mathematics teachers in a methods course preferred quantitative methods over graphical representations. By the end of the study, however, prospective teachers were much more likely to attend to effects of sample size and to benefits and drawbacks for certain statistical measures and graphical representations. According to Slauson (2008), Leavy’s study highlighted the “connection between statistical inquiry, concepts of distribution, and recognizing the importance of variation” (pg. 33).
While the Leavy (2006) study shows promising results, using graphical displays to describe variation is generally not an easy task for novice students of statistics or their teachers (Jacobbe & Horton, 2010; Makar & Confrey, 2004). Perceiving data as a series of individual cases rather than as an aggregate can be problematic (Bakker, 2004; Baker, Corbett, & Koedinger, 2002). However, allowing informal descriptions of distributional behavior is a great start to addressing the problem (National Council of Teachers of Mathematics, 2000; Konold & Higgins, 2003; Bakker & Gravemeijer, 2004; Makar & Confrey, 2004). Instead of exclusively using sophisticated statistical terminology, Makar and Confrey (2004) found that secondary mathematics teachers articulate the notion of variability in multiple ways. During their study, some teachers were able to use correct, standard
ways that inherently provided beneficial means of analyzing data. More importantly, however, were the reported long-lasting benefits in conceptual understanding with such informal statistical thinking.
Of particular interest to the current study were the ways in which students and prospective teachers described center and spread. In Makar’s dissertation study, she found prospective elementary teachers describing spread by using relative grouping with phrases and words such as “bulk of this data,” “scattered,” and “bunched” (Makar & Canada, 2005, pg. 276). In Canada’s dissertation study, he also found the same non-standard statistical language with prospective secondary teachers. They used words and phrases like “clustered,” “evenly distributed,” and “wider spread” to describe the spread or distribution of data (pg. 276). He also found prospective teachers were less likely to discuss center, despite having the means marked on the graphs that were shown to them. The lack of attention to center has caused others to make suggestions for developing an understanding of center in an alternative way. Konold et al. (2002) suggested developing the idea of a modal clump as a way to
characterize the center of a distribution.
“glips” (pg. 244). But, Madden reported this about the prospective teacher’s preference of graphical representations:
“He preferred to reason from dot plots because the actual data were preserved for his view. His second graphical preference for comparing distributions was histograms and he least preferred box plots. He acknowledged that he had only learned about box plots during the last 10 years and did not have great experience interpreting distributions with the box plot representation” (pg. 244).
By the end of her professional development, however, she found that “teachers’ responses indicated a generally greater disposition toward a distributional view of the data and awareness of variability” (pg. 204).
Another effort to develop prospective teachers’ understanding of center and spread was the curriculum materials used for this study (Lee et al., 2010). A recent study reported how prospective teachers used interval reasoning to coordinate center and spread through specific activities from the text (Lee & Lee, 2011). The way intervals were chosen varied. For example, one prospective teacher chose intervals that would include all possible values instead of trying to find an interval that would include most values. Another prospective teacher’s interval was symmetric about an expected value. While that particular study was centered around a probabilistic context, the notion of using intervals to help describe a distribution was an important part of the curriculum design in each chapter and is, therefore an important form of developing understanding of center and spread for the current study.
Understanding Deviation. Often, the term deviation is used when describing
distributions and variability, in general. But, some research has been specifically designed to capture understanding of standard deviation. Liu and delMas (2005) used a computer
standard deviation and histograms. They argued that a foundational knowledge of
distribution and arithmetic mean is critical if students are to develop proper understanding of standard deviation. In their analysis, they found eleven broad categories of justification: “balance, bell-shaped, big mean, contiguous, equally spread out, far away, guess and check, location, mean in the middle, mirror image, and more bars in the middle” (pg. 63). By the end of their study, students were moving from “simple, one-dimensional understandings of the standard deviation that did not consider variation about the mean to more mean-centered conceptualizations that coordinated the effects of frequency (density) and deviation from the mean” (pg. 55).
Slauson (2008) also tried to conceptualize how college students understood standard deviation. In her dissertation study, she used reform-type labs with her treatment group and discovered several different interesting responses. In answering questions, some students did not expect variability at all. Others knew that variability was expected but did not understand standard deviation was an appropriate measure to use.
offers suggestions for the statistical content knowledge needed for teaching association. Specifically, about the correlation coefficient, she claims that teachers need to understand how the formula creates a statistic that describes the strength and direction of a linear
association and why r is zero when points follow a horizontal line or some non-linear pattern. Understanding the Law of Large Numbers. Research has shown that prospective mathematics teachers have limited understanding of probability (Lee & Lee, 2011; Liu, 2005; Ives, 2009). In particular, prospective teachers often hold misconceptions about the Law of Large Numbers (Carter & Capraro, 2005; Ives, 2009; Konold, 1995). In her multiple-case study, Ives a prospective teacher was asked to clarify what she meant by a “good”
experiment. She responded:
“The main point that I'm trying to make in my paper is to get kids to realize that the more experiments you do the closer the experimental probability will be to the theoretical probability. Because like if something has a probability of like 11%, then let‘s say you only do 20 samples and something happens twice out of the 20 times, that will only give you 10%. But if you were to do maybe 100 samples or 100
experiments then it will happen maybe around 11 times so it will be closer to the 11% than your experimental probability was when you only did a few experiments” (pg. 92).
The prospective teacher seems to understand that a greater number of experiments should give closer results to the assumed known probability. What is missing, however, is evidence that she expects more variability with n=20 and that her sample of n=100 may not be large enough to result in the expected probability. This single instance of misunderstanding described above is one of the many examples Ives reports.
materials used in this study (Lee et al., 2010) with three groups of prospective teachers. A different curriculum was used with the control group. Post-test results showed tremendous improvement across all implementation and comparison groups with regard to a particular question related to law of large of numbers. They concluded that “merely engaging in learning about data analysis and probability may be helpful in one’s ability to correctly respond to that question, regardless of curriculum material” (pg. 43).
Assessing Understanding of Variability. Efforts in assessing the understanding of variability in elementary and secondary students have increased in the past decade (Reading & Shaughnessy, 2004). For example, Watson and Moritz (2003) developed a measure to assess understanding of variability in younger students. Their instrument includes a hierarchy of understanding ranging from prerequisite knowledge to critical reasoning. Unfortunately, less attention has been given in trying to understand what prospective teachers know and understand. For that reason, some researchers are applying assessments designed for younger students to different circumstances. Madden (2008) is one such example. She used the
Watson and Moritz (2003) assessment mentioned above with practicing high-school teachers. In her study, she used four levels of understanding to “help clarify teachers’ level of
Technological Statistical Knowledge
Some “lists” on required knowledge for teachers presented in the literature do not include technology explicitly (Ball & Forzani, 2009; Ball et al., 2008, Hiebert et al., 2003; Usiskin, 2001). Mishra and Koehler (2006) said this in response to Shulman’s (1986) popular pedagogical content knowledge (PCK) framework:
“Although Shulman did not discuss technology and its relationship to pedagogy and content, we do not believe that these issues were considered
unimportant…technologies weren’t foregrounded to the extent that they are today….What has changed since the 1980s is that technologies have come to the forefront of educational discourse primarily because of the availability of a range of new, primarily digital, technologies and requirements for learning how to apply them to teaching” (p. 1023).
Without doubt, some technology knowledge is necessary for the “work of teaching” (Ball & Forzani, 2009). Common technological use for productivity, including the use of word processors, equation editors, computer projectors, and more, are likely the norm rather than the exception. Today’s teachers are more comfortable and competent at using technology as a general pedagogical and performance tool (Putnam & Borko, 2000). More importantly, mathematics teachers are gaining an awareness of specific tools such as internet applets and dynamic mathematical software programs. This type of awareness brings to light new ways of thinking about how and when technology can be used during instruction. Furthermore, technological tools for learning mathematics provide a means for interactive and
collaborative experiences and are a product of the social constructivist approach to teaching and learning (Maor, 2003).
The participants for this study were enrolled in a Teaching Mathematics with
current study, are related to statistics and probability. Therefore, the technological knowledge of interest is that which is aligned to those technological tools used in the curriculum.
Specifically for teaching and learning statistical concepts, tools that allow for interactive and collaborative experiences include, but are not limited to, TinkerPlots (Key Curriculum Technologies, 2005), Fathom (Key Curriculum Technologies, 2007), and Probability Explorer (Stohl, 2002).
There is now a growing base of research on how these technologies may be used with students during instruction. Nearly a quarter of a century ago, Pea (1987) described two constructs of technology tools, which he called cognitive tools. First, he suggested that when cognitive tools are used to amplify, they accept the goals of curriculum and work to enhance understanding and achievement. Second, when cognitive tools are used to reorganize, they alter the curriculum. The way a cognitive tool is used is then determined by the teacher and/or school (Zbiek et al., 2007). However, in light of the current study, it is important to note here that technological “tools by themselves don’t reduce the complexity of data
analysis, nor do they solve the problem of variability” (Hammerman & Rubin, 2004, pg. 18). Instead, teacher development efforts will need to include opportunities for prospective teachers to develop an applied knowledge of the technologies they are learning. By using the technology to engage in tasks, teachers in this study experienced dynamically linked
about how to perform statistical functions with technology. TSK includes using technology to visualize abstract ideas and help make connections between representations.
Technological Pedagogical Statistical Knowledge
“Knowledge of general pedagogical principles is a necessary component of teachers’ knowledge” (Fennema & Franke, 1992, pg. 147). But, the focus of pedagogical knowledge in this study will be on prospective teachers’ ability to demonstrate the use of technology in order to effectively teach statistical and probabilistic concepts. Defining pedagogical
knowledge is tricky as multiple descriptions surface in the literature. Some describe it as the knowledge of students and how to best transfer new mathematical ideas to them practically; others describe it as approaches to, procedures for, and presentation of mathematics; still, others describe it as the knowledge of assessing students and making the most of curricular materials (Van der Sandt, 2007). Without a single definition, it is difficult to prescribe to teachers exactly what it is they need to know with regard to pedagogy. Suggesting the seamless integration of technology during instruction adds another layer to the definitions above. Yet, the potential descriptions above serve as a springboard for looking at what technological, pedagogical, content knowledge may encompass.