Division IV
COMPARISON OF DETERMINISTIC SSI RESULTS OBTAINED USING
EITHER MEAN-BASED FIRS APPLIED AT THE FOUNDATION LEVEL
OR SURFACE PSHA INPUT
Carl J. Costantino1, Thomas W. Houston2, Andrew S. Maham3, and Michael C. Costantino3
1 President, Carl J. Costantino & Associates, New York, NY ([email protected]) 2 Principal Engineer, Carl J. Costantino & Associates, New York, NY
3 Senior Structural Engineer, Carl J. Costantino & Associates, New York, NY
ABSTRACT
Current draft provisions of the American Society of Civil Engineers (ASCE) Standard 4 recommend either of two methods to generate seismic input to deterministic Soil-Structure Interaction analyses. Typically, Probabilistic Seismic Hazard Analysis (PSHA) spectral inputs are applied at the bedrock level and are used as input to probabilistic site response calculations using multiple realizations of the site profile accommodating uncertainty in layer velocity and damping properties. The results of these calculations are a series of strain-iterated profiles defined at the best estimate (BE), and ± one-sigma (upper (UB) and lower (LB) bound levels) together with the mean spectrum at the ground surface, as well as the mean in-column, and outcrop spectra at the foundation level. Two approaches are considered acceptable for performing deterministic soil-structure interaction (SSI) analyses with the BE, UB and LB soil profiles. In the first approach, the mean surface motions are used as input to the SSI analyses and the corresponding in-column motions are generated at the foundation depth. The envelope of the spectra calculated from the mean surface input must equal or exceed the mean in-column spectrum generated in the probabilistic site response calculations. In the second approach, the mean outcrop spectrum at the foundation level is used as input to the SSI analyses and the corresponding surface spectra computed for each profile. The envelope of these three spectra must then equal or exceed the mean surface spectrum.
These approaches for generating input motions for deterministic SSI calculations were used to determine seismic demands for an embedded facility with a site profile containing several velocity inversions. These inversions have a significant impact on the character of the spectral shapes at various depths associated with either the outcrop foundation motion or the corresponding in-column motions. The foundation is located above the highest strong velocity inversion in the profile. The results indicate that the deterministic calculations performed using the outcrop input motions lead to significantly higher seismic responses than those calculated from the mean-based surface motions.
INTRODUCTION
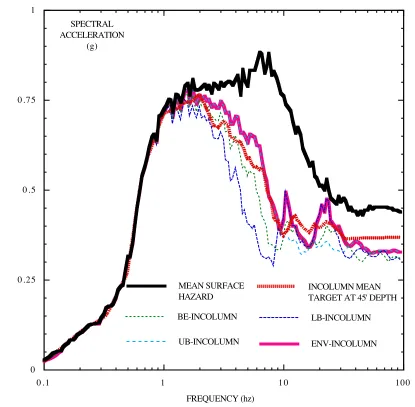
envelope of these three spectra must equal or exceed the mean in-column spectrum generated in the probabilistic site response calculations. By comparing these envelope spectra with the targets, scale factors can be generated to indicate the conservatisms in the SSI calculations using these two approaches for a given site. For this evaluation, the foundation of the structure was located at a depth of 45 feet.
INPUT MOTION DEFINITIONS
The evaluations presented in this paper consist of calculations of SSI responses for an embedded facility using two approaches for defining equivalent input seismic motions allowed by ASCE Standard 4. These two approaches, herein referred to as the FIRS Approach and the Mean Surface Approach, are described in the following sections. These two approaches for generating input motions to the deterministic SSI calculations are used to determine seismic input demands for an embedded facility being designed for the Department of Energy at the Los Alamos National Laboratory. The site consists of a number of volcanic tuff layers over bedrock located at a depth of approximately 700 feet. For the probabilistic site response calculations, PSHA spectral inputs were first applied at the bedrock level. Figure 1 indicates the mean bedrock outcrop motion obtained from the PSHA together with the corresponding mean surface spectrum. In addition, a time history fit of the mean hazard bedrock outcrop spectra is shown.
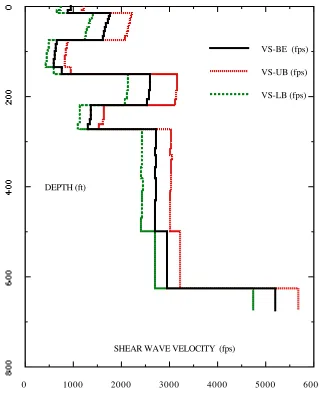
The bedrock outcrop motion is used as input to probabilistic site response calculations using multiple realizations (at least 60 realizations) of the site soil column that is defined by low-strain velocity and hysteretic damping properties for each layer of the profile together with estimates of their uncertainty. For each realization, the corresponding strain-iterated profile is generated. The resulting BE, LB, and UB shear wave velocity/damping profiles are then defined for the site from the mean (assuming lognormal distributions) and ± one-sigma values of these layer properties. The resulting three profiles to be used in the deterministic SSI calculations are shown in Figure 2.
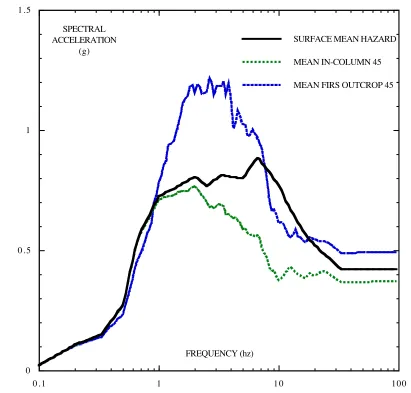
The mean bedrock outcrop motion is convolved upward through each of the strain-iterated soil column realizations. From these convolutions, mean in-column and outcrop spectra at the foundation level of 45 feet are obtained, along with mean surface spectra. These spectra are shown in Figure 3.
FIRS Approach
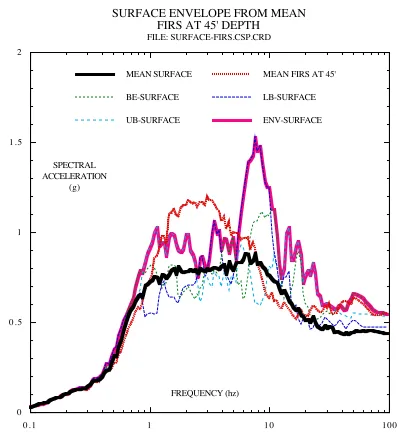
In this assessment, the mean FIRS outcrop motion shown in Figure 3 is first deconvolved downward from the foundation level through the BE, LB, and UB deterministic profiles to bedrock that is assumed to be a uniform halfspace. This bedrock outcrop motion is then input to the full column and convolved upward through the BE, LB, and UB profiles to obtain the surface spectra associated with the FIRS outcrop motion at the foundation level. Figure 4 shows surface envelope associated with the FIRS outcrop motion, along with an envelope of the BE, LB, and UB convolutions and the mean surface spectra computed from the site response realizations.
Mean Surface Approach
Division IV
SYNTHESIS OF RESULTS
FIGURES
0 0.25 0.5 0.75 1
SPECTRAL ACCELERATION
(g)
0.1 1 1 0 100
FREQUENCY (hz)
MEAN HAZARD AT BEDROCK AND GROUND SURFACE
File: SPECTRA.CRD
TIME HISTORY FIT MEAN HAZARD BEDROCK OUTCROP MEAN HAZARD SURFACE
Division IV
0 1000 2000 3000 4000 5000 6000 SHEAR WAVE VELOCITY (fps)
DEPTH (ft)
DETERMINISTIC PROFILES
File: PROFILE-COLA.CRDVS-LB (fps) VS-UB (fps) VS-BE (fps)
0 0.5 1 1.5
SPECTRAL ACCELERATION
(g)
0.1 1 1 0 100
FREQUENCY (hz) File: SPECTRA.CRD
MEAN FIRS OUTCROP 45 MEAN IN-COLUMN 45 SURFACE MEAN HAZARD
Division IV
0 0.5 1 1.5 2
SPECTRAL ACCELERATION
(g)
0.1 1 1 0 100
FREQUENCY (hz)
SURFACE ENVELOPE FROM MEAN
FIRS AT 45' DEPTH
FILE: SURFACE-FIRS.CSP.CRD
ENV-SURFACE UB-SURFACE
LB-SURFACE BE-SURFACE
MEAN FIRS AT 45' MEAN SURFACE
0 0.25 0.5 0.75 1
SPECTRAL ACCELERATION
(g)
0.1 1 1 0 100
FREQUENCY (hz)
ENV-INCOLUMN UB-INCOLUMN
LB-INCOLUMN BE-INCOLUMN
INCOLUMN MEAN TARGET AT 45' DEPTH MEAN SURFACE
HAZARD
Division IV
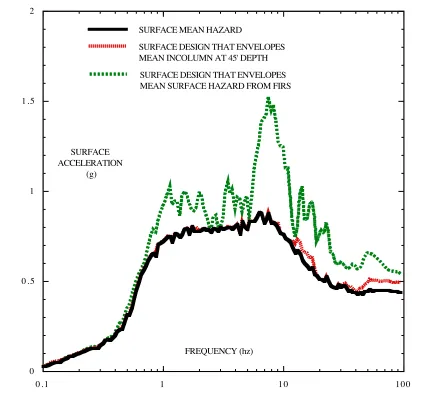
0 0.5 1 1.5 2
SURFACE ACCELERATION
(g)
0.1 1 1 0 100
FREQUENCY (hz)
SURFACE DESIGN.CRD
SURFACE DESIGN THAT ENVELOPES MEAN SURFACE HAZARD FROM FIRS SURFACE DESIGN THAT ENVELOPES MEAN INCOLUMN AT 45' DEPTH SURFACE MEAN HAZARD
Figure 6. Comparison of Surface Design Spectra Corresponding to the FIRS and Mean Surface Approaches
CONCLUSION
REFERENCES
ASCE 4-13 (2013), Seismic Analysis of Safety-Related Nuclear Structures and Commentary, Standard, American Society of Civil Engineers.
Wong, I. and Silva, W. (2007) “Update of the Probabilistic Seismic Hazard Analysis and Development of Seismic Design Ground Motions at the Los Alamos National Laboratory,” URS Corporation, Seismic Hazards Group