ALLOZYME FREQUENCY CHANGES ASSOCIATED WITH SELECTION FOR INCREASED GRAIN YIELD IN MAIZE ( Z E A MAYS L.)]
C. W. STUBERZ, K. H. MOLLZ, M. M. GOODMAN4, H. E. SCHAFFER3 A N D B.
s.
WEIR;ZAgriculturaE Research, Science and Education Administration, U.S.D.A. and Department of Genetics, North Carolina State Uniuersity,
Raleigh, North Carolina 27650
3Department of Genetics, North Carolina State University, Raleigh, North Carolina 27650
4Departments of Statistics, Genetics, and Botany, North Carolina State University, Raleigh, North Carolina 27650
SDepartment of Statistics, North Carolina State Uniuersity, Raleigh, North Carolina 27650
Manuscript received August 27, 1979 Revised copy received January 7, 1980
ABSTRACT
Frequency changes of alleles a t eight enzyme loci were monitored in four long- term maize selection experiments. The results indicate that changes in frequencies of the alleles at these loci are associated with changes due to selection for improved grain yield. The frequencies changed more than is consistent with the hyFothesis of selective neutrality. In addition, significant deviations from a random-drift model were nearly always accompanied by significant linear tiends as would result ii allozyme frequencies respond to directional selection. Evaluations of linkages aiid linkage disequilibria i n the selected populations indicate that the eight enzyme loci responded indepen- dently as selection progressed.
H E effects of long-term selection for grain yield or other agronomic traits T o n frequencies of alleles at enzyme loci in experimental populations of maize
(Zea n a y s
L.)
have not been well documented. Only a few experimental pro- grams have been conducted in which the selection procedure has been consistent over an extended period of time. Therefore, few available experimental popula- tions of maize have been suitable for studying the effects of long-term selection on enzyme loci.In a full-sib family selection experiment that originated from the F, between two maize lines (NC7 and CI21), STUBER and MOLL (1972) reported that the frequency of an acid phosphatase allele increased from 0.50 to 0.76 in the first six cycles of selection for increased grain yield. However, after nine cycles of selection, the population appeared to approach a stable intermediate frequency of 0.60 for this allele. BROWN (1971) examined the changes in alleles at six
Paper No 532G of the Journal Seiier of the North Carolina \ g i i c u l t u r d Experiment Station, Raleigh, North Calohna
2 i S 5 0 This Iniestigation was partially supported by iesearch grant GM-11545 from t h e Public Health Service and a grant from DeKalh kgResearch, Inc , DeKalb, Illmois
226 C. W. STUBEll et
d.
enzyme loci (four esterase loci, one alcohol dehydrogenase locus and one peroxi- dase locus) i n the long-term Illinois selection programs for high and low oil and protein in maize. He reported that the changes detected were consistent with the hypothesis of purely neutral drift, but that deviations suggested that isozyme variants were not entirely neutral to selection. BROWN and ALLARD (1971) mon- itored allele frequencies at nine enzyme loci for two cycles of reciprocal recur- rent selection in two populations of maize grown at Davis, California. They reported that the few changes noted could be ascribed to random genetic drift. Although the primary trait under selection was grain yield, their description indicates that selection was based on a number of agronomic and disease-resist- ance traits in addition to grain yield. Therefore, the selection intensity for any single trait would be low, and two cycles of selection would not be expected to have a significant effect on allozyme hequencies.
Long-term selection studies for a single trait, increased grain yield, have been conducted in the maize quantitative genetics program at North Carolina State University. Several selection schemes, both intra- and interpopulation, have been used. Remnant seeds representing each of the nine or more selection cycles completed have been maintained in cold storage and were available for growing plants for laboratory analyses of isozymes. Therefore, changes in fre- quencies of alleles at enzyme loci as selection progressed could be assessed in these selection studies.
The questions considered by the investigations reported here are: ( 1 ) Have frequencies of alleles at 20 enzyme loci changed in four long-term selection populations of maize? (2) Are the allozyme-frequency data consistent with the hypothesis of random drift? ( 3 ) Are the allozyme-frequency data significantly correlated with selection gain f o r grain yield?
(4)
Can types of gene action be inferred from comparisons of allozyme-frequency data in populations involved i n both intra- and interpopulation selection schemes? And ( 5 ) is there any evi- dence that the selection processes have contributed to linkage disequilibria or other correlations among enzyme loci?MATERIALS A N D RIETHODS
Plant materials
The populations evaluated represented sevcral cycles of selection for increased grain yield i n 4 experiments. These experiments were initiated i n 2 randomly mated, open-pollinated varieties of maize, Jarvis Golden Prolific and Indian Chief. Past history of these populations would suggest that little, if any, linkage disequilibria would be present. Selection procedures, described in detail by MOLL and ROBINSON (1966) and MOLL and STUBER (1971), are briefly reviewed below.
Full-sib family selection ( F S ) : Full-sib (intrapopulation) selection was initiated within each of the 2 varieties. Within each variety. a population of 256 full-sib families was gen- crated by mating each of 64 randomly chosen plants (pollinators) with a different sample of
ALLOZYME F R E Q U E N C Y C H A N G E S IN M A I Z E 22 7
selected families, the number of distinct male parents represented in any selection cycle was never less than 20. The number of female (seed) parents represented in the selected families was 25 i n each cycle. Therefore, the effective population size was always greater than 44.
Reciprocal recurrent selection ( R R S ) : Populations o l reciprocal testcross progenies were generated by mating each of 150 randomly chosen plants (males) from the Jarvis variety to a different sample of 4 randomly chosen plants from the Indian Chief variety. Likewise, each of 150 plants (males) from the Indian Chief variety was mated to a different sample of 4
plants from the Jarvis variety. The 300 testcross progenies (equal number of seeds from each of the 4 plants) were evaluated in replicated yield trials. Self-fertilized progenies of male parents of the selected 20 highest-yielding testcrosses from each variety were intermated (within each variety) t3 form the 2 populations f o r the next selection cycle. Approximately 640 crosses were made within each variety in each intermating generation. Selfing was prevented during the intermating; therefore, the effective population size in each variety was approximately 21
in each selertion cycle.
It should be noted that 2 opportunities for recombination are provided in each selection rycle for the above schemes, i.e., once during intermating of the plants representing the selected families and once during generation of full-sib families (FS) or selfed progenies (RRS) prior to initiation of the succeeding selection cycle. Therefore, the selected populations are expected to be in Hardy-Weinberg equilibrium at each locus following the intermating generation. Also, these recombinations should tend to counteract any accumulation of linkage disequilibria asso- ciated with the selection processes.
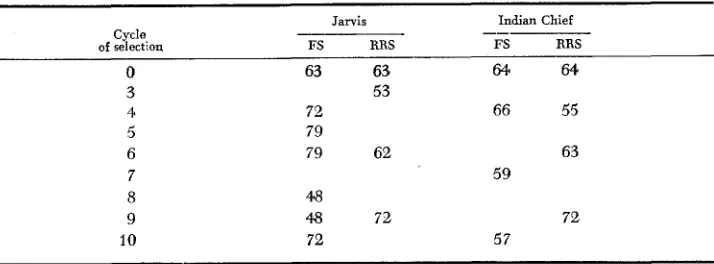
Seedlings used for the isozymp investigations were grown from- remnant seeds produced from the intermating generations f o r the specific selection cycles. Numbers of plants assayed for each cycle are shown in Table 1.
Electrophoretic assays
Of the 20 enzyme loci assayed, only 8 (Acphl, p - g l u l , Phil, P g m l , 6-Pgd1, 6-PgdZ, Mdhl
and !MdhZ) showed significant variation among selection cycles and are considered here. The other 12 were associated with catalase, alcohol dehydrogenase, endopeptidase, esterase, glutamate- oxaloacetate transaminase and additional malate dehydrogenase and phosphoglucomutase iso- zymes not included in this report. Coleoptile sections from 5-day-old seedings were used for all electrophoretic analyses. Techniques used for homogenization of plant materials and starch gel electrophoresiq for ACPH, p-GLU, 6-PGD, PHI and MDH allozymes were given by STUBER, GOODMAN and JOHNSON (1977). These techniques were modified for PGM by lowering the p H of the L-histidine citric acid buffer to 5.0 (0.004 M i n the gels and 0.05 M in the electrode trays lor L-histidine; 0.002 M in the gels and 0.024 M in the electrode trays for citric acid). In addi- tion, the power was maintained at 8 watts during a 7% hr period a t 2". Resolution of some
TABLE 1
Number of plants assayed for allozyme frequencies in four maize selection experiments
Jarvis Indian Chief
-- _-__
RRS Cycle.
of selection FS RRS FS
0 63 63 64 64.
3 4 5 6 7 8 9 10
53
72 66 55
79
79 62 63
48
4 8 72 72
72 57
228 c . w. STUBER et al.
M D H allozyme bands was improved at the lower pH. Therefore, one gel slice from each of the 5.0 gels was also assayed for M D H (GOODMAN et al. 1980).
After electrophoresis, zones of enzyme activity were revealed with the following assays: Acid phosphatase ( A C P H ) : 70 ml sodium acetate-acetic acid buffer (pH 5.0), 200 m g Diazo Blue B (0-dianisidine, tetrazotized) and 200 mg alpha naphthyl acid phosphate.
p-glucosidase (P-GLU) : 50 m g 6-bro~no-2-naphthyl-/3-D-glucoside dissolved in 10 m l acetone, 70 m l 0.05 M phosphate buffer ( p H 6.5) with 1.6 g polyvitiylpyrrolidone and 10 m g Fast Blue BB salt.
Phosphohezose isomerase ( P H I ) : 50 m l 0.05 M Tris-HC1 buffer ( p H 8.0), 50 m g D-fructose- 6-phosphate disodium salt, 50 mg MgCI,, 5 mg NADP, 5 mg MTT, 1.5 m g PMS and 10 units glucose-6-phosphnte dehydrogenase.
Phosphoglucomuiase ( P G M ) : 100 ml 0.1 M Tris-HC1 buffer ( p H 7.0), 500 mg a-D-glucose-
I-phosphatc disodium salt, 50 nig EDTA, 10 m g NADP, 20 m g NBT, 2 m g PMS, 200 m g MgC1, and 80 units glucose-6-phosphate dehydrogenase.
6-Phosphogluconate dehydrogenase (6-PGD): 15 m l 0.1 M Tris-HCl buffer ( p H 7.0), 40
m g 6-phosphogluconic acid trisodium salt, 20 m g NADP, 25 m g MTT, 2 m g PMS and 15 ml 2% agar.
Malate dehydrogenase ( M D H ) : 50 ml 0.1 M Tris-HCl buffer ( p H 9.1), 100 m g malic acid
(neutralized with NaOH to p H 9.0), 20 mg NAD, 10 mg NBT and 1.25 m g PMS.
Statistical procedures
Statistical procedures developed by SCHAFFER, YARDLEY and ANDERSON (1977) were used to test whether the observed gene-frequency variation from generation to generation (or cycle to cycle) was consistent with that predicted by the null hypothesis I f drift acting alone. With
iheir procedures, i t is assumed that individuals are sampled randomly and independently from a random mating population. Therefore, the sampling of genes follows the binomial distribu. tion. The angular ( o r arcsin) transformation applied to the data in their analysis is
2 s i n - l d g e n e frequency ~
where the angle is expressed in radians. The transformed observations have a multivariate normal distribution under the null hypothesis of drift acting alone. This null hypothesis is tested by using the appropriatc tabulated values of the Chi-square distribution in a one-tailed lest.
Thc above test may be responsive to any departure fiom a model based solely on drift. However, it is n o t particularly sensitive to a directional change i n gene frequency such as might accompany directional selection. T o test for selection, a quadratic form with a single degree of freedom is used that is more closely related to directional change i n gene frequency and includes the variation attributable to a n y linear trend in the gene frequency. This is also tested by using the tabulated value of the Chi-square distribution i n a one-tailed test. This test was shown by SCHAFFER, YARDLEY and ANDERSON (1977) to have greater power to detect gene- frequency shifts resulting from directional selection than the first test for drift described above. The tests of significance outlined above are dependent on both the effective population size in the selection experinients and the numbers of plants assayed to estimate allozyme frequencies. For loci with co-dominant alleles, linkage disequilibria were estimated and tested both as composite coefficients that do not require the assumption of random mating (WEIR 1979) and as single coefficients when Hardy-Weinberg equilibrium is assumed (WEIR and COCKERHAM 1979). For the results reported herein, the two measures did not differ appreciably. For situa- tions involving dominance a t one locus and co-dominance at the other, we used the iterative technique suggested by HILL (1974). This procedure requires random union of gametes.
RESULTS
ALLOZYME FREQUENCY CHANGES I N M A I Z E
TABLE 2
Accumulated selection gain (grams per plant) for grain yield in four maize seleciion experiments
229
Cycle of selection
Indian Chief
FS' RRSt
1
2 3 4 5
6
7 8 9 10
10.0 18.1
20.4 7.7
18.6 41.7
33.1 48.5
44.1 31.8
55.3 78.0
55.8 52.6
52.6 53.1
62.1 59.0
67.6
Standard errors$ 5.8 8.2
34.9 18.1
14.5 9.1
22.7 34.9
14.1 50.3
27.2 444.0
25.9 69.9
23.6 40.4
56.7 48.1
21.8 64.9
19.5
5.4 9.1
~ ~ ~ ~~ ~~ ~~ ~~
* Full-sib family (intrapopulation) selection evaluated within each variety.
5. Reciprocal recurrent (interpopulation) selection evaluated in crossbred combination with the other variety.
$Standard errors presented are the average standard errors of the difference between the selected population mean and the unselected population (control) mean and are appropriate for testing whether the accumulated gain differs from zero.
ence between the selected and unselected (control) population means for each cycle of selection. The standard errors were homogeneous. Therefore, only the average for each selection experiment is presented (Table 2). These average standard errors are appropriate for testing the difference from zero for any of the accumulated gain values.
Results from the first eight cycles of artificial selection were published earlier (MOLL and STUBER 1971; MOLL et aZ. 1978). In the full-sib (intrapopulation) selection experiments, the Jarvis population has shown a steady linear increase in grain yield. This is in sharp contrast to the Indian Chief population, which has shown no significant increase since the first cycle of selection.
Results shown for the reciprocal recurrent (interpopulation) selections are hybrid responses, i.e., the Jarvis RRS column (Table 2) shows crossbred results
for mating males from the Jarvis RRS populations with females from correspond- ing Indian Chief RRS populations. Likewise, the Indian Chief RRS column shows results of hybrid responses for reciprocal matings. Gains were similar in both types of hybrids and agreed closely with gains in the Jarvis FS experiments.
Genetic characterizations of the isozymes studied have been documented for
five of the enzyme loci as follows: P-gZul by STUBER, GOODMAN and JOHNSON (1977) ; Acphl by STUBER and MOLL (1972) ; Mdhl and Mdh2 by GOODMAN
et al. (1980) and reported as M d h l and Mdh2, respectively, by YANG, SORENSON and SCANDALIOS (1977) ; and Pgml by STUBER and GOODMAN (1979). In addi- tion, appropriate genetic crosses indicated monogenic patterns of inheritance for P h i l , 6-Pgdl and6-Pgd2 (unpublished data).
230 c.
w.
STUBER et al.mosome 6. Linkage studies involving backcross and F, populations indicate that Pgml is located about 20 map units from Phil on chromosome
l
( WEISSINGER,STUBER and GOODMAN 1979). However, data from the linkage studies indicate that all other possible pairs of the eight enzyme loci segregate independently.
Allozyme frequencies were estimated in the unselected population (cycle 0).
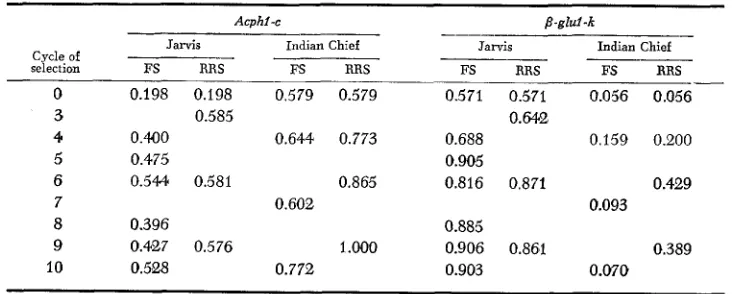
the last cycle of selection completed and two intermediate cycles of selection in the Indian Chief FS and both RRS experiments. Five intermediate cycles were evaluated in the Jarvis FS experiments. Although six alleles at the p-glul locus and three at the Acphl locus were present in the populations evaluated, only two alleles were present at each of the other six loci considered here. Frequency data are reported for the predominant allele at each specified enzyme locus (Tables 3 through 6 ) . For gene-frequency estimates between 0.15 and 0.85,
standard errors range from 0.04 to 0.06 and decrease as frequencies approach either 0.0 or 1.0. Because there was no evidence for deviations from Hardy- Weinberg equilibrium in the intermating generations (the generations sampled for the allozyme analyses), genotypic frequencies are not presented.
Frequencies of the Acphl-c allele increased in all four selection experiments (Table 3 ) . The magnitude of the increase in Indian Chief
FS
was only about one-half that in the other three experiments. Frequencies of tlie P-glul-k allele increased by a similar magnitude in all but Indian Chief FS, which showed no change for this allele (Table 3 ) .For the Phil-e allele, frequencies decreased somewhat in the two Jarvis experi- ments. In the Indian Chief experiments, the frequencies increased (Table 4). Frequencies of the Pgml-A9 allele increased in all four experiments (Table 4).
This allele became fixed in the Jarvis experiments and nearly fixed in the Indian Chief experiments.
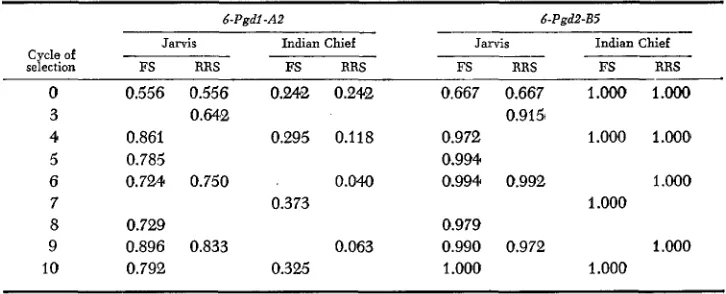
Frequencies of the 6-Pgdl-A2 and 6-Pgd2-B5 alleles increased with both types of selection in the Jarvis experiments (Table
5 ) .
Frequencies of 6-Pgdj-AZTABLE 3
Frequencies* of Acphl and p-glul alleles in four maize selection experiments
Cycle of selection
Acphl -c
Jarvis Indian Chief
-
FS RRS FS FiRS
0
3 4
5
6
7
8
9 10
0.198 0.198 0.579 0.579
0.400 0.644 0.773 0.475
0.544 0.581 0.865
0.396
0.427 0.576 1 .WO
0.5'28 0.772
0.585
0.602
Jarvis -__
FS RRS
0.571 0.5'71
0.64.28
0.688 0.905 0.816 0.871
0.885
0.903 0.906 0.86'1
Indian Chief
FS RRS
0.056 0.056
-
0.159 0.200
0.429 0.093
0.389
0.070
~~
ALLOZYME FREQUENCY CHANGES IN MAIZE
TABLE 4
Frequencies* of Phil and Pgml alleles in four maize selection experiments
231
Phil -e
--
--- Pgml-AYJarvis Indian Chief Jarvis Indian Chief
Cycle of
-
selection FS RRS FS RRS FS RRS FS RRS
0 0.984 0.984 0.4.05 0.405 0.735 0.735 0.637 0.637
3 1 .WO 0.637
4 0.736 0.583 0.518 0.850 0.937 0.944
5 0.791 0.928
6 0.741 0.831 0.579 0.987 1.ooo1 0.9ao
7 0.619 0.948
8 0.781 1 .O#
9 0.708 0.868 0.556 0.990 1.Ooo 0.979
10 0.711 0.661 1
.ooo
0.964* Standard errors for most estimates equal 0.04 to 0.06. (see text).
showed a decrease in the Indian Chief RRS, but did not change significantly in the Indian Chief FS. The unselected Indian Chief population was fixed for the 6-Pgd2-BS allele; therefore, no changes were detected.
The M d h l - A 6 allele frequencies decreased in Jarvis and increased in the Indian Chief experiments (Table 6). For the Mdh2-B3 allele, frequencies increased in all experiments except the Indian Chief FS, which showed little change.
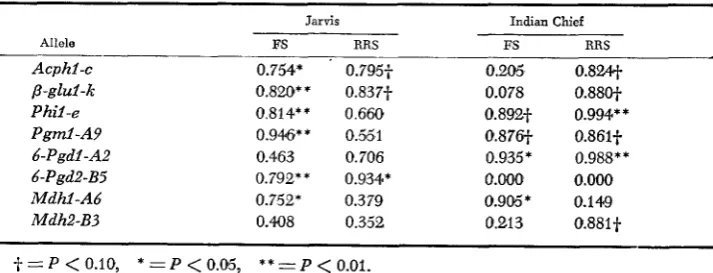
Coefficients of determination ( P ) from the correlation analyses of allele fre- quencies with accumulated selection gain are presented in Table 7. Allele fre- quencies at all of the enzyme loci evaluated showed significant relationships with accumulated selection gain for grain yield in one or more of the four
TABLE 5
Frequencies+ of 6-Pgdl and 6-Pgd2 alleles in four maize selection experiments
6-Pgdl -A2 d-Pgd2-B5
Jarvis Indian Chief
Cycle of
selection FS RRS FS RRS
0 3 4 5
6 7
8 9 10
0.556 0.556 0.342 0.242
0.861 0.295 0.118
0.785
0.724 0.750 0.040
0.729
0.896 0.833 0.063
0.792 0.325
O H 2
0.373
Jarvis Indian Chief
FS RRS FS RRS
0.667 0.667 1.Ooo 1.OOO
0.972 1.000 1.000
0.994
0.994 0.992 1 .WO
0.979
0.990 0.972 1 .ooo
1 .OOO 1.000
0.9151
1 .ooo
c . w. STUBER et al.
TABLE 6
Frequencies* of Mdhl and Mdh2 alleles in four maize selection experiments
232
Mdh2-B3
__
Mdhl -A6
Jarvis Indian Chief Jarvis Indian Chief
-
~-
-
selection Cycle of FS RRS FS RRS FS RRS FS RRS
0 0.642 0.642 0.742 0.742 0.255 0.255 0.485 0.485
3 0.137 0.401
4 0.204 0.977 0.714 0.559 0.478 0.643
5 0.3 18 0.426
6 0.276 0.359 0.753 0.405 0.404 0.718
7 1 .om 0.609
8 0.204 0.521
9 0.204 0.289 0.907 0.618 0.688 0.796
10 0.204 I
.ow
0.447 0.454* Standard errors for most estimates equal 0.04 to 0.06 (see text).
selection experiments. Six of the eight loci showed significant r2 values at the 0.05
level of probability in Jarvis FS.
In
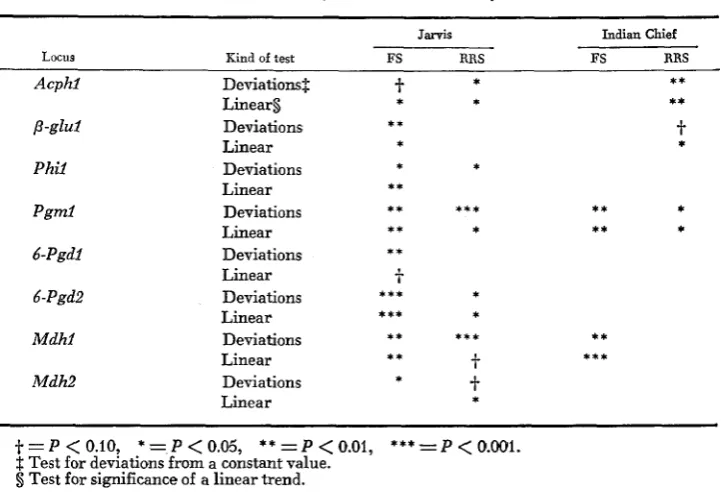
the two Jarvis selection experiments, all but two of the 16 tests for devia- tions from random drift at the eight enzyme loci were significant at the 0.10level of probability (Table 8) ; twelve were significant at the 0.05 level. Ten of the 16 tests for a linear trend were significant at the 0.05 level (12 of 16 at the
0.10 level) in the Jarvis experiments. It should be noted that changes of allele frequencies for each of the eight loci were in the same direction, and magnitudes of the changes were similar in both the Jarvis FS and Jarvis RRS. These results are of particular interest because the FS selection procedure is based on intra- population performance, whereas the RRS procedure is based on combining ability with Indian Chief, two very different procedures.
TABLE 7
Coeficients of determination (re) between allozyme frequencies and accumulated selection gain for grain yield in four maize selection experiments
Jarvis Indian Chief
Allele FS RRS FS RRS
Acphl-c 0.754* 0.795-f 0.205 0.8w
p-glul-t 0.820* * 0.837-f 0.078 0.88O-f
Phil-e 0.814** 0.660 0.892-f 0.994** P g d - A P 0.946* * 0.55 1 0.87W 0.86lt 6-Pgdl -A2 0.463 0.706 0.935* 0.988**
Mdhl-A6 0.752* 0.379 0.9M* 0.149
Mdh2-B3 0.408 0.352 0.213 0.881~
6-Pgd2-B5 0.792* * 0.934* 0.aOa 0.000
ALLOZYME F R E Q U E N C Y C H A N G E S I N M A I Z E
TABLE 8
Chi-square tests for deuiations from random drift and for linear trends in allele frequencies at eight enzyme loci in four maize selection experiments
233
Jarvis Indian Chief
Locus Kind of test FS RRS FS RRS
*
*** * **
Acphl Deviations$ 4
p-glul Deviations * *
Linears
Linear
Linear **
Linear
6-Pgdl Deviations * *
Linear i.
6- Pgd2 Deviations Linear
Mdhl Deviations
Linear
Linear
t
* *
* *
Phil Deviations
Pgml Deviations ** *** **
** * **
* *
* * *
***
*
*
** *** **
*** * *
*
t
Mdh2 Deviations
1-
*
+ = P < 0 . 1 0 , * = P < 0 . ( 1 5 , * * = P < 0 . 0 1 , * * * = P < O . W i . Test for deviations from a constant value.
Test for significance of a linear trend.
Only five of the 16 tests for deviations from random drift were significant in the Indian Chief experiments. Likewise, five of the 16 tests for a linear trend were significant, three of these in Indian Chief RRS. Results of these tests, par- ticularly in Indian Chief FS, were consistent with the negligible selection gain and minimal allele-frequency changes noted above.
In addition to the intrapopulation comparisons, we also compared changes of allele frequencies and significance of linear trends on an interpopulation basis in which selection procedures were similar, but the varieties differed. Four of the loci, Acphl, p - g l u l , Pgml and Mdh2, showed significant or nearly sig- nificant linear trends over generations for both the Jarvis RRS and Indian Chief RRS experiments. For each of these four loci, changes of allele frequencies were in the same direction, and magnitudes of the changes were nearly identical in both varieties.
234 c . w. STUBER et al.
complete dominance, their model indicates that, as selection progresses, loci con- tributing to heterosis generally would be expected to show a change in the differ- ence between gene frequencies (ARRS) in the two
RRS
populations that is opposite i n sign from the change in the difference between gene frequencies (AFs) for the two FS populations. Analyses of gene frequency changes indicated that ARRS and A, had opposite signs for Atcphl, p-glul and P g m l . However, the changes for these loci differed very little from zero. Therefore, the contributions of these three loci to heterosis may be of minor importance.In general, the significant linear trends, particularly in the Jarvis experi- ments, suggest that the significant relationships of the enzyme loci with grain yield might best be explained by an additive genetic model. If other loci tightly linked to the enzyme loci were responsible for the correlations with grain yield, similar models would apply to the linked loci. These interpretations are con- sistent with the changes in expected frequencies of heterozygous genotypes at the enzyme loci in the RRS population hybrids. The heterozygote frequencies remained constant or decreased for six loci and increased less than 0.03 per cycle for 6-Pgdl and M d h l .
Estimates of linkage disequilibria f o r the various pairs of segregating enzyme loci were computed. Statistical tests showed significance in fewer than one of
20 comparisons. Consequently, there was no evidence for a n accumulation of disequilibria associated with selection for grain yield.
DISCUSSION
The results indicate that changes in frequencies of alleles at eight different enzyme loci were associated with changes due to selection for improved grain yield in four maize selection experiments. For three of the eight loci (Acphl, p-glul and P g m l ) , and possibly a fourth ( M d h Z ) , the data are consistent with selection at, or close to, the enzyme loci and with selection acting similarly in each selection experiment. For 6-Pgdl and M d h l , selection has had a dramatic effect on gene frequencies in several of the populations examined. However, the responses at these two loci differ in direction for Indian Chief RRS as com- pared to Jarvis FS and Jarvis RRS. The data are not definitive f o r the other two loci
(Phil
and 6-Pgd2). However, for 6-Pgdl, Mdhl and P h i l , the data suggest strong selection for other linked genes that were initially in linkage disequi- librium with genes at these enzyme loci.Several other observations regarding allozyme-frequency changes are impor- tant. First, the greatest changes were noted in the selection experiments that showed the greatest improvements in grain yield. These were Jarvis FS, Jarvis
ALLOZYME FREQUENCY CHANGES I N M A I Z E 235
different, as was discussed above. Third, in the two interpopulation experiments (Jarvis
RRS
and Indian Chief RRS),
similar changes of allele frequencies, both in direction and magnitude, occurred for four loci. Fourth, although three of the eight loci (Acphl, p-glul and P g m l ) showed a possible contribution to the heterotic yield response between the two RRS populations, the data tended to be consistent with an additive genetic model for each of the eight loci.We recognize that the allozyme-frequency changes noted provide no assurance that the loci observed are, in fact, under direct selection or that any effect on grain yield is due to these loci. Because the populations were under directional selection for grain yield and exhibited responses to this selection, enzyme loci that were initially in linkage disequilibrium with loci affected by selection should also show concurrent shifts in allele frequencies. However, the likelihood of similar shifts occurring in several selection experiments appears to be remote. Also, linkage relationships and evaluations of linkage disequilibria in the selected populations indicated that the eight enzyme loci responded independently as selection progressed.
Therefore, we conclude that allozyme frequencies in the populations studied changed more than is consistent with the hypothesis of selective neutrality (drift acting alone). In addition, the significant deviations from a random drift model were nearly always accompanied by significant directional changes, such as would be expected if allozyme frequencies responded to directional selection.
LITERATURE CITED
BROWN, A. H. D., 1971
BROWN, A. H. D. and R. W. ALLARD, 1971
GOODMAN, M. M., C. W. STUBER, C.-N. LEE and F. M. JOHNSON, 1980
HILL, W. G.. 1974
MOLL, R. H., C. C. COCKERHAM, C. W. STUBER and W. P. WILLIAMS, 1978
Isozyme variation under selection in Zea mays. Nature 232: 570-571. Effect of reciprocal recurrent selection for yield
Genetic control of
on isozyme polymorphisms in maize (Zea mays L.). Crop Science 11: 888-893.
malate dehydrogenase isozymes in maize. Genetics 94: 153-168.
Estimation of linkage disequilibrium in randomly mating populations. Heredity 33 : 229-239.
Selection responses, genetic-environmental interactions, and heterosis with recurrent selection for yield in maize. Crop Science 18: 641-645.
Observed and expected response in four selection ex- periments in maize. Crop Science 6: 319-324.
Comparisons of response to alternative selection proce- dures initiated with two populations of maize (Zea mays L.). Crop Science 11: 706-711.
Drift or selection: A statistical test of gene frequency variation over generations. Genetics 87: 371-379.
Genetics and linkage of PGM. Maize Genet. COOP. News Letter 53: 73-75.
Genetic control and racial varia- tion of p-glucosidase isozymes in maize (Zea mays L.). Biochem. Genet. 15: 383-394.
Frequency changes of isozyme alleles in a selection ex- periment for grain yield i n maize (Zeo mays L.). Crop Science 12: 337-340.
MOLL, R. H. and H. F. ROBINSON, 1966
MOLL, R. H. and C. W. STUBER, 1971
SCHAFFER, H. E., D. YARDLEY and W. W. ANDERSON, 1977
STUBER, C. W. and M. M. GOODMAN, 1979
STUBEH, C. W., M. M. GOODMAN and F. M. JOHNSON, 1977
236
WEIR, B. S., 1979
WEIR, B. S. and C. C. COCKERHAM, 1979 Estimation of linkage disequilibrium in randomly mating populations. Heredity 42 : 105-1 11.
WEISSINGER, H. H., C. W. STUBER and M. M. GOODMAN, 1979 Linkage relationships between isozyme loci in maize. Genetics 91: s136.
YANG, N. S., J. C. SORENSON and J. G. SCANDALIOS, 1977 Genetic control of mitochondrial malate dehydrogenases: Evidence for duplicated chromosome segments. Proc. Natl. Acad. Sci. U.S. 74: 310-314.
Corresponding editor: C. F. WEHRHAHN
c. w. STUBER et al.