GENETICS O F LIFE HISTORY IN DROSOPHILA MELANOGASTER.
I. SIB ANALYSIS OF ADULT FEMALES
MICHAEL R. ROSE1 AND BRIAN CHARLESWORTH
Schwl of Biological Sciences, Uniuersiiy of Sussex, Falmer, Bnghton BNI 9QH, England
Manuscript received January 20, 1980 Revised copy received October 24,1980
ABSTRACT
A sib analysis of adult life-history characters was performed on about twelve hundred females from a laboratory Drosophila melanogaster popula- tion that had been sampled from nature and cultured so as to preserve its genetic variability. The following results were found. There was no detectable trend with age in additive o r dominance genetic variances for age-specific fecundity. Environmental variance for age-specific fecundity increased with age. The genetic variance f o r fecundity characters was primarily additive. The genetic variance f o r longevity was primarily dominance variance. There were negative genetic correlations between early fecundity and lifespan, as well as between mean egg-laying rate and longevity.
UANTITATIVE genetic variation in fitness is of central importance in
Q
evolution. Since viability, fecundity, and longevity characters together con- stitute life history, their underlying genetic structure in turn composes that of fitness. Most research on Drosophila fitness components has dealt with the quantitative genetics of egg-to-adult viability (e.g., MUKAI et al. 1974),
although there has been some work on early fecundity (ROBERTSON 1957; RICHARDSON and KOJIMA 1965), longevity (CLARKE and MAYNARD SMITH 1955; MAYNARD SMITH 1959) and combinations of the three characters (GILBERT 1961, AN- DERSON and WATANABE 1974). The only detailed studies of the genetics of late female fecundity in Drosophila are those by GOWEN andJOHNSON
(1946) and GIESEL (1979),
usingD.
melanogaster inbred lines.This neglect of later life-history characters is understandable, because they can not be accommodated within the framework of conventional, discrete- generation, population genetics theory (cf., CROW and KIMURA 1970). But the recent development of genetical theory for age-structured populations, reviewed by CHARLESWORTH (1976, 1980), has overcome such limitations. Furthermore, this theory shows that the action of natural selection on later adult life-history characters is quantitatively different from that on early life-history characters, with important implications for the evolution of senescence (WILLIAMS 1957; HAMILTON 1966; CHARLESWORTH and WILLIAMSON 1975; CHARLESWORTH 1980).
* Present address. Laboratory of Genetics, University of Wisconsin, Madison, Wisconsin 53706.
Research carried out while the senior author was a Commonwealth Scholar
1
74
M. R. ROSE A N D B. CHARLESWORTHThe present report is concerned with the genetic variation for
D.
melanogasterfemale age-specific fecundity and female longevity in a randomly mating popu- lation. The nature of this variation was ascertained by means of analyses of variance and covariance between full-sib and half-sib families (FALCONER 1960). Selection experiments checking the results of this sib analysis are described in an accompanying article
(ROSE
and CHARLESWORTH 1981).MATERIALS A N D METHODS
A. The experimental population: The population of D. melanogaster used in these experi- ments was derived from 200 males and 200 females collected by P. T. IVES in August, 1975, near South Amherst, Massachusetts. The methods of collection are described in IVES (1970). The South Amherst population of D. melanogaster is among the best known natural populations of Drosophila, having been studied more or less continuously since 1931 (IVES 1970). From these studies, it seems likely that the South Amherst population has been continuously endemic since 1930.
In the laboratory, the flies underwent their entire life cycle at 25" in 10 to 16
y3
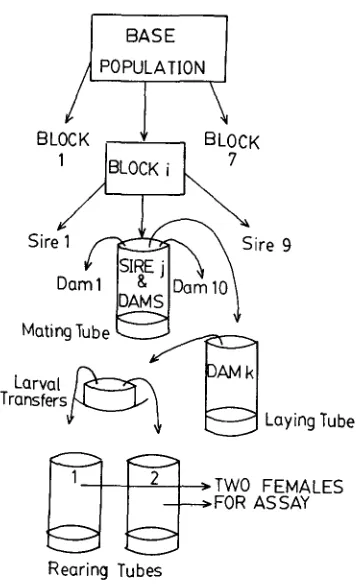
pint milk bottles, each with about 1 inch of Lewis medium and some powdered, live yeast. Discrete gen- erations of 13 to 15 days were maintained, with regular mixing of adults among bottles. The total adult population count never fell below that of the original sample and was typically well into the thousands.B. Sib analysis: The main experiment was replicated as a whole seven times, from April 1977 to June 1978. Virgin females were sampled from the base population at short intervals over a 24-hr period, ensuring that they were within one day of the same age from pupal emergence. Nine groups of up to 10 females were mated to single males of the same age during the period before egg-laying of the phenotypes to be assayed. Two lots of larvae were collected simultaneously for rearing, in separate tubes, from each mated female. Sufficient time was allowed for larval eclosion to preclude the possibility of developmental-rate bias in larval col- lection. A single adult female was finally harvested at random for assay from each of the rear- ing tubes. Thus, common environmental effects on full-sibs were limited to those on eggs im- mediately before laying and larvae just after emergence. (See Figure 1.) The total number of progeny assayed in each replicate of the experiment, or "block", was about 180.
This procedure introduced a significant divergence of full-sib phenotypes after collection for different rearing tubes, because the collection of the first lot of larvae did not require much scraping of the laying surface, while the second collection did. Since the surface of the laying medium was treated with yeast paste, this resulted in an additional quantity of yeast in the second larval rearing tube. As ROBERTSON and SANG (1944) have shown, improvement i n larval nutrition increases the early fecundity of the adult female.
The magnitude of all such rearing-tube effects was estimated in a separate experiment, using the procedures of the sib analysis itself except for the following differences in the method of obtaining the adult phenotypes. Eighteen females were mated to 18 males as pairs. Two sam- ples of larvae were collected for rearing, in separate tubes, from each mated female, as in the sib analysis. Three adult females were harvested f o r assay from each of these rearing tubes.
C . Phenotype assay: All handling was performed a t room temperature, using CO, anaes- thesia. All flies were kept in the same incubator at 25" under constant illumination.
All flies were within 48 h r of age from their oviposition as eggs in the standard laying tube. These laying tubes were plastic, stoppered with cotton wool and 2.5
x
8 centimeters. Each con- tained high-agar medium, with sucrose and yeast as nutritional sources, and charcoal powder added f o r coloring. The laying tube surface was covered with yeast paste to which a small amount of dilute acetic acid had been added.SIB ANALYSIS O F ADULT HISTORY 175
Sire 9
Mating Tube
Laying Tube Larval
Transfers
TWO FEMALES
FOR ASSAY
Rearing Tubes
FIGURE 1.-Sib analysis procedure for generating the phenotypes that were measured. The entire procedure was repeated for seven samples of the base population, as shown, producing 160 to 180 phenotypes for each replication of the experiment, or “block”. About 1200 female pheno- types were assayed for most characters, although some characters, such as longevity, were not assayed for Block 1. See MATERIALS A N D METHODS, part B, f o r further explanation.
original laying tube.) The paper cup was then ejected into a plastic tube containing Lewis medium and powdered yeast. These tubes were incubated for 7 days, and then newly emerged adult females were harvested at intervals t o within 32 h r of the same age from eclosion.
These females were provided with males and kept as pairs f o r two days, to allow mating. (From fertility tests, virtually all females laying eggs after this point had been successfully mated.) After mating, each pair was provided with a new laying tube every 24 h r until the death of the female was recorded. All dead males were replaced by others of the same age. New males were provided for all females every two weeks. All eggs laid on the medium surface or on the sides of the laying tubes were counted at 24-hr intervals after the mating period.
ANALYSIS
176 M. R. ROSE A N D B. CHARLESWORTH
hierarchical analysis of variance, following KEMPTHORNE (1957, pp. 238-243). The derivations and resulting formulae are extremely cumbersome, as may be seen in ROSE (1979); they will not be given here. From these formulae, it was possible to obtain all the source variance components. Then the phenotypic var- iance components were estimated using the conventional formulae for sib anal- yses (cf., FALCONER 1960, pp. 172-1 74).
Sampling variances of estimates of variance components from unbalanced data are not known in general. Only comparatively recently have they been found for the three-way hierarchical, or random effects, model (MAHAMUNULU
1963). The sampling variances for the variance components of the model for the present sib analysis are not known. I n the case of the estimate of the additive genetic variance for daily fecundity, ad hoc confidence intervals were estimated, using three times the nominal standard deviation f o r the estimated parameter, under the assumption of negligible tube effects, as obtained from the formulae of MAHAMUNULU (1963). Confidence intervals for the dominance variance for longevity were obtained by assuming a n approximately balanced design and negligible tube effects, reasonable assumptions for that case, following MENDEN- HALL (1968, pp. 350-352). While other confidence intervals could have been obtained by these approximations, or others, the repetition of the experiment over a number of days allows a more empirical assessment of the estimation ac- curacy. Since exact confidence intervals are not available, the estimates found must be viewed with caution in any case.
B. Analysis of tube effects: The procedure used to estimate the tube effects requires the analysis of variance given in
KEMPTHORNE
(1957, p. 255). Since some observations were missing, the average over the available progeny from the ith larval sample of the jth parent’s progeny, when progeny from both par- ents were present, was used as the basic observation. Linear regression on esti- mated daily fecundity tube effects was used to smooth out the day-to-day varia- tion in these estimates. The predictor values provided by this linear regression were then used in the formulae for the variance components of the sib analysis. C. Analysis of daily fecundity: The analysis of daily fecundity covered assay days 1-25, with the total number of daily observations fluctuating between 1153 and 396. Toward the end of life, the average egg-laying of individual females fails completely. This gives rise to a reasonably unimodal distribution near the mean daily fecundity and a sharp spike at zero fecundity. This spike becomes steadily higher as the assayed group ages, causing a trend of increasing deviation from normality with age from assay days 1 to 25. To remove this biasing factor, all fecundity data was taken to be conditional on non-zero fecundity. That is, zero fecundity was taken to represent a missing data point. The absence of low 24-hour fecundity values, other than zero, indicates that this procedure is bio- logically appropriate.S I B A N A L Y S I S O F A D U L T H I S T O R Y 177
scale effects (WRIGHT 1952, 1968, pp. 230-236). The required transformation was found to be
X t
= log, ( X+
23.81), and was applied to each datum indi- vidually, before the analysis of variance. It must be emphasized that such trans- formations are the only means of making comparisons, betweell variance com- ponents, that are scale-independent.D.
Analysis of aggregate characters: The large amount of data collected for each phenotype allowed the specification of a number of aggregated characters. The characters to be discussed here are: (a) fecundity over a n interval of days conditional only on laying at some p i n t during the interval, (b) longevity de- fined as the last day of assay on which the female was still alive, and (c) the last day of laying, abbreviated as “last day”, defined as the last day of assay on which the female was still alive and had laid eggs, and (d) the laying rate, as given by the total egg-count divided by the last day of lay.In
addition to the analysis of variance for these characters individually, a n analysis of covariance between characters was also performed. The method outlined in KEMPTHORNE (1957, pp. 264-265) was used. For charactersx
and y , this involved the analysis of variance for the linear function(x
4-
y ),
as well asx
and y confined to phenotypes with bothx
and y characters. The components of covariance were then estimated using the general formula 2 Cov(x,y) ,=Var
(x
+
y)-
Var(x)
-
Var (y).
R E S U L T S
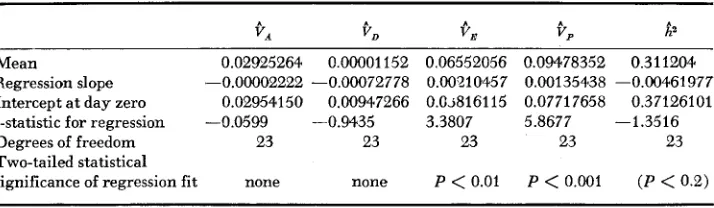
A. Daily fecundity: Table 1 gives means and linear regression statistics for
9,
(estimated phenotypic variance),9,
(estimated additive genetic variance),3,
(estimated dominance genetic variance),en
(estimated environmental vari- ance), andizZ
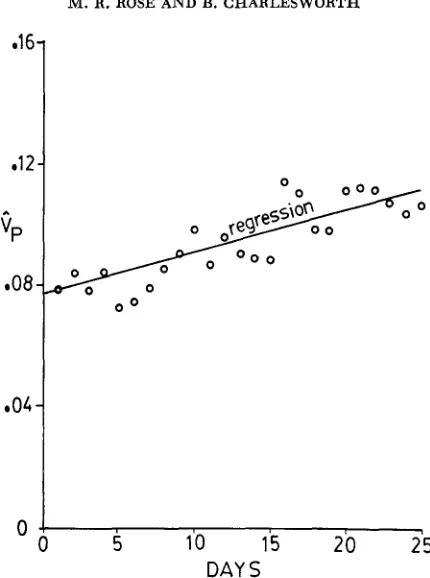
(estimated heritability) from the daily fecundity data f o r assay days 1-25. Figures 2 , 3 , 4 and 5 provide plots ofCp,
e,,
QD, and Vn, respectively,together with their best estimators o r means. The linear regressions are un- weighted.
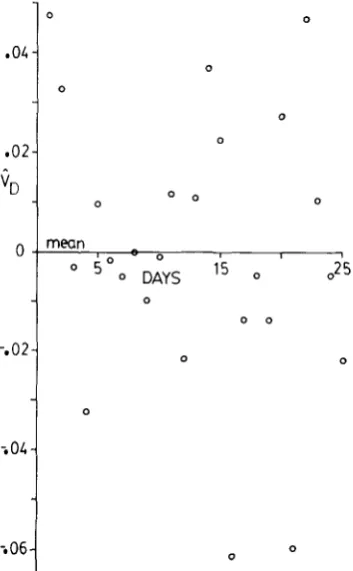
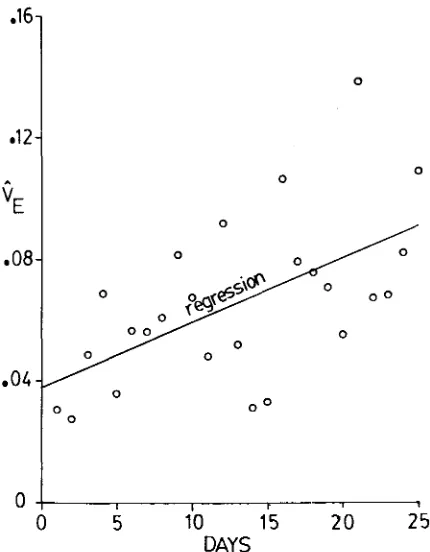
These results indicate that VA and V D do not change with age i n a constant fashion, while V , and
V ,
on the whale increase with age. It is fairly clear that V,, V,, andV p
are greater than zero overall, but there is no evidence that V D isTABLE 3
Mean and regression statistics for USrriance components and heritability for dairy conditional fecundity using transformed data from days I to 25
Mean 0.02925264 0.00001 152 0.06552056 0.09478352 0.311204.
Intercept at day zero 0.02954150 0.00947266 0.0.~816115 0.07717658 0.37126101
Degrees of freedom 23 23 23 23 23
Two-tailed statistical
significance of regression fit none none P
<
0.01 P<
0.001 (P<
0.2) Regression slope -0.00002222 -0.000.72778 0.00210457 0.00135438 -0.00461977178 M. R. ROSE A N D B. CHARLESWORTH e 1 6
.12
ib
e08
a 0 4
0
;
0 0 00 0
0 0
0 0
I
5 10 15 2 0 25
DAYS
FIGURE &.-Estimates of the phenotypic variance, V,, for daily conditional fecundity when transformed so as to be independent of the mean conditional fecundity. The estimates are plotted
against the day of assay. Table 1 shows that the least-squares linear regression of
e,
on day of assay is significant, so that the regression line is plotted with the daily estimates.greater than zero. Though it is probably never exactly zero at any age, the evi- dence does seem to indicate that V D is an order of magnitude smaller than VA.
If
V , andV D
for daily fecundity are in fact independent of age over assay days 1-25, the mean values over the entire period are their best known estimators. SinceV D
is estimated by four times the difference between dam and sire com- ponents of variance in the sib design, the fact that its mean estimate is so close to zero indicates that maternal effects play little role in the determination of fecundity.B. Aggregate characters: Table 2 gives the variance components for the aggre- gate characters, untransformed, under the assumption of significant
V D
(part A.) and negligible V D (part B.). Both analyses were conducted because of the quite low levels ofCD
for all egg-laying characters, aggregate or daily. The decline inCA
for egg-laying totals is a scalh ‘3 artifact.The most notable feature of Table 2 is the large value of
i/,
for longevity: 22.34. Making the simplifications discussed above allows the calculation of a 95% confidence interval lower bound of 3.81 for V D , almost twice the size ofSIB ANALYSIS O F ADULT HISTORY
179
0
0
0
0
0 0 mean
”
d o 0 0
0 O O 0 0
0
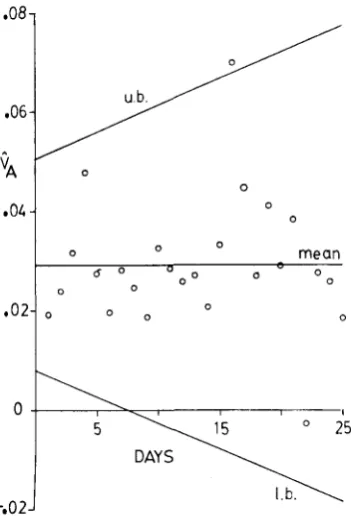
FIGURE 3.-Estimates of the additive genetic variance, V , , for daily conditional fecundity when transformed so as to be independent of the mean conditional fecundity. The estimates are
plotted against day of assay. Table 1 shows that the least-squares linear regression of V A on day of assay is not significant, so that the regression line is not plotted. Instead, the mean value over days 1-25 is plotted. Ad hoc confidence-interval bounds are plotted above and below the mean. These were obtained by linear regression on the daily sampling variance estimates for additive genetic variance estimates, as explained in the ANALYSIS section, part A.
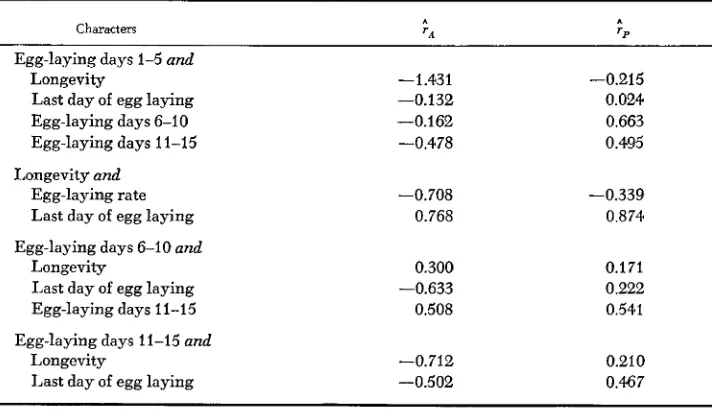
Table 3 gives the additive genetic and phenotypic correlations ( T A and rr, re-
spectively) among those character pairs for which mortality did not substantially bias the results. (Thus, late fecundity data, which is not available for pheno- types that die early, was not used.) Longevity and the last day of laying appear to be closely related characters, both genetically and phenotypically, suggesting that they may be lumped together as “lifespan”. Both early fecundity and the egg-laying rate appear to have an antagonistic relationship with lifespan. Fe- cundity at intermediate ages has a more ambiguous relationship with the other characters. While this set of statistics is suggestive, the sampling variances are evidently large, as indicated by the underestimate of one of the rA by at least 0.431. Therefore, these results must be regarded skeptically, viewed by them- selves. I n any case, it is notable that the ;A and ;p results generally do not cor-
respond, except when ;A is of large magnitude. This suggests that r p estimates
180 M. R. ROSE A N D B. CHARLESWORTH
.04
.02
"D
0
-.02
-8 Q4
i o 6
0 0
0
0
0 0 0 0
mean .
I
O 5 0 0 D& ' 5 0 ,25 0
0 0
0 0
0
0
0
FIGURE 4.-Estimates of the dominance genetic variance, V,, for daily conditional fecundity when transformed so as to be independent of the mean conditional fecundity. The estimates are plotted against the day of assay. Table 1 shows that the least-squares linear regression of V , on day of assay is not significant, so that the regression line is not plotted. Instead, the mean value over days 1-25 is plotted. In this case, the mean value is indistinguishable from the zero axis.
A
DISCUSSION
A.
T h
genetics of life-history characters: The results indicate that there is abundant genetic variability forD.
melanogaster adult female life-history char- acters, and that there m a y be substantial pleiotropy among genes affecting such characters. I n the case of age-specific fecundity, this variability appears to con- sist primarily of additive genetic variance, which is constant in magnitude over most of the adult lifespan once scale effects are removed. By contrast, there ap- pears to be substantial dominance variance for longevity, and little additive vari- ance, although the small number of observations suggests cautious interpreta- tion. Both of these results are also subject tao confounding epistatic variance components (FALCONER 1960), which were assumed to be negligible without sup- porting evidence. Additive genetic correlation estimates suggest the presence of antagonistic gene effects o n egg-laying and lifespan, but these estimates lacked confidence intervals for statistical assessment.SIB ANALYSIS O F ADULT HISTORY 181 a16
.12
CE
a 08
04
0
0
0 0
0
0
0 0 0
I
5 10 15 20 25
DAYS
FIGURE 5.-Estimates of the environmental variance, V,, for daily conditional fecundity when transformed so as to be independent of the mean conditional fecundity. The estimates are plotted
against day of assay. Table 1 shows that the least-squares linear regression of
8,
on day of assay is significant, so that the regression line is plotted with the daily estimates.heritability estimates. ROBERTSON (1957) found a value of 0.18 in experiments based on a population derived from a single impregnated female. Other labora- tory stocks have given fecundity heritability estimates below 0.10 (TANTAWY and EL-HELW 1970). TAIT and PRABHU (1970) studied several populations and estimated heritability as 0.680 in one case, with other populations having herit- abilities in the 0.5 to 0.20 range. The present experiments suggest that, in the absence of inbreeding, the heritability of fecundity, when transformed to be scale-independent, falls from about 0.3-0.4 at early ages to 0.2-0.3 at later ages, due to increasing environmental variance. Without transformation, this fall is enhanced by scale effects, with a higher initial value of heritability. The sig- nificance of the increase i n environmental variance with age is open to a number of theoretical interpretations. However, it might be due entirely to handling methods and therefore be irreproducible. Thus, it seems prudent to await the results of comparable experiments on this matter.
GOWEN and JOHNSON (1946) found negative correlations between what amounted to egg-laying rate and longevity among inbred lines of D. melano-
182 M. R. ROSE A N D B. C H A R L E S W O R T H
TABLE 2
Genetic analysis of aggregate characters
Number of
k observations
Character +A +D +E +P
(A) Assuming V , # 0. Egg-laying :
Days 1-5 Days 6-10 Days 11-15 Days 16-20 Days 21-25 Days 1-10 Longevity: Last day: Laying rate: (B) Assuming V , = 0.
Egg-la ying :
Days 1-5 Days 6-10 Days 11-15 Days 16-20 Days 21-25 Days 1-10 Last day: Laying rate: 4762.60 2933.40 3224.40 3833.20 284.28 14603.92 2.0272 5.3092 64.868 5146.86 2971.40 3687.12 65 1.48 747.42 10107.56 6.9964 55.072 768.50 76.00 231.36 926.28 -8992.72
22.341 6
3.3744 -6363.44 -19.592 0 0 0 0 0 0 0 0 2108.28 6913.11 6740.04 11362.34 5852.70 28001.89 48.6775 59.2228 186.023 2492.54 6951.11 6508.68 8 180.62 63 15.84 23505.53 60.9100 176.227
7639.40 C.6234
9922.51 0.2956
10195.80 0.3162
8832.10 0.4340
7063.26 0.0402
33613.09 0.4345
73.0463 0.0278
67.9064 0.0782
231.299 0.2805
7639.40 0.6737
9922.51 0.2995
10195.80 0.3616
8832.10 0.0738
7063.26 0.1058
33613.09 0.3007
67.9064 0.1030
231.299 0.2381
1177 1145 1039 840 596 1177 962 956 95 6 1177 1145 1039 840 596 1177 956 956
TABLE 3
Estimated genetic and phenotypic correlations
Characters ' A 'P
Egg-laying days 1-5 and
Longevity -1.431 -0.215
Last day of egg laying -0.132 0.024
Egg-laying days 6-10 -0.162 0.663
Egg-laying days 11-15 -0.478 0.495
Longevity and
Egg-laying rate -0.708 -0.339
Last day of egg laying 0.768 0.874
Egg-laying days 6-10 and
Longevity 0.300 0.171
Egg-laying days 11-15 0.508 0.541
Last day of egg laying -0.633 0.222
Egg-laying days 11-15 and
Longevity -0.712 0.21 0
SIB ANALYSIS O F ADULT HISTORY 183
mate for these two characters. GIESEL (1979) performed an experiment on lines that were more heavily inbred than those of GOWEN and
JOHNSON
(1946). Ostensibly in exact contradiction to the results found here and by GOWEN andJOHNSON,
GIESEL found strong positive genetic correlations for characters like fecundity and longevity. Nonetheless, these results do not fundamentally dis- agree. The fitness components of heavily inbred strains depend on the number and severity of recessive deleterious alleles that have been fixed by inbreeding (WRIGHT 1977, pp. 41-43). For alleles of this kind, positive correlations in fit- ness effects is to be expected.TEMIN
(1966) found that complete sterility was positively correlated with reduced viability for Drosophila chromosomes. Like- wise, MUHAI and YAMAZAKI (1971) found no evidence of negative genetic cor- relation between viability and developmental time among newly arisen muta- tions, but none of these results necessarily reflect the genetic correlations to be expected among alleles that are not deleterious.Two studies illustrate this point clearly. HIRAIZUMI (1961) found that chromo- somes that depressed fitness exhibited positive correlation in their effects on two fitness components, while high fitness chromosomes had negative correlations. Similarly, SIMMONS,
PRESTON
and ENGELS (1980) found that newly arisen mu- tations with deleterious effects on viability also reduced other fitness components, but in the case of an equilibrium population, alleles that depressed viability enhanced other fitness components. GIESEL (1979) has provided a survey of low fitness correlations, while the present study provides a survey of those correla- tions that quantitatively predominate in outbred populations. The disparity be- tween the genetic correlation results in the two cases is to be expected from what is known of Drosophila populations, those of other species, and evolutionary theory generally (WRIGHT 1977, passim).There are two complications to the interpretation of the results from the pres- ent experiment. First, the population studied had been in the laboratory for some time, so that its genetic variability cannot be taken as representative of that of the natural population from which it was derived. Indeed, the population was maintained in the laboratory for so long that there seems little doubt that it had largely adapted to the culture conditions and was at, or close to, genetic equi- librium. But this presents no fundamental difficulty if the results are understood as pertaining only to what may occur in a large outbred population, albeit not one in the field.
1844 M. R. ROSE A N D B. CHARLESWORTH
B. The evolution of senescence: It has been theoretically established that the intensity of natural selection on age-specific fitness components declines with age after the onset of reproduction ( MEDAWAR 1952;
WILLIAMS
195 7;HAMILTON
1966; CHARLESWORTH and
WILLIAMSON
1975; CHARLESWORTH 1980). This may give rise to senescence by one or both of two distinct evolutionary pathways. (1 )Deleterious mutations that have effects only on later ages may accumulate be- cause of their virtual neutrality (MEDAWAR 1952; EDNEY and GILL 1968). (2) Alternatively, alleles that have large deleterious effects at later ages may be favored by natural selection because of smaller beneficial effects at early ages
(WILLIAMS
195 7 ) .All other things being equal, the first of these theories implies a n increase with age in the additive genetic variance of fitness components, because selection- mutation equilibrium frequencies for deleterious genes rise with age ( CHARLES-
WORTH 1980, p. 218). However, it is at least conceivable that genes affecting late
fecundity, for example, have smaller effects than those acting at earlier ages. If the magnitude of such effects fell no faster than the mean fecundity, then the transformation used in the analysis of the data (see above), which removed scale effects due to the mean, would have compensated f o r them in the case of the present experiment. Nonetheless, given carefully chosen assumptions about changes in the magnitude of allelic effects, calibrated so that the effects remain sufficient to depress mean fecundity to the extent observed, it might be possible to explain the absence of a n increase in additive genetic variance without reject- ing the mutation-accumulation theory.
While this sort of post hoc escape is possible for any scientific theory, it is generally not acceptable. Accordingly, the absence of any trend towards in- creased additive genetic variance for fecundity constitutes prima facie evidence against the mutation-accumulation theory of senescence.
On the other hand, if the negative additive genetic correlation values for early fecundity and lifespan are at least qualitatively correct, that alone would be sufficient to preclude the possibility that mutation accumulation is solely re- sponsible for senescence in Drosophila melanogaster. If this is indeed the case, substantial indirect responses to selection on individual life-history characters should occur, with changes in early fecundity and lifespan proceeding in oppo- site directions. This possibility is tested in ROSE and CHARLESWORTH (1981).
The authors thank D. S. FALCONER, R. L. FRANKHAM, J. MAYNARD SMITH and J. H. SANG for discussions that aided the planning and interpretation of the experiments. J. F. CROW and J. J. RUTLEDGE made helpful comments on the manuscript.
LITERATURE CITED
ANDERSON, W. W. and T. K. WATANABE, 1974
CHARLESWORTH, B., 1976
Selection by fertility i n Drosophila pseudo-
Natural selection in age-structured populations. pp. 69-87. In: Lec- tures on Mathematics in the Life Sciences, Vol. 8 American Mathematical Society, Provi- dence, R. I. __ , 1980 Evolution in Age-Structured Population. Cambridge University Press, London.
SIB ANALYSIS OF ADULT HISTORY 185
CHARLESWORTH, B. and J. A. WILLIAMSON, 1975 The probability of survival of a mutant gene in an age-structured population and implications for the evolution of life-histories. Genet. Research 26: 1-10.
CLARKE, J. M. and J. MAYNARD SMITH, 1955 The genetics and cytology of Drosophilu sub- obscurrr. XI. Hybrid vigor and longevity. J. Genetics 53: 172-180.
CROW, J. F. and M. KIMURA, 1970 A n Introduction to Population Genetics Theory. Harper and Row, New York.
EDNEY, E. B. and R. W. GILL, 1968 Evolution of senescence and specific longevity. Nature 220:
FALCONER, D. S., 1960 Introduction to Quantitatiue Genetics. Oliver and Boyd, Edinburgh. GIESEL, J. T., 1979 Genetic co-variation of survivorship and other fitness indices in Drosophila
GILBERT, N., 1961 Quantitative inheritance in Drosophila. J. Genetics 57: 77-83.
GOWEN, J. W. and L. E. JOHNSON, 1946 On the mechanism of heterosis. I. Metabolic capacity of different races of Drosophila melanogaster for egg production. Am. Naturalist 80: 14.9- 179.
HAMILTON, W. D., 1966 The moulding of senescence by natural selection. J. Theor. Biol. 12: l M .
HIRAIZUMI, Y., 1961 Negative correlation between rate of development and female fertility in Drosophila melanogaster. Genetics 46 : 615-6%.
IVES, P. T., 1970 Further studies of the South Amherst population of Drosophila melanogaster.
Evolution 24: 507-518.
KEMPTHORNE, O., 1957 A n Introduction to Genetic Statistics. John Wiley and Sons, New York. MAHAMUNULU, D. M., 1963 Sampling variances of the estimates of variance components in
the unbalanced 3-way nested classification. Ann. Math. Statist. 34: 521-527.
MAYNARD SMITH, J., 1959 Sex-limited inheritance of longevity in Drosophila subobscura. J. Genetics 56: 1-9.
MEDAWAR, P. B., 1952 MENDENHALL, W., 1968
MUKAI, T., 1977 281-282.
melanogaster. Exp. Geront. 14: 323-328.
A n Unsolued Problem of Biology. H. K. Lewis, London.
An Introduction to Linear Models and the Design and Analysis of
Variance. Duxbury Press, North Scituate, Mass.
Lack of experimental evidence supporting selection for the maintenance of isozyme polymorphisms in Drosophila melanogaster. Proc. Taniguchi Int. Symp. Biophys.
2: 106-126.
The genetic variance for viability and its compments i n a local population of Drosophila melanogaster. Genetics 7 8 :
The genetic structure of natural populations of Drosophih
The kinds of genetic variability in relation to selec- MUKAI, T., R. A. CARDELLINO, T. K. WATANABE and J. F. CROW, 1974
1195-1208.
MUKAI, T. and T. YAMAZAKI, 1971
RICHARDSON, R. H. and K. KOJIMA, 1965
melanogaster. X. Developmental time and viability. Genetics 69 : 385-398.
tion responses in Drosophila fecundity. Genetics 52 : 583-598.
Studies i n quantitative inheritance. XI, Genetic and environmental correlation between body size and egg production in Drosophilz melanogaster. J. Genetics 55: 428-448.
The ecological determinants of population growth in
Quantitative genetics of adult female life-history i n Drosophila melanogaster.
ROBERTSON, F. W., 1957
ROBERTSON, F. W. and 5. H. SANG, 1944.
ROSE, M. R., 1979
a Drosophila culture. I. Fecundity of adult flies. Proc. Roy. Soc. B. 132: 258-277.
186 M. R. ROSE A N D B. C H A R L E S W O R T H
ROSE, M. R. and B. CHARLESWORTH, 1981
SIMMONS, M. J., C . R. PRESTON and W. R. ENGELS, 1980
TAIT, W. M. and S. S. PRABHU, 1970
TANTAWY, A. 0. and M. R. EL-HELW, 1970
Genetics of life history in Drosophila melanogaster.
11. Exploratory selection experiments. Genetics 97: 187-196.
Pleiotropic effects on fitness of mu- tations affecting viability in Drosophila melanogaster. Genetics 9 4 : N7-4.75.
Fecundity and hatchability in Drosophila melanogaster
with a second chromosome held unchanged. J. Genetics 60: 152-158.
Studies on natural populations of Drosophila. I X . Some fitness components and their heritabilities in natural and mutant populations of
Drosophila melanogaster. Genetics 64: 79-91.
Homozygous viability and fertility loads in Drosophila melanogaster.
Genetics 53: 2746.
Pleiotropy, natural selection, and the evolution of senescence. Evolution
The genetics of quantitative variability. pp. 5-41. In: Quantitative Znherit- ance. Edited by C. H. WADDINGTON and E. C. R. REEVE, Her Majesty’s Stationery Office, London. - , 1968 Evolution and the Genetics of Populations, Vol. I. University of Chicago Press, Chicago. - , 1977 Evolution and the Genetics of PopuZations, Vol. 111. University of Chicago Press, Chicago.
Corresponding editor: W. W . ANDERSON TEMIN, R. G., 1966
WILLIAMS G. C., 1957